. 2022 Nov 14:15:926567.
doi: 10.3389/fnmol.2022.926567. eCollection 2022.

PP2A phosphatase regulates cell-type specific cytoskeletal organization to drive dendrite diversity

Affiliations

PP2A phosphatase regulates cell-type specific cytoskeletal organization to drive dendrite diversity

Shatabdi Bhattacharjee et al. Front Mol Neurosci. .

Abstract

Uncovering molecular mechanisms regulating dendritic diversification is essential to understanding the formation and modulation of functional neural circuitry. Transcription factors play critical roles in promoting dendritic diversity and here, we identify PP2A phosphatase function as a downstream effector of Cut-mediated transcriptional regulation of dendrite development. Mutant analyses of the PP2A catalytic subunit (mts) or the scaffolding subunit (PP2A-29B) reveal cell-type specific regulatory effects with the PP2A complex required to promote dendritic growth and branching in Drosophila Class IV (CIV) multidendritic (md) neurons, whereas in Class I (CI) md neurons, PP2A functions in restricting dendritic arborization. Cytoskeletal analyses reveal requirements for Mts in regulating microtubule stability/polarity and F-actin organization/dynamics. In CIV neurons, mts knockdown leads to reductions in dendritic localization of organelles including mitochondria and satellite Golgi outposts, while CI neurons show increased Golgi outpost trafficking along the dendritic arbor. Further, mts mutant neurons exhibit defects in neuronal polarity/compartmentalization. Finally, genetic interaction analyses suggest β-tubulin subunit 85D is a common PP2A target in CI and CIV neurons, while FoxO is a putative target in CI neurons.

Keywords: Drosophila; cytoskeleton; dendrite; microtubules; neuronal polarity; protein phosphatase 2A; transcriptional regulation.


Conflict of interest statement

The authors declare that the research was conducted in the absence of any commercial or financial relationships that could be construed as a potential conflict of interest.

Figures
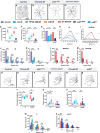
FIGURE 1
FIGURE 1
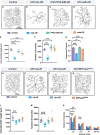
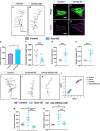
PP2A regulates cell-type specific dendritic arborization in CI and CIV md neurons. (A–D) Representative images of dendritic arbors of CIV (ddaC) neurons in (A) controls, (B) mts-IR, (C) mtsk12502 MARCM clone, (D) PP2A-29B-IR. (E–G) Quantitative morphometric analyses. (H,I) Sholl profiles of control vs. mts-IR or PP2A-29B-IR (H), and mtsk12502 MARCM (I). (J–M) Strahler analysis of control, mts-IR, PP2A-29B-IR (J,K) and mtsk12502 MARCM (L,M). (N–S) Representative images of dendritic arbors of CI (ddaE) neurons in (N) controls, (O) mts-IR, (P) mtsk12502 MARCM, (Q) PP2A-29B-IR, (R) wdb-IR, and (S) wdb14 MARCM. (T–V) Quantitative morphometric analyses. (W,X) Strahler analysis of control vs. mts-IR, PP2A-29B-IR, or wdb-IR (W) and mtsk12502 or wdb14 MARCM (X). Statistical tests performed: (E–G) one-way ANOVA with Sidak’s multiple comparisons, (H,I) Kruskal Wallis with Dunn’s multiple comparison, (J–M) two-way ANOVA with Dunnett’s test for multiple comparison, (T–V) one-way ANOVA with Sidak’s multiple comparisons or Kruskal Wallis with Dunn’s multiple comparison, (W,X) two-way ANOVA with Dunnett’s test for multiple comparison. ***p ≤ 0.001, **p ≤ 0.01, *p ≤ 0.05. For (E–L), n = 10–15 per genotype. For (S–X), n = 12–34 per genotype. For detailed genotypes see Supplementary Table 1 and for detailed statistics see Supplementary Table 2. Quantitative data is reported as mean ± SEM. For Sholl analysis, values are mean ± SEM for the number of intersections as a function of radial distance from the cell body (zero). For Strahler analysis, values are mean ± SEM for the number of dendritic branches in each branch order (Strahler Order), for CIV neurons, 7th is the primary branch closest to the soma and 1st is the terminal branch. For CI neurons, 4th is the primary branch closest to the soma and 1st is the terminal branch. Scale bar = 200 μm.
FIGURE 2
FIGURE 2
PP2A overexpression impairs dendritic morphogenesis and the PP2A and STRIPAK complexes act in parallel to regulate dendritic complexity in CIV md neurons: (A–D) representative images of dendritic arbors of CIV (ddaC) neurons in panel (A) controls, (B) mts-OE, (C) PP2A-29B-OE, (D) wdb-OE. OE, overexpression. (E–G) Quantitative morphometric analyses. (H–K) Representative images of dendritic arbors of CIV (ddaC) neurons in panel (H) controls, (I) cka-IR, (J) cka-OE, (K) BFP-CkaΔ PP2A, (L,M) quantitative morphometric analyses. (N) Strahler analysis of controls, cka-IR, cka-OE, and BFP-CkaΔ PP2A. Statistical tests performed: (E–G) one-way ANOVA with Dunnett’s multiple comparison test (n = 10–14 per genotype); (L,M) Kruskal Wallis with Dunn’s multiple comparison; (N) two-way ANOVA with Dunnett’s test for multiple comparison (n = 10–13 per genotype), ***p ≤ 0.001, **p ≤ 0.01, *p ≤ 0.05. For detailed genotypes see Supplementary Table 1 and for detailed statistics see Supplementary Table 2. Quantitative data is reported as mean ± SEM. For Strahler analysis, values are mean ± SEM for the number of dendritic branches in each branch order (Strahler Order) here 7th is the primary branch closest to soma and 1st is the terminal branch. (Scale bars = 200 μm).
FIGURE 3
FIGURE 3
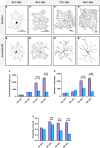
PP2A is required for dendrite growth in late larval development: representative images of CIV md neurons of (A–A”’) controls and (B–B”’) mts-IR at 24, 48, 72, and 96 h after egg laying (AEL), respectively. (C–E) Quantitative morphometric analyses. Statistical tests performed: two-way ANOVA with Sidak’s multiple comparisons (n = 9–20 per genotype) ***p ≤ 0.001. For detailed genotypes see Supplementary Table 1 and for detailed statistics see Supplementary Table 2. Quantitative data is reported as mean ± SEM. Scale bar = 50 μm for panel (A), scale bar = 100 μm for panel (A’–A”’).
FIGURE 4
FIGURE 4
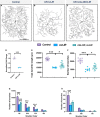
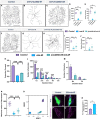
PP2A is required for Cut-mediated dendritic arborization. (A–C) Representative images of panel (A) control, (B) ct-IR, (C) ct-IR/mts-OE of CIV ddaC md neurons. (D) qPCR analyses of mts expression levels in control and ct-IR CIV neurons. (E,F) Quantitative morphometric analyses. (G,H) Strahler analysis of controls, ct-IR, and ct-IR; mts-OE. Statistical tests performed: (D) unpaired t-test (n = 4); (E,F) one-way ANOVA with Sidak’s multiple comparison; (G,H) two-way ANOVA with Tukey’s test for multiple comparison (n = 9–17 per genotype), ***p ≤ 0.001, *p ≤ 0.05. For detailed genotypes see Supplementary Table 1 and for detailed statistics see Supplementary Table 2. Quantitative data is reported as mean ± SEM. For Reverse Strahler analysis, values are mean ± SEM for the number of dendritic branches in each branch order (Strahler Order) here 7th is the primary branch closest to soma and 1st is the terminal branch. Scale bar = 200 μm.
FIGURE 5
FIGURE 5
PP2A regulates MT stability and F-actin organization in md neurons: representative images of CIV md neurons in panel (A–A”) control and (B–B”) mts-IR expressing UAS-GMA (labeling F-actin) and UAS-mCherry::JUPITER (labeling MTs). (C–D’,M–N’) Intensity heatmaps of MT and F-actin distributions in the dendritic arbor generated by a combination of Vaa3D multi-signal plugin, Neutube, and TREES Toolbox (MATLAB). (E,H) Relative subcellular distribution of MTs and F-actin along the dendritic arbor as a function of path distance from the soma. (F,G,K,Q,S) MT and F-actin quantities by Strahler order distribution normalized to dendritic length. (J,P,R) Total MT (P) and F-actin (J,R) quantities normalized to 1 for either Class I or Class IV control neurons. (I,T) Peak F-actin intensity as function of distance from soma. Representative images of CI md neurons in panel (L–L”) control and (M–M”) mts-IR expressing UAS-GMA and UAS-mCherry::JUPITER. Statistical tests performed: (E–H,K,Q,S) multiple t-test or Mann-Whitney test with False Discovery Rate correction; (I,J,P,R,T) unpaired t-test or Mann-Whitney U test. ***p ≤ 0.001, **p ≤ 0.01, *p ≤ 0.05 (for E,G, *p ≤ 0.001). For detailed genotypes see Supplementary Table 1 and for detailed statistics see Supplementary Table 2. Scale bar = 20 μm for panel (A–A”), and scale bar = 50 μm for panel (L–L”). For (E–K) n = 11, and for panel (P–T) n = 8–9 per genotype.
FIGURE 6
FIGURE 6
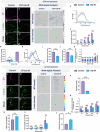
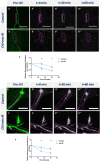
PP2A is required to regulate cytoskeletal dynamics: time-lapse imaging of MT turnover in panel (A–A”’) controls and (B–B”’) mts-IR. (C) Quantitative analysis showing the turnover rate of MTs over a period of 60 min. Time-lapse imaging of F-actin turnover in panel (D–D”’) controls and (E–E”’) mts-IR. (F) Quantitative analysis showing the turnover rate of F-actin over a period of 60 min. Statistical tests performed: two-way ANOVA with Sidak’s multiple comparisons (n = 8–13 per genotype). ***p ≤ 0.001, **p ≤ 0.01. For detailed genotypes see Supplementary Table 1 and for detailed statistics see Supplementary Table 2. Scale bars = 10 μm.
FIGURE 7
FIGURE 7
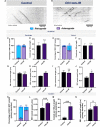
PP2A disruption leads to reversal of MT polarity: Kymographs of EB1::GFP comet trajectories in CIV neurons in panel (A) control and (B) mts-IR. Relative to controls which show minus end out microtubule polarity in proximal dendrites and plus end out polarity in axons, knockdown of mts leads to reversal of microtubule polarity in md neuron dendrites (C,K) and axons (E). Further, mts knockdown leads to an increase in EB1 comet velocities compared to controls in both CI and CIV md neurons in both dendrites and axons (H,J,L). Comet track length and number of comets are unaffected due to knockdown of mts in CIV dendrites (D,F,G,I), while in CI, there is significant increase in number of comets while track length is unchanged (M,N). Identical settings for laser intensity and other image capture parameters were applied for comparisons of control vs. experimental samples. Statistical tests performed: (C,E,K) two-way ANOVA with Sidak’s or Dunnett’s multiple comparison test (n = 42–72 comets), (D,F,G–J,L–N) student’s t-test or Mann-Whitney U test (n = 9–67 per genotype). ***p ≤ 0.001, **p ≤ 0.01, *p ≤ 0.05. For detailed genotypes see Supplementary Table 1 and for detailed statistics see Supplementary Table 2.
FIGURE 8
FIGURE 8
PP2A is required for organelle trafficking in md neurons: Representative images of CIV neurons in panel (A–A”) control and (B–B”) mts-IR expressing γ-tubulin-GFP under the control of a CIV-GAL4 driver. (C) Quantitative analysis showing γ-tubulin localization along the dendrite normalized to dendrite length. Representative images of CIV neurons in panel (D) control and (E) mts-IR expressing Patronin-GFP under the control of CIV-GAL4 driver. (F) Quantification of mean fluorescence intensities of Patronin-GFP normalized to area. Representative images of CIV and CI neurons in panel (G,G’,I,I’) control and (H,H’,J,J’) mts-IR animals, respectively, expressing UAS-mito-GFP under the control of CIV or CI GAL4 driver. (K,M) Quantitative analysis showing mitochondria localization along the dendrite normalized to dendrite length and (L,N) percentage of branch points with mitochondria. Statistical tests performed: (C,F,K–N) student’s t-test or Mann-Whitney U test (n = 7–14 per genotype). ***p ≤ 0.001, **p ≤ 0.01. For detailed genotypes see Supplementary Table 1 and for detailed statistics see Supplementary Table 2. Scale bars: (A–A”,G,G’,I,I’) = 50 μm, (D) = 5 μm.
FIGURE 9
FIGURE 9
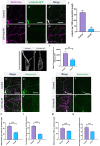
PP2A has cell-type specific effects of Golgi outpost localization in md neurons: Representative images of CIV and CI neurons in panel (A,A’,C,C’) control and (B,B’,D,D’) mts-IR animals, respectively, expressing UAS-MANII-eGFP under the control of CIV or CI GAL4 driver. (E,G) Quantitative analysis showing Golgi outposts localization along the dendrite normalized to dendrite length and (F,H) percentage of branch points with Golgi outposts. Representative images of the CIV axon terminals in the ventral nerve cord (VNC) in panel (I) control and (J) mts-IR animals. Representative images of the proximal axons of CIV neurons in panel (K) control and (L) mts-IR animals. Arrow indicates ectopic axon branching. (M) Quantitative analysis showing the percentage of proximal axons with branching in control and mts-IR neurons. Representative images of CIV and CI axons in panel (N,N’,Q,Q’) control and (O,O’,R,R’) mts-IR animals, respectively, expressing UAS-MANII-eGFP under the control of CIV or CI GAL4 driver. Arrows indicate axons. (P,S) Quantitative analysis showing Golgi outposts localization along the axon normalized to length. Statistical tests performed: (E–H,M,P,S) student’s t-test or Mann-Whitney U test (n = 10–19 per genotype). ***p ≤ 0.001, **p ≤ 0.01, *p ≤ 0.05. For detailed genotypes see Supplementary Table 1 and for detailed statistics see Supplementary Table 2. Scale bar = 50 μm.
FIGURE 10
FIGURE 10
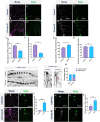
PP2A and FoxO genetically interact in CI md neurons: representative images of CI neurons in panel (A) control and (B) foxo-OE. Representative images showing immunohistochemical analysis of FoxO expression in panel (C,C’) control, and (D,D’) mts-IR expressing CI neurons. (E) Quantitative analysis of mean fluorescence intensities of FoxO normalized to area in CI neurons. (F–H) Quantitative morphometric analyses. Representative images of CI neurons in panel (I) control, (J) mts-IR, and (K) mts-OE/foxo-OE conditions. (M,N) Quantitative morphometric analyses. (L) tSNE plot showing the clustering of control, mts-IR, foxo-OE, and mts-OE/foxo-OE neurons. Statistical tests performed: (F–H) student’s t-test (n = 10–29 per genotype); (M,N) one-way ANOVA with Sidak’s multiple comparison (n = 10–14 per genotype). ***p ≤ 0.001, *p ≤ 0.05. For detailed genotypes see Supplementary Table 1 and for detailed statistics see Supplementary Table 2. Scale bars = 100 μm for panel (A,I), and scale bar = 5 μm for panel (C,C’).
FIGURE 11
FIGURE 11
PP2A and β-tubulin 85D genetically interact in CIV md neurons: Representative images of CIV neurons in panel (A) control, (B) β-tubulin85D-IR, and (C) β-tubulin85D-OE. (D,E) Quantified morphometric analyses. Representative images of CIV neurons in panel (F) control, (G) mts-IR, and (H) β-tubulin85D-OE/mts-IR animals. (I–K,N) Quantitative morphometric analyses. (O) tSNE plot showing clustering of control, mts-IR, and β-tubulin85D-OE/mts-IR expressing neurons. Representative images showing immunohistochemical analysis of p-S172 β-tubulin expression in CIV neurons in panel (P,P’) control and (Q,Q’) mts-IR conditions. (R) Quantitative analysis of mean fluorescence intensities of p-S172 β-tubulin normalized to area in CIV neurons. Statistical tests performed: (D,E) one-way ANOVA with Dunnett’s multiple comparison (n = 13 per genotype), (I–K,N) One-way ANOVA with Sidak’s multiple comparison and Kruskal-Wallis with Dunn’s multiple comparison (n = 10–12 per genotype), (L,M) two-way ANOVA with Tukey’s multiple comparison (n = 10–12 per genotype), (R) student’s t-test (n = 24–32 per genotype). ***p ≤ 0.001, *p ≤ 0.05. For detailed genotypes see Supplementary Table 1 and for detailed statistics see Supplementary Table 2. Scale bar = 200 μm for panel (A,F); scale bar = 5 μm for panel (P–P”).
FIGURE 12
FIGURE 12
PP2A genetically interacts with β-tubulin85D in CI md neurons: Representative images of CI neurons in panel (A) control and (B) β-tubulin85D-IR. (C–F) Quantitative morphometric analyses. Representative images of CI neurons in panel (G) control, (H) mts-IR, and (I) β-tubulin85D-OE/mts-IR animals. (J) tSNE plot showing clusters of control, mts-IR, and β-tubulin85D-OE/mts-IR neurons. (K–M) Quantitative morphometric analyses. Statistical tests performed: (C–E) student’s t-test (n = 10–19 per genotype), (F) unpaired t-test with False Discovery rate correction (n = 10–19 per genotype), (K,L) one-way ANOVA with Sidak’s multiple comparison or Kruskal-Wallis with Dunn’s multiple comparison (n = 10–19 per genotype), (M) two-way ANOVA with Tukey’s multiple comparison test (n = 10–19 per genotype). ***p ≤ 0.001, **p ≤ 0.01, *p ≤ 0.05. For detailed genotypes see Supplementary Table 1 and for detailed statistics see Supplementary Table 2. Scale bar = 100 μm for panel (A), and scale bar = 50 μm for panel (G).

Similar articles

Cited by

References

    1. Akhmanova A., Hoogenraad C. C. (2015). Microtubule minus-end-targeting proteins. Curr. Biol. 25 R162–R171. 10.1016/j.cub.2014.12.027 - DOI - PubMed
    1. Akram M. A., Nanda S., Maraver P., Armañanzas R., Ascoli G. A. (2018). An open repository for single-cell reconstructions of the brain forest. Sci. Data 5:180006. 10.1038/sdata.2018.6 - DOI - PMC - PubMed
    1. Arikkath J. (2012). Molecular mechanisms of dendrite morphogenesis. Front. Cell. Neurosci. 6:61. 10.3389/fncel.2012.00061 - DOI - PMC - PubMed
    1. Arthur A. L., Yang S. Z., Abellaneda A. M., Wildonger J. (2015). Dendrite arborization requires the dynein cofactor NudE. J. Cell Sci. 128 2191–2201. 10.1242/jcs.170316 - DOI - PMC - PubMed
    1. Caudron F., Denarier E., Thibout-Quintana J. C., Brocard J., Andrieux A., Fourest-Lieuvin A. (2010). Mutation of Ser172 in yeast β tubulin induces defects in microtubule dynamics and cell division. PLoS One 5:e13553. 10.1371/journal.pone.0013553 - DOI - PMC - PubMed

LinkOut - more resources