. 2022 Nov 14:12:982833.
doi: 10.3389/fonc.2022.982833. eCollection 2022.

Development and validation of nomograms predicting postoperative survival in patients with chromophobe renal cell carcinoma

Affiliations

Development and validation of nomograms predicting postoperative survival in patients with chromophobe renal cell carcinoma

Shuaishuai Li et al. Front Oncol. .

Abstract

Objective: The purpose of our study is to construct and validate nomograms that effectively predict postoperative overall survival and cancer-specific survival for patients with chromophobe renal cell carcinoma (chRCC).

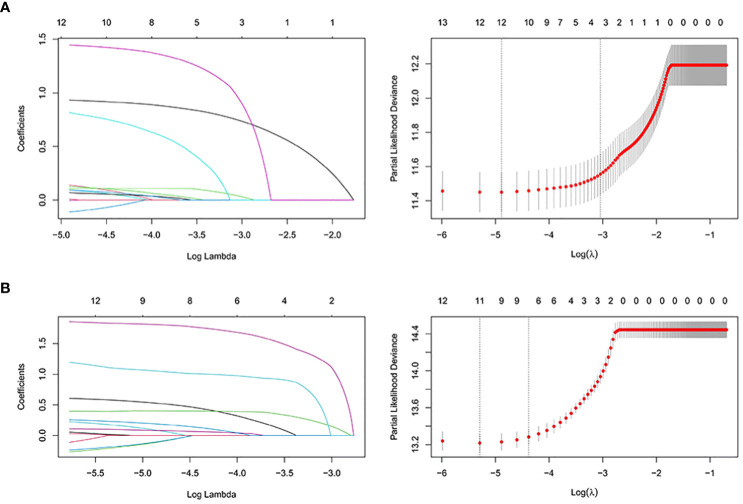
Method: Clinical, social, and pathological data from 6016 patients with chRCC collected from the SEER database were screened from 2004 to 2015. They were randomly assigned to a training cohort (n = 4212) and a validation cohort (n = 1804) at a 7:3 ratio. Cox regression and least absolute shrinkage and selection operator (LASSO) analyses were used to identify the prognostic factors affecting overall survival (OS) and cancer-specific survival (CSS) and establish nomograms. Their performance was validated internally and externally by calculating Harrell's C-indexes, area under the curve (AUC), calibration, and decision curves. For external validation, samples from postoperative patients with chRCC at 3 independent centers in Xuzhou, China, were collected. Risk stratification models were built according to the total scores of each patient. Kaplan-Meier curves were generated for the low-risk, intermediate-risk, and high-risk groups to evaluate survival.

Results: The C-indexes, AUC curves, and decision curves revealed the high ability of the nomograms in predicting OS and CSS, overall better than that of AJCC and TNM staging. Moreover, in internal and external validation, the calibration curves of 5-, 8-, and 10-year OS agreed with the actual survival. Kaplan-Meier curves indicated significant differences in survival rates among the 3 risk groups in OS or CSS.

Conclusion: The nomograms showed favourable predictive power for OS and CSS. Thus, they should contribute to evaluating the prognosis of patients with chRCC. Furthermore, the risk stratification models established on the nomograms can guide the prognosis of patients and further treatment.

Keywords: SEER; cancer-specific survival; chromophobe renal cell carcinoma; nomogram; overall survival; prognosis; validation.


Conflict of interest statement

The authors declare that the research was conducted in the absence of any commercial or financial relationships that could be construed as a potential conflict of interest.

Figures

Figure 1
Figure 1
Flowchart of the study.
Figure 2
Figure 2
Competitive risk curves for causes of death in chRCC patients (A): Cumulative Incidence for All Group; (B): Cumulative Incidence for Each Group; (C): Interaction Between Different Outcomes [Front (1: Female, 2: Male); Back (1: ChRCC; 2: Diseases of the blood system; 3: Digestive diseases; 4: Cardiovascular disease; 5: Nervous system and cerebrovascular diseases; 6: Respiratory diseases; 7: Diseases of endocrine system; 8: Other oncological diseases; 9: Urinary system and kidney diseases; 10. Other rare diseases (including suicide); 11: Unknown cause.)].
Figure 3
Figure 3
Diagnosis rate curves for chRCC patients from 2000 to 2019.
Figure 4
Figure 4
X-tile stratification. (A) Optimal cutoff points for age were 63 and 75 years in OS; P value of corresponding Kaplan–Meier curve was<0.05. Optimal cutoff point of year of diagnosis were 2006 and 2014; P value of corresponding Kaplan–Meier curve was<0.05 in OS. Optimal cutoff point of month from diagnosis to treatment was 1 in OS; P value of corresponding Kaplan–Meier curve was<0.05. Optimal cutoff point of tumor size were 20 mm and 48 mm in OS; P value of corresponding Kaplan–Meier curve was<0.05. (B) Optimal cutoff points for age were 61 and 73 years in CSS; P value of corresponding Kaplan–Meier curve was<0.05. Optimal cutoff point of year of diagnosis were 2006 and 2011; P value of corresponding Kaplan–Meier curve was<0.05 in CSS. Optimal cutoff point of month from diagnosis to treatment was 1 in CSS; P value of corresponding Kaplan–Meier curve was<0.05. Optimal cutoff point of tumor size were 48 mm and 85 mm in CSS; P value of corresponding Kaplan–Meier curve was<0.05.
Figure 5
Figure 5
The LASSO regression used to select prognostic factors for OS and CSS. (A) LASSO coefficient profiles of variables for OS; LASSO analysis identified 12 variables for OS. (B) LASSO coefficient profiles of variables for CSS; LASSO analysis identified 12 variables for CSS. LASSO: least absolute shrinkage and selection operator.
Figure 6
Figure 6
Nomograms for predicting 5-, 8-, and 10-year (A) OS and (B) CSS. OS, overall survival; CSS, cancer-specific survival; AJCC, American Joint Commission on Cancer; Marital status (Other): Divorced and Widowed.
Figure 7
Figure 7
AUC curves of the nomogram, AJCC stage, and TNM stage for OS and CSS. AUC curves of the nomogram, AJCC stage, and TNM stage in prediction of prognosis at 5-, 8-, and 10-year point in the (A) training cohort for OS, (B) training cohort for CSS, (C) validation cohort for OS and (D) validation cohort for CSS.
Figure 8
Figure 8
Calibration curves for the OS nomogram. 5-, 8-, and 10-year calibration curves for the OS nomogram in the (A) training cohort and (B) validation cohort.
Figure 9
Figure 9
Calibration curves for the CSS nomogram. 5-, 8-, and 10-year calibration curves for the CSS nomogram in the (A) training cohort and (B) validation cohort.
Figure 10
Figure 10
DCA curve of the nomogram, AJCC stage and TNM stage for (A) OS and (B) CSS in the training and validation cohort. DCA, decision curve analysis; AJCC, American Joint Commission on Cancer; OS, overall survival; CSS, cancer-specific survival.
Figure 11
Figure 11
Calibration curves for the OS nomogram. 5-, 8-, and 10-year calibration curves for the OS nomogram in the external validation cohort.
Figure 12
Figure 12
Kaplan-Meier curves of the low-, intermediate- and high-risk groups in training group and validation group for OS and CSS (A) Kaplan-Meier curves for OS in training group; (B) Kaplan-Meier curves for OS in validation group;(C) Kaplan-Meier curves for CSS in training group; (D) Kaplan-Meier curves for CSS in validation group).

Similar articles

Cited by

References

    1. Dunnick NR. Renal cell carcinoma: Staging and surveillance. Abdom Radiol (NY) (2016) 41(6):1079–85. doi: 10.1007/s00261-016-0692-0 - DOI - PubMed
    1. Thoenes W, Storkel S, Rumpelt HJ. Human chromophobe cell renal carcinoma. Virchows Arch B Cell Pathol Incl Mol Pathol (1985) 48(3):207–17. doi: 10.1007/BF02890129 - DOI - PubMed
    1. Peyromaure M, Misrai V, Thiounn N, Vieillefond A, Zerbib M, Flam TA, et al. . Chromophobe renal cell carcinoma: Analysis of 61 cases. Cancer (2004) 100(7):1406–10. doi: 10.1002/cncr.20128 - DOI - PubMed
    1. Ornellas AA, Andrade DM, Ornellas P, Wisnescky A, Schwindt AB. Prognostic factors in renal cell carcinoma: Analysis of 227 patients treated at the Brazilian national cancer institute. Int Braz J Urol (2012) 38(2):185–94. doi: 10.1590/S1677-55382012000200006 - DOI - PubMed
    1. Vera-Badillo FE, Conde E, Duran I. Chromophobe renal cell carcinoma: A review of an uncommon entity. Int J Urol (2012) 19(10):894–900. doi: 10.1111/j.1442-2042.2012.03079.x - DOI - PubMed

LinkOut - more resources