. 2022 Nov 1;2(11):100321.
doi: 10.1016/j.crmeth.2022.100321. eCollection 2022 Nov 21.

Normalization benchmark of ATAC-seq datasets shows the importance of accounting for GC-content effects

Affiliations

Normalization benchmark of ATAC-seq datasets shows the importance of accounting for GC-content effects

Koen Van den Berge et al. Cell Rep Methods. .

Abstract

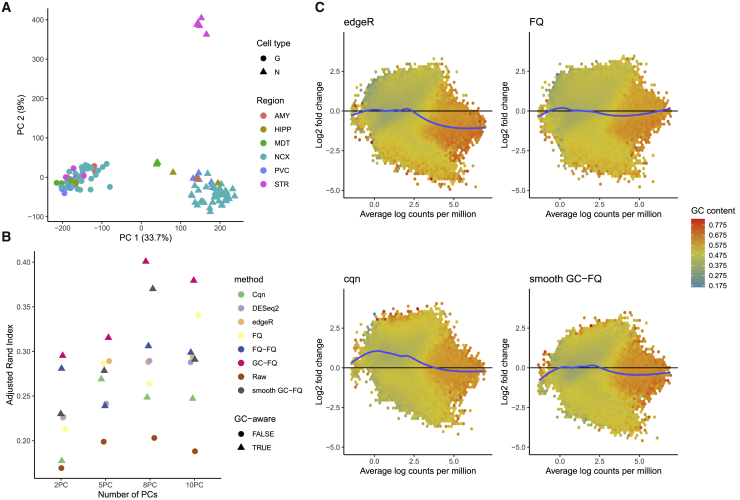
The assay for transposase-accessible chromatin using sequencing (ATAC-seq) allows the study of epigenetic regulation of gene expression by assessing chromatin configuration for an entire genome. Despite its popularity, there have been limited studies investigating the analytical challenges related to ATAC-seq data, with most studies leveraging tools developed for bulk transcriptome sequencing. Here, we show that GC-content effects are omnipresent in ATAC-seq datasets. Since the GC-content effects are sample specific, they can bias downstream analyses such as clustering and differential accessibility analysis. We introduce a normalization method based on smooth-quantile normalization within GC-content bins and evaluate it together with 11 different normalization procedures on 8 public ATAC-seq datasets. Accounting for GC-content effects in the normalization is crucial for common downstream ATAC-seq data analyses, improving accuracy and interpretability. Through case studies, we show that exploratory data analysis is essential to guide the choice of an appropriate normalization method for a given dataset.

Keywords: ATAC-seq; GC-content; clustering; differential accessibility; epigenetics; normalization.


Conflict of interest statement

The authors declare no competing interests.

Figures

None
Graphical abstract
Figure 1
Figure 1
GC-content effects are sample specific and confound differential accessibility analysis (A) Fitted lowess curves of log-count as a function of GC-content for the six MNK cell control samples in Calderon et al. (2019). The shape and slope of the curves can be different for different samples, especially sample 1 in comparison with other samples. This is also reflected in the data for other cell types (Figure S1). (B) Differential accessibility log fold changes for a 3 versus 3 mock null comparison, based on normalization and differential accessibility analysis using edgeR, show a bias for peaks with low and high GC-content (in a null setting, LFC should be centered around zero). The blue curve represents a generalized additive model (GAM) fit. (C) Similar to (B), but using DESeq2 for normalization and differential accessibility analysis. (D) Similar to (B), but using full-quantile normalization and edgeR differential accessibility analysis. (E) Lowess-smoothed log2-fold-change effects as a function of GC-content. Each line represents a within- or between-tissue comparison for the data from Liu et al. (2019). The GC-content effects on the log fold changes can be of a similar magnitude for comparisons within a tissue as compared with between tissues. (F) Lowess-smoothed log2-fold-change effects as a function of GC-content for within- and between-brain region comparisons for the data from de la Torre-Ubieta et al. (2018). The GC-content effects on the log fold changes are typically of lower magnitude for comparisons within a brain region as compared with between brain regions.
Figure 2
Figure 2
GC-aware normalization methods cqn, FQ-FQ, and GC-FQ are successful in eliminating GC-content effects on the differential accessibility log-fold-change estimates (A) Accessibility distributions for three replicates from the dataset of Philip et al. (2017). The peaks are grouped into 10 equally sized bins according to their GC-content (rows) and the accessibility distribution (kernel density estimate) is plotted for each bin. The distributional shapes are more comparable across samples for a particular GC-content bin, than they are across GC-content bins for a particular replicate. (B–D) There is no visible GC-content effect on log fold changes estimated using edgeR following normalization with GC-aware methods cqn, FQ-FQ, and GC-FQ, in the mock comparisons for the dataset from Calderon et al. (2019). The blue curve represents a GAM fit.
Figure 3
Figure 3
Benchmark of 12 normalization methods across 8 public ATAC-seq datasets (A) A schematic of the benchmarking framework. The benchmark assesses normalization, differential accessibility performance, and GC-content effect removal, the results of which are each represented as a heatmap. (B) Results of the benchmark. The pseudo-color images display matrices of average ranks (see STAR Methods), with rows corresponding to normalization procedures and columns to datasets and where the darker the color the better the performance. Methods are ordered according to their average rank across all evaluation criteria and the three evaluation categories and datasets, and their names colored based on whether they explicitly account for GC-content (blue) or not (black).
Figure 4
Figure 4
Benchmarking results for each of eight public ATAC-seq datasets Each panel corresponds to the benchmarking results for one of the datasets, as indicated by the first author and publishing year in the top-left corner. Within each panel, normalization methods are ordered from best (top) to worst (bottom) overall performance; method names are colored based on whether they explicitly account for GC-content (blue) or not (black). The benchmark focuses on three main aspects: normalization performance assessment using scone, differential accessibility analysis performance, and the removal of GC-content effects, each represented by a heatmap. The pseudocolors in the heatmaps represent the rank of each normalization method as compared with the other methods for that particular measure; a darker color corresponds to a better rank. All measures and normalization procedures are described in STAR Methods. Note that not all normalization performance measures could be assessed in all datasets, since we did not have batch or QC information for some datasets.
Figure 5
Figure 5
Analysis of the Brain Open Chromatin Atlas dataset (A) PCA plot of the dataset after smooth GC-FQ normalization. The plotting symbols denote cell type, neuronal (N) and glial (G); the colors represent the six broad brain regions. (B) The samples were clustered using PAM based on a variable number of PCs (x axis), after normalization with each of nine methods. The y axis corresponds to the adjusted Rand index comparing the PAM clusters with the true partitioning according to brain region and cell type (12 clusters in total). Different normalizations are represented by different colors and GC-aware normalization methods are represented with triangles. GC-aware methods generally perform better, on average. (C) Mean-difference plots (MD-plots) for differential accessibility analysis comparing neuronal versus non-neuronal cells. The peaks are grouped into hexagons, where the color of each hexagon denotes the average GC-content of its corresponding peaks. There is substantial GC-content bias for GC-unaware normalization methods edgeR and FQ, and similarly for all other GC-unaware methods (Figure S18), where low GC-content is associated with high log fold changes and vice versa. The log-fold-change distribution for cqn is skewed toward positive values, also see Figure S19. These issues are alleviated for GC-aware normalization smooth GC-FQ.
Figure 6
Figure 6
GC-content effects are sample specific and confound differential accessibility analysis, also after GC-aware peak calling Peaks were called using gcapc, the GC-aware peak caller from Teng and Irizarry (2017). (A) Fitted lowess curves of log-count as a function of GC-content for the six MNK cell control samples in Calderon et al. (2019). The shape and slope of the curves can be different for different samples, especially sample 1 in comparison with other samples, as was also observed in Figure 1. (B) Differential accessibility log fold changes for the same 3 versus 3 mock null comparison as in Figure 1, based on normalization and differential accessibility analysis using edgeR, show a bias for peaks with moderate GC-content (in a null setting, log fold changes should be centered around zero). The blue curve represents a generalized additive model (GAM) fit. (C) Similar to (B), but using DESeq2 for normalization and differential accessibility analysis. (D) Similar to (B), but using full-quantile normalization and edgeR differential accessibility analysis.

References

    1. Aird D., Ross M.G., Chen W.-S., Danielsson M., Fennell T., Russ C., Jaffe D.B., Nusbaum C., Gnirke A. Analyzing and minimizing PCR amplification bias in Illumina sequencing libraries. Genome Biol. 2011;12:R18. https://genomebiology.biomedcentral.com/articles/10.1186/gb-2011-12-2-r18 - DOI - PMC - PubMed
    1. Andersson R., Gebhard C., Miguel-Escalada I., Hoof I., Bornholdt J., Boyd M., Chen Y., Zhao X., Schmidl C., Suzuki T., et al. An atlas of active enhancers across human cell types and tissues. Nature. 2014;507:455–461. https://www.nature.com/articles/nature12787 - PMC - PubMed
    1. Benjamini Y., Hochberg Y. Controlling the false discovery rate: a practical and powerful approach to multiple testing. J. Roy. Stat. Soc. B. 1995;57:289–300. https://www.jstor.org/stable/2346101?seq=1#page_scan_tab_contents
    1. Benjamini Y., Speed T.P. Summarizing and correcting the GC content bias in high-throughput sequencing. Nucleic Acids Res. 2012;40:e72. https://academic.oup.com/nar/article/40/10/e72/2411059 - PMC - PubMed
    1. Bolstad B.M., Irizarry R.A., Astrand M., Speed T.P. A comparison of normalization methods for high density oligonucleotide array data based on variance and bias. Bioinformatics. 2003;19:185–193. http://www.ncbi.nlm.nih.gov/pubmed/12538238 - PubMed

Publication types

MeSH terms