. 2022 Nov 21;2(11):100338.
doi: 10.1016/j.crmeth.2022.100338.

Grabody B, an IGF1 receptor-based shuttle, mediates efficient delivery of biologics across the blood-brain barrier

Affiliations

Grabody B, an IGF1 receptor-based shuttle, mediates efficient delivery of biologics across the blood-brain barrier

Jung-Won Shin et al. Cell Rep Methods. .

Abstract

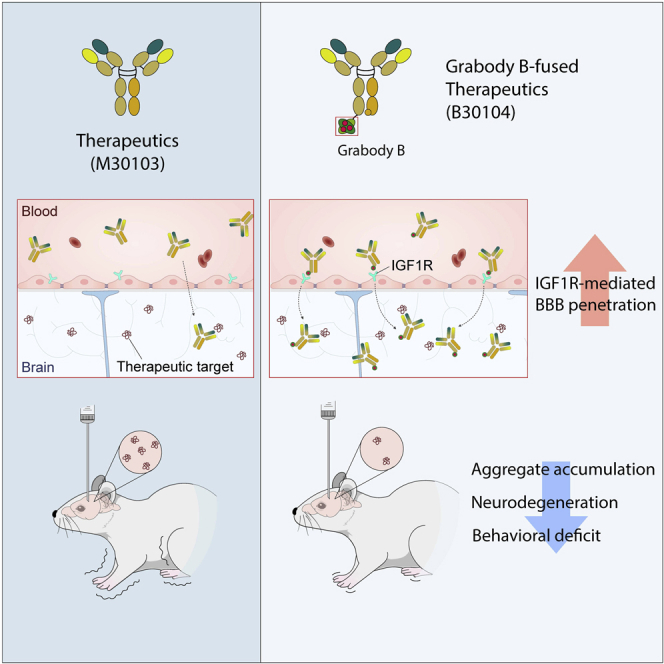
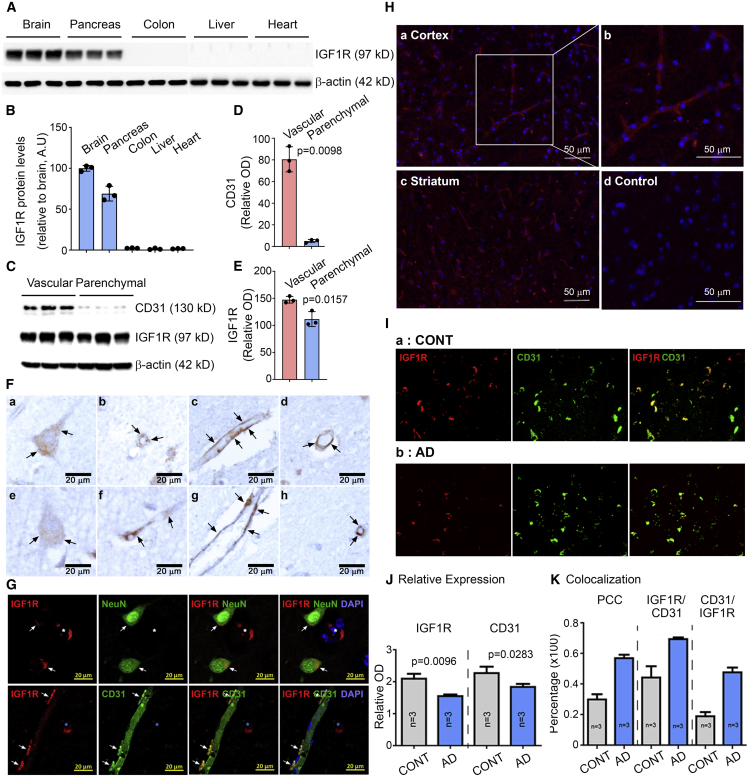
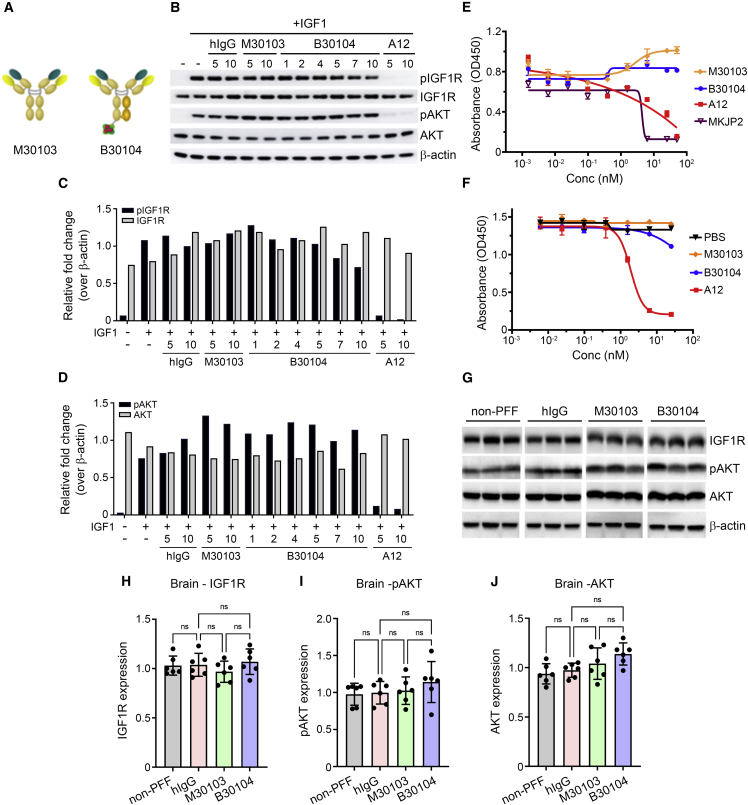
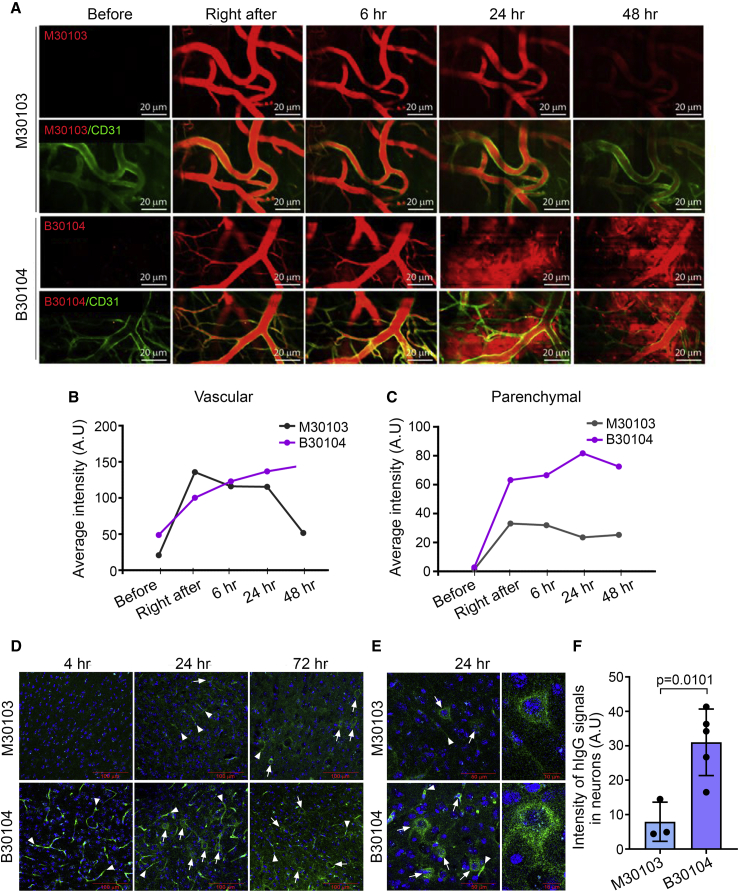
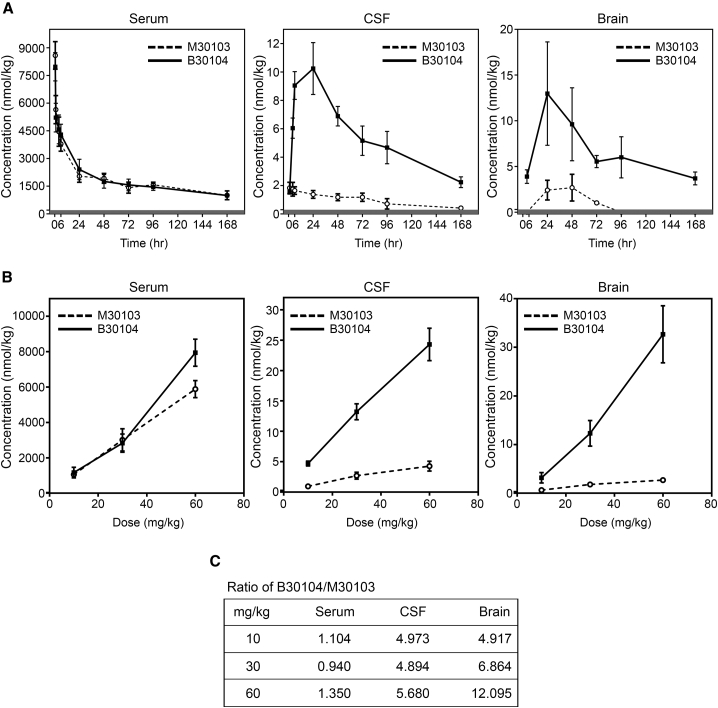
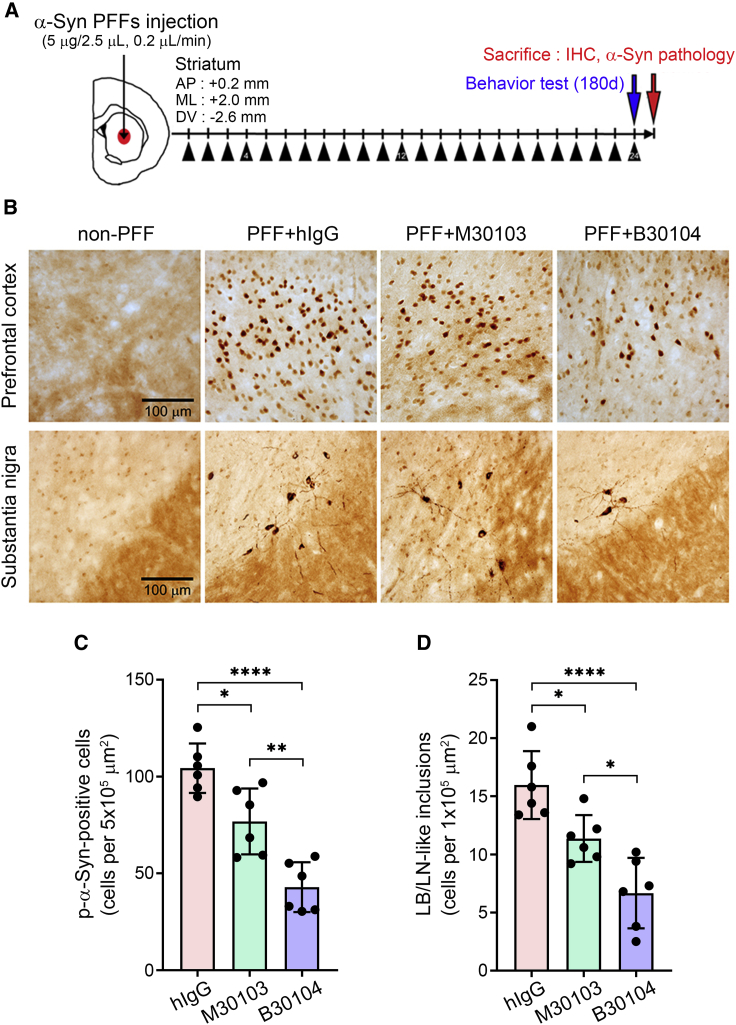
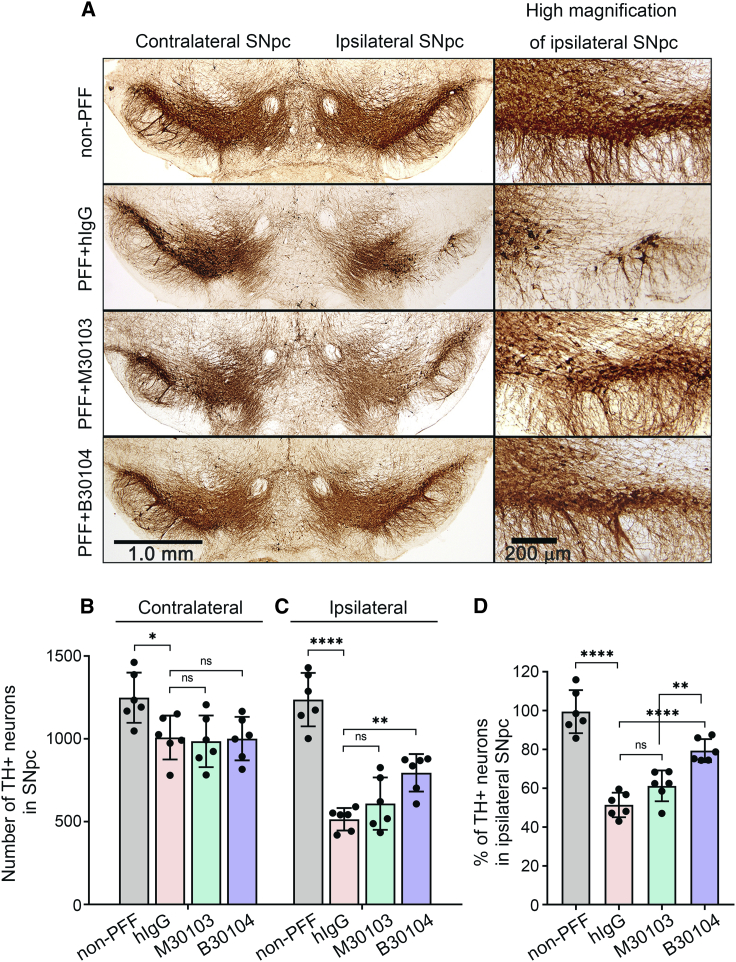
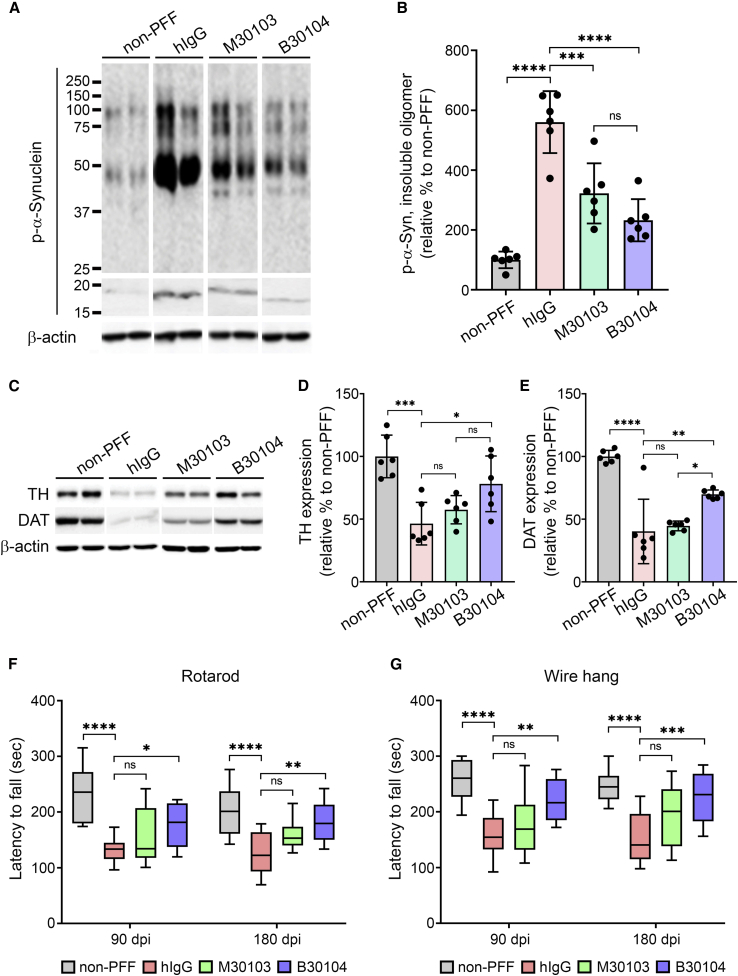
Effective delivery of therapeutics to the brain is challenging. Molecular shuttles use receptors expressed on brain endothelial cells to deliver therapeutics. Antibodies targeting transferrin receptor (TfR) have been widely developed as molecular shuttles. However, the TfR-based approach raises concerns about safety and developmental burden. Here, we report insulin-like growth factor 1 receptor (IGF1R) as an ideal target for the molecular shuttle. We also describe Grabody B, an antibody against IGF1R, as a molecular shuttle. Grabody B has broad cross-species reactivity and does not interfere with IGF1R-mediated signaling. We demonstrate that administration of Grabody B-fused anti-alpha-synuclein (α-Syn) antibody induces better improvement in neuropathology and behavior in a Parkinson's disease animal model than the therapeutic antibody alone due to its superior serum pharmacokinetics and enhanced brain exposure. The results indicate that IGF1R is an ideal shuttle target and Grabody B is a safe and efficient molecular shuttle.

Keywords: Grabody B; Parkinson’s disease; alpha-synuclein; blood-brain barrier; brain endothelial cells; insulin-like growth factor 1 receptor; molecular shuttle; neurodegenerative diseases; pre-formed fibrils; transferrin receptor.


Conflict of interest statement

Authors affiliated with ABL Bio are employees with stakes in the company. The work by J.-W.S., A.S.H., and D.B.S., and the work by S.M. and J.L. described in the manuscript, was funded by ABL Bio.

Figures

None
Graphical abstract
Figure 1
Figure 1
IGF1R is enriched in the brain and the brain vasculature (A) Representative western blots illustrating the differences in the band intensities of IGF1R in each organ (n = 3). Note the low expression of IGF1R in the colon, liver, and heart below the detection limit. β-Actin was used as a loading control. (B) Percentage intensity of IGF1R-immunoreactive bands normalized to the band intensity of the β-actin. n = 3 mice. (C) IGF1R protein expression in the brain vascular or parenchymal fractions from mice. The bands are immuno-reactive to CD31, IGF1R, and β-actin in the vascular and parenchymal fractions (n = 3). (D) Quantification of the intensity of CD31-immunoreactive bands in (C). (E) Quantification of the intensity of IGF1R-immunoreactive bands in (C). The intensity of CD31- and IGFR-positive bands was normalized to β-actin (D and E). (F) Representative images of human temporal lobes immuno-stained with anti-IGF1R antibody. Brain sections from three subjects showed clear expression of IGF1R in brain cells (a, e) and capillaries. BECs (b–d, f–h) are shown in brown with arrows. (G) Representative images of human temporal lobes fluorescently labeled with anti-IGF1R (red) and NeuN (green, top, a marker for mature neurons) or anti-IGF1R (red) and anti-CD31 antibodies (green, bottom). Colocalization of IGF1R and NeuN or CD31 immunoreactivity is indicated with white arrows. The blue asterisk indicates brain microvessels (top) or brain cells (bottom). (H) Immunofluorescent detection of IGF1R in mouse brain: (a) IGF1R expression (red) in the cortex, (b) enlarged image of (a, white box) to show the presence of IGF1R in brain capillary endothelial cells, (c) IGF1R expression (red) in the striatum, (d) negative control tissue incubated with secondary antibody only. Nuclei (blue) were stained with DAPI. Scale bar, 50 μm. (I) Representative immunofluorescent images of the human mid-frontal cortex in gray matter with AD (a) and without neurodegeneration (b) stained with anti-IGF1R and anti-CD31 antibody. n = 3 subjects per group. (J) Quantification of the relative intensity of IGF1R (red) and CD31 (green) in control and AD brains. The relative intensity was obtained from each image and averaged together within the same group. Note that the IGF1R signal (red) highly coincides with CD31 signal (green) in AD compared with control brains (CONT). (K) Pearson’s colocalization coefficient (PCC; left bars) analysis confirmed significantly higher colocalization of CD31 and IGF1R in AD compared with CONT. Data are presented as mean ± SEM.
Figure 2
Figure 2
Grabody B does not interfere with the biological actions of IGF1R (A) Schematic representation of M30103 and B30104. B30104 was constructed as a monovalent, bispecific antibody with an anti-α-Syn antibody (M30103) and Grabody B in an scFv format. (B) Western blot of key IGF1R-signaling components after co-treatment of MCF7 cells with IGF1 and four different antibodies. Note the clear induction of the phosphorylation of Akt and IGF1R in the presence of IGF1 and the reduction by A12, a neutralizing anti-IGF1R antibody. In contrast, little if any alteration by M30103 or B30104 was observed. (C and D) Relative fold intensity of pIGF1R-, IGF1R-, pAKT- and AKT-immunoreactive bands in (B). The bands were normalized to the band intensity of the β-actin. n = 3 mice. (E) IGF1-induced MCF7 proliferation with varying concentration of four antibodies. M30103 and B30104 had a minimal effect, whereas two neutralizing anti-IGF1R antibodies (A12, red and MKJP2, magenta) inhibited cell growth. n = 3 cases. Data are presented as the mean ± SD. (F) Competitive ELISA of the IGF1R-IGF1 interaction in the presence of three different antibodies or PBS control. Clear competition of A12 (red) with IGF1 was confirmed. n = 3 cases. (G) Immunoblot of IGF1R-related signaling components from mouse brains that were chronically treated with weekly doses of hIgG or M30103 at 30 mg/kg or B30104 at 37.1 mg/kg (molar equivalent of M30103 dose) 24 times. All mice except the non-PFF control were injected with PFF. (H–J) Quantification of the band intensity in (G). n = 6 mice. Data are presented as mean ± SD; ns, not significant.
Figure 3
Figure 3
B30104 penetrates the brain parenchyma from brain microvessels (A) Intravital imaging of cortical vessels after dosing male mThy-1-α-syn mice (7 months old, line 61) with fluorescently labeled M30103 or a B30104 (red) and co-injecting Alexa Fluor 555-labeled anti-CD31 antibody (green). Top, M30103; second row, merge with M30103 and anti-CD31 antibody; third row, B30104; bottom, merge with B30104 and anti-CD31 antibody. Note the sustained penetration of B30104 into the brain parenchyma from 24 h to the end of imaging (48 h), in contrast to the confinement of M30103 inside the brain microvessels during the entire imaging session. Scale bar, 20 μm. (B and C) Quantification of the vascular and parenchymal signal intensity of M30103 or B30104. (D) Immunostaining of brain sections from female mThy-1-α-syn mice (4 months old, line 61) after a single intraperitoneal injection of M30103 at 60 mg/kg or the same molar concentration of B30104. Note B30104’s higher intensity from 4 h post injection (arrowhead, brain microvessels) to 24 and 72 h (arrowhead, brain vessels; arrows, brain cells) compared with M30103. Scale bar, 100 μm. (E) Enlarged 24-h images of M30103- or B30104-treated brain sections (arrows, brain cells; arrowheads, brain microvessels) Scale bars, 50 or 10 μm. (F) Quantification of the intracellular hIgG intensity in (E) with 4-fold higher hIgG intensity in the B30104 group than the M30103 group. The data are presented as mean ± SD; three cells for M30103 and five cells for B30104.
Figure 4
Figure 4
B30104 has sustained serum and higher sustained CNS PK profiles compared with M30103 with a wide range of BBB penetration (A) PK curves of M30103 (open circles, dashed line) and B30104 (filled squares, solid line) in serum (left), CSF (middle), and brain (right) over a 1-week period following a single 204 nmol/kg dose injected intravenously (equivalent to 30 mg/kg antibody). Data are presented as mean ± SD; six animals per time point, except three animals at 168 h. (B) Dose-dependent curves of M30103 (open circles, dashed line) and B30104 (filled squares, solid line) in serum (left), CSF (middle), and brain (right) 24 h following a single intravenous injection of the indicated dose (10, 30, 60 mg/kg or approximately 20.4, 60, 121.8 nM antibody respectively). Note B30104’s linear increase in both CSF and brain, indicative of the wide range of its CNS exposure. Data are presented as mean ± SD; three animals per dose. (C) Fold ratio of B30104’s serum, CSF, and brain levels relative to M30103 at each dose.
Figure 5
Figure 5
B30104 reduces pathological α-Syn burden more effectively than M30103 (A) Schematic of the PFF-injection efficacy test (modified from Tran et al., 2014). One week following the stereotaxic injection, the animals received 15 mg/kg of hIgG or M30103 or 17.55 mg/kg of B30104 (black triangle). The behavior of the animals was analyzed after 180 days with 24 doses and sacrificed to assess the neuropathology. (B) Representative images of brain sections stained with anti-p-α-Syn antibody. Note the increased p-α-Syn burden 180 dpi in both the prefrontal cortex (globular or cellular type signal) and substantia nigra (cellular and fibrotic signal) of the hIgG-treated mice in contrast to the reduced p-α-Syn immunoreactivity of the M30103- or B30104-treated brains. B30104 induced further reduction of the p-α-Syn signal in both brain areas compared with M30103. Very little signal was observed in the non-PFF-injected cases. Scale bar, 100 μm. (C and D) Quantification of the p-α-Syn-immunoreactivity in (B) as the diffused signal filling an entire cell (C, quantified as p-α-Syn-positive cells) and the number of more dense intracellular inclusions similar to Lewy bodies (LB, dense cellular inclusions filled with filamentous α-Syn aggregates found in PD brains) and Lewy neurites (LN, neurites containing filamentous similar to LB found in PD brains) (D, quantified as LB/LN-like inclusions). n = 6 mice. One-way ANOVA with Tukey’s post hoc; ∗p < 0.05, ∗∗p < 0.01, ∗∗∗∗p < 0.0001. Data are presented as mean ± SD; n = 6.
Figure 6
Figure 6
B30104 protects the dopaminergic system from degeneration more effectively than M30103 (A) Representative images of TH-positive dopaminergic (DA) neurons and their tracts in the ventral midbrain, including the SNpc, in PFF-injected mice at 180 dpi. High-magnification images clearly show DA neurons (round) and their tracts in the SNpc (right). PFF propagation during the 180 days induced a marked loss of DA neurons and tracts in the hIgG group’s ipsilateral side. In contrast, B30104 saved the cells with tracts. Much lower efficacy of M30103 was also observed. (B and C) Quantification of the TH-positive neurons in (A). Note the significantly higher TH-positive immunoreactivity of the B30104-treated brain than the hIgG-treated brain. M30103-treated brains had only a mild tendency for protection. No significant degeneration was observed in the contralateral side without the PFF injection and the group without PFF injection. Two-way and one-way ANOVA with Tukey’s post hoc; ∗∗p < 0.01, ∗∗∗∗p < 0.0001; ns, not significant. Data are presented as mean ± SD. (D) Relative ratio of the remaining TH-positive neurons in the SNpc. Note that ∼50% of TH-positive neurons were lost by 180 dpi, and 30% of the neurons were protected by the B30104 treatment, resulting in 80% of the TH-positive neurons being present 180 dpi. Two-way and one-way ANOVA with Tukey’s post hoc; ∗∗p < 0.01, ∗∗∗∗p < 0.0001; ns, not significant. Data are presented as mean ± SD; n = 6.
Figure 7
Figure 7
B30104 effectively rescues behavioral deficits by reducing pathological α-Syn and dopamine-related degeneration in the PFF-injected mouse model (A and B) (A) P-α-Syn bands in insoluble fractions from PFF-injected mouse brains and (B) quantification of oligomeric p-α-Syn band intensity (i.e., band size larger than monomeric α-syn). Note the strong p-α-Syn oligomeric bands (three bands at approximately 100, 75, and 50 kDa) in the hIgG groups and significantly weaker immunoblot bands of the B30104-treated group. Ordinary one-way ANOVA with Tukey’s multiple comparisons; ∗∗∗p < 0.001, ∗∗∗∗p < 0.0001; ns, not significant. Data are presented as mean ± SD; n = 6. (C–E) (C) TH- and DAT-immunoreactive bands in insoluble fractions from PFF-injected mouse brains and (D and E) quantification. Ordinary one-way ANOVA with Tukey’s multiple comparisons; ∗p < 0.05, ∗∗∗p < 0.001, ∗∗∗∗p < 0.0001; ns, not significant. Data are presented as mean ± SD; n = 6. (F and G) Assessment of movement (balance and motor coordination) deficits measured by (F) the rotarod test and (G) wire hang test at 90 and 180 dpi. Note that only B30104 significantly improved the behavior of the animals compared with both hIgG and M30103 in both analyses. Two-way ANOVA with Bonferroni’s post hoc test; ∗p < 0.05, ∗∗p < 0.01, ∗∗∗p < 0.001, ∗∗∗∗p < 0.0001; ns, not significant. Data are presented as mean ± SD; n = 12.

References

    1. Bellettato C.M., Scarpa M. Possible strategies to cross the blood-brain barrier. Ital. J. Pediatr. 2018;44:131. - PMC - PubMed
    1. Bien-Ly N., Yu Y.J., Bumbaca D., Elstrott J., Boswell C.A., Zhang Y., Luk W., Lu Y., Dennis M.S., Weimer R.M., et al. Transferrin receptor (TfR) trafficking determines brain uptake of TfR antibody affinity variants. J. Exp. Med. 2014;211:233–244. - PMC - PubMed
    1. Bittar A., Bhatt N., Kayed R. Advances and considerations in AD tau-targeted immunotherapy. Neurobiol. Dis. 2020;134:104707. - PMC - PubMed
    1. Boado R.J., Zhang Y., Zhang Y., Pardridge W.M. Humanization of anti-human insulin receptor antibody for drug targeting across the human blood–brain barrier. Biotechnol. Bioeng. 2007;96:381–391. - PubMed
    1. Castellanos D.M., Sun J., Yang J., Ou W., Zambon A.C., Pardridge W.M., Sumbria R.K. Acute and chronic dosing of a high-affinity rat/mouse chimeric transferrin receptor antibody in mice. Pharmaceutics. 2020;12:E852. - PMC - PubMed

Publication types