. 2022 Nov 14;2(11):100336.
doi: 10.1016/j.crmeth.2022.100336. eCollection 2022 Nov 21.

Optogenetic induction of hibernation-like state with modified human Opsin4 in mice

Affiliations

Optogenetic induction of hibernation-like state with modified human Opsin4 in mice

Tohru M Takahashi et al. Cell Rep Methods. .

Abstract

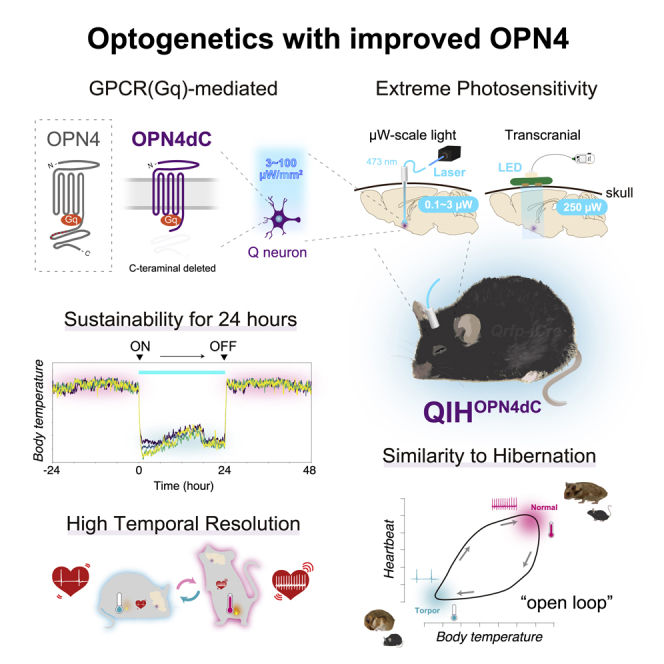
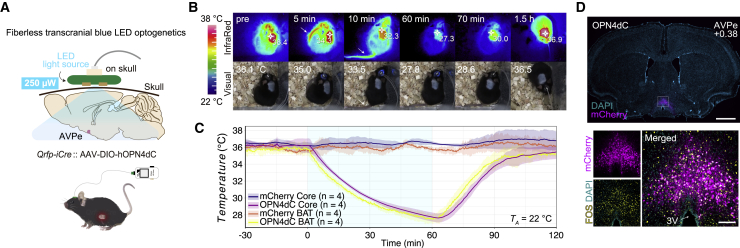
We recently determined that the excitatory manipulation of Qrfp-expressing neurons in the preoptic area of the hypothalamus (quiescence-inducing neurons [Q neurons]) induced a hibernation-like hypothermic/hypometabolic state (QIH) in mice. To control the QIH with a higher time resolution, we develop an optogenetic method using modified human opsin4 (OPN4; also known as melanopsin), a G protein-coupled-receptor-type blue-light photoreceptor. C-terminally truncated OPN4 (OPN4dC) stably and reproducibly induces QIH for at least 24 h by illumination with low-power light (3 μW, 473 nm laser) with high temporal resolution. The high sensitivity of OPN4dC allows us to transcranially stimulate Q neurons with blue-light-emitting diodes and non-invasively induce the QIH. OPN4dC-mediated QIH recapitulates the kinetics of the physiological changes observed in natural hibernation, revealing that Q neurons concurrently contribute to thermoregulation and cardiovascular function. This optogenetic method may facilitate identification of the neural mechanisms underlying long-term dormancy states such as sleep, daily torpor, and hibernation.

Keywords: GPCR; OPN4; QRFP; body temperature; fiber-less optogenetics; hibernation; melanopsin; neuroscience; optogenetics; torpor.


Conflict of interest statement

All authors declare they have no competing interests.

Figures

None
Graphical abstract
Figure 1
Figure 1
OPN4-mediated optogenetics for long-term neuronal excitation in vivo (A) Schematic diagram showing Q neurons specific manipulation by using Cre-activatable (double-floxed inverted open reading frame [DIO]) AAV. AAV carrying hOPN4-, hOPN4dC-, hOPN4(9A)- or hOPN4(9A)dC-mCherry, respectively, was bilaterally injected into the AVPe in Qrfp-iCre mice. Q-mCherry mice expressing mCherry in Q neurons were used for the control group. Optic fibers were unilaterally implanted above the AVPe. The images representing each OPN4 structure were modified from a figure in a previous report. AVPe, anteroventral periventricular nucleus. (B) Top, representative images of coronal brain sections (AP + 0.38 mm from bregma) showing expression of OPN4dC-mCherry (magenta) and c-Fos (yellow) 90 min after light stimulation of OPN4dC-expressing Q neurons and insertion tract of an optic fiber. 3V, third ventricle; opt, optic tract. Scale bars, 200 μm. Bottom, percentages of c-Fos-positive neurons to total mCherry-positive neurons and total numbers of mCherry-positive neuron. Data are shown as means with individual plots (n = 3 mice). (C) The effect of blue-light exposure (473 nm, 3 μW at the fiber tip, 100 μW mm−2, 6 h) to the OPN4s on mice body temperature (n = 4–6 mice/group). Start time of light exposure was set to time 0. TBAT and abdominal core body temperature (TB) were monitored simultaneously using the thermographic camera and telemetric system. Ambient temperature (TA) was set at 22°C using temperature-controlled thermostatic chamber. (D) Left, representative traces of TBAT and TB during QIHOPN4dC. The arrowheads indicate time points corresponding to images shown in right. Right, representative images of QIHOPN4dC mice expressing OPN4dC-mCherry obtained via thermographic and visual cameras. The figures indicate TBAT (top) and TB (bottom) at each time point. The arrow heads indicate tail and heat dissipation 2 min after start of laser stimulation. QIH was induced by blue light (3 μW) from time 0. See also Video S1. (E) Comparison of effects of QIHOPN4dC on TBAT in females (n = 5 mice) and males. Male data are same as those presented in (B). Left, entire TBAT trace. Right, average values of TBAT of Q-OPN4dC group (pre, −0.5–0 h; post, 6.5–7 h, QIH, 1–6 h). The lines and shading in the graphs in (C) and (E) denote the mean and SD of each group, respectively. See also Figures S1–S3.
Figure 2
Figure 2
Optimization of OPN4dC light stimulation (A) Schema depicting the position of the AAV10-EF1α-DIO-hOPN4dC-mCherry injection site and optic fiber relative to the targeted neural population (Q neurons, magenta) in the AVPe of Qrfp-iCre mice. (B) TBAT fluctuations in a series of light stimulation of OPN4dC at various intensities (473 nm, 0.1, 1, 3, and 10 μW at the fiber tip, 1 h). Photostimulation was sequentially repeated at an interval of 1 h (n = 5 mice). (C) Average traces of TBAT for light intensity verification using weaker light (0.1, 1, and 10 μW, 6 h) and stronger light (100 μW, 6 h). The same mice were used for the four groups (n = 5 mice, same animals used in B). (D) Wavelength dependency in OPN4dC-induced TBAT changes in Q-OPN4dC mice with optical stimulation (n = 4 mice). The colored lines indicate the period of optical stimulation. The power of light for stimulation was 10 μW in all conditions (473, 532, 589, and 632 nm). (E) Frequency dependency in OPN4dC-induced TBAT changes in Q-OPN4dC mice with 10 μW optical stimulation (n = 4/group from four mice). For pulse-stimulation group, 10-ms-width light pulse in the indicated frequency was used. NS, no stimulation; continuous, continuous stimulation. (F) Violin plots of TBAT at 0.5–1 and 5–6 h from the beginning of laser stimulation. (G) Schematic diagram of the investigated neural circuit. Q neurons in the AVPe were unilaterally transduced with AAV-DIO-OPN4dC, and optic cannulas were unilaterally implanted at the DMH. Axons of Q neurons at the DMH were manipulated by blue light (3 μW, 6 h). Representative tissue images show the expressions of OPN4dC-mCherry (magenta), c-Fos (yellow), and nuclei stained with DAPI (cyan) in the AVPe and the DMH. Scale bars, 100 μm. DMH, dorsomedial hypothalamus. (H) Changes in TBAT of Q-OPN4dC mice after photoactivation of axons of Q neurons at the DMH (n = 4 mice/group). Lines and shading in (B)–(E) and (H) denote mean and SD of each group, respectively. See also Figure S4.
Figure 3
Figure 3
OPN4dC optogenetics permits 24 h behavioral change with reproducibility (A) 24 h QIH induction using ChR2(H134R) and SSFO. ChR2 and SSFO virally expressed in the AVPe were stimulated by blue light (ChR2; 10 mW, 2 Hz, 10 ms width, 24 h, SSFO; 10 mW, 1 s width, every 30 min for 24 h) (n = 5 mice/group). (B) Comparison of QIHOPN4dC with QIHM3Dq (n = 4 mice/group). TB was measured by a telemetry transmitter, which was implanted interperitoneally. QIHOPN4dC was induced by continuous light (3 μW, 24 h). In QIHM3Dq, mice expressing hM3Dq in the AVPe were injected by CNO intraperitoneally (1 mg/kg). Locomotor activity (Act) of Q-OPN4dC was plotted in the bottom panel. AU, arbitrary unit. (C) Schema of experimental procedure of repeated 24 h QIHOPN4dC (n = 4 mice). 24 h stimulation was repeated four times at 2 day intervals. The yellow and gray backgrounds indicate 12 h periods of light and darkness, respectively. Laser illumination was initiated at ZT6 (2 p.m.). (D) Representative thermographic images of a Q-OPN4dC mouse. (E) TBAT were recorded in the repeated 24 h QIHOPN4dC from four independent mice. QIH induced by continuous stimulation (3 μW, 24 h) of OPN4dC was repeated four times at 2 day intervals. (F) Magnified view of (E) plotting TBAT in the induction and recovery period corresponding to each mouse. The cyan-shaded region marks the light delivery period. Red line shows 30 min after stimulation offset. The lines and shading in (A) and (B) denote the mean and SD of each group, respectively. See also Figure S5.
Figure 4
Figure 4
Transcranial manipulation of Q neurons (A) Fiberless transcranial blue LED stimulation in Q-OPN4dC mice. The LED source was attached on the mouse skull. The light intensity was set at 250 μW. (B) Infrared and visual imaging of a Q-OPN4dC mouse showing QIH. LED light was given transcranially to Q neurons expressing OPN4dC (250 μW, 1 h). The arrows in the 5 and 10 min figures indicate the vasodilation at the mouse tail. (C) Changes in TBAT and TB during the LED light exposure (250 μW, 1 h) in Q-OPN4dC mice and Q-mCherry control mice (n = 4 mice/group). (D) Representative tissue images showing the expressions of OPN4dC-mCherry (magenta) and c-Fos (yellow) as well as nuclei stained with DAPI (cyan) in the AVPe 60 min after the initiation of blue LED illumination (250 μW). Scale bars, 1 mm (top) and 100 μm (bottom). The lines and shading in (C) denote the means and SD, respectively. See also Video S2.
Figure 5
Figure 5
QIHOPN4 induces physiological changes similar to natural hibernation (A) Top, dynamics of HR, TB, and TBAT during QIHOPN4dC (n = 1). OPN4dC expressed in Q neurons was activated using a 473 nm laser (3 μW, 6 h). The initiation of light exposure was denoted as time 0. Inset represents a magnified view at the end of the light illumination, wherein the time range is indicated by a gray bar. Bottom, short-term stimulation (3 μW, 1 h) of OPN4dC with a good reproducibility in the effect on TB, TBAT, and HR. One h QIH was induced repeatedly every 2 h (n = 1). The HR and TB were measured constantly via a telemetry system. (B) Electrocardiogram trace and HR from each condition, normal/pre-QIH (top), QIH (middle), and QIH mice during recovery phase (bottom). Electrocardiogram tracings for 10 and 1 s. (C) Comparison of TB and HR between QIHOPN4dC and isoflurane anesthesia. Q-mCherry mice were used as the controls (n = 4 mice/group). (D) Violin plots of HR (2.5–3.5 h after the QIH induction) when TB values were approximately at the same level in the two conditions and of TB (5–6 h after the QIH induction) when HR values were at approximately the same level in the two conditions. (E) Pattern diagram of scatterplots for TB and HR of a Syrian hamster during hibernation (modified from a previous report22) typically forms an open loop. (F) The relationship of TB and HR in several kinds of hypothermic state in mice. In QIHOPN4dC, Q neurons expressing OPN4dC were stimulated by blue light (3 μW, 6 h). In normal condition, Q neurons expressing mCherry were stimulated by the same condition as QIHOPN4dC. In QIHM3Dq, Q neurons expressing hM3Dq were excited by CNO intraperitoneal administration (0.1 mg/kg). In anesthesia, the same mice that were used in QIHOPN4dC, and normal conditions were exposed to 1% isoflurane for 6 h without photostimulation. The start time of light exposure, CNO intraperitoneal administration, and isoflurane inhalation were set to time 0. HR for each condition is plotted as a function of the concurrent TB. The plots are presented by each color for 1 h before the stimulus onset, for 6 h of stimulation, and for 2 h of recovery. In QIHM3Dq, extra plots of the time to complete recovery are also presented (orange, 8–24 h), as no clear recovery is observed even 6 h after the initiation of stimulation. The lines and shading in (C) denote the mean and SD of each group, respectively. All p values (∗p < 0.01, ∗∗p < 0.001, ∗∗∗p < 0.0001) are from one-way ANOVA with Tukey’s multiple comparisons test.

Similar articles

Cited by

References

    1. Yizhar O., Fenno L.E., Davidson T.J., Mogri M., Deisseroth K. Optogenetics in neural systems. Neuron. 2011;71:9–34. - PubMed
    1. Deisseroth K. Optogenetics: 10 years of microbial opsins in neuroscience. Nat. Neurosci. 2015;18:1213–1225. 2015 189. - PMC - PubMed
    1. Nagel G., Szellas T., Huhn W., Kateriya S., Adeishvili N., Berthold P., Ollig D., Hegemann P., Bamberg E. Channelrhodopsin-2, a directly light-gated cation-selective membrane channel. Proc. Natl. Acad. Sci. USA. 2003;100:13940–13945. - PMC - PubMed
    1. Boyden E.S., Zhang F., Bamberg E., Nagel G., Deisseroth K. Millisecond-timescale, genetically targeted optical control of neural activity. Nat. Neurosci. 2005;8:1263–1268. 2005 89. - PubMed
    1. Nagel G., Brauner M., Liewald J.F., Adeishvili N., Bamberg E., Gottschalk A. Light activation of Channelrhodopsin-2 in excitable cells of caenorhabditis elegans triggers rapid behavioral responses. Curr. Biol. 2005;15:2279–2284. - PubMed

Publication types