Review
. 2023 Feb;53(3):668-686.
doi: 10.1017/S0033291722003634. Epub 2022 Dec 1.

Dropout from psychological treatment for borderline personality disorder: a multilevel survival meta-analysis

Affiliations
Review

Dropout from psychological treatment for borderline personality disorder: a multilevel survival meta-analysis

Arnoud Arntz et al. Psychol Med. 2023 Feb.

Abstract

Background: Dropout from psychotherapy for borderline personality disorder (BPD) is a notorious problem. We investigated whether treatment, treatment format, treatment setting, substance use exclusion criteria, proportion males, mean age, country, and other variables influenced dropout.

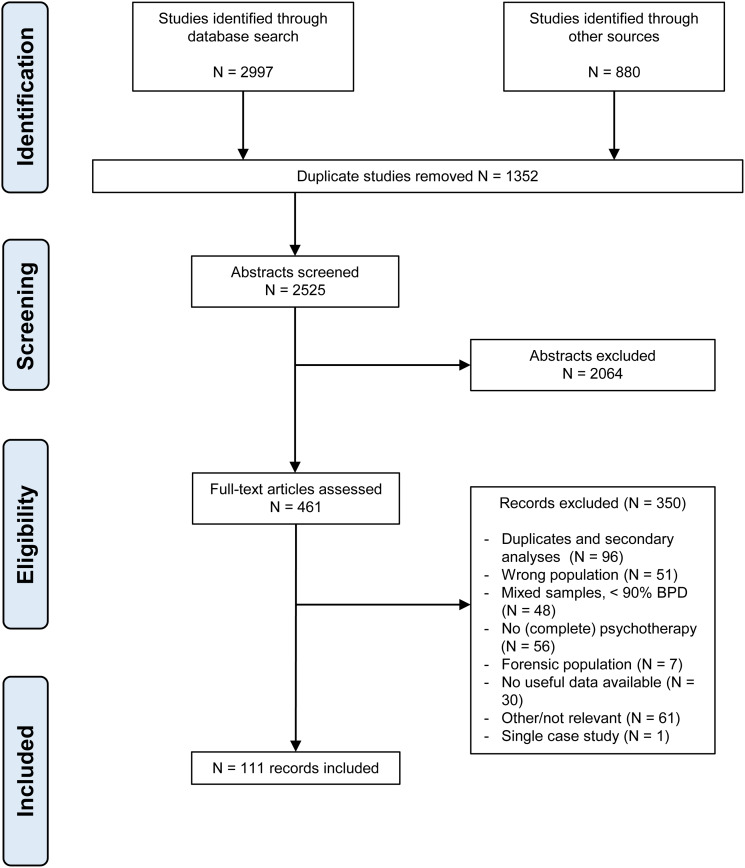
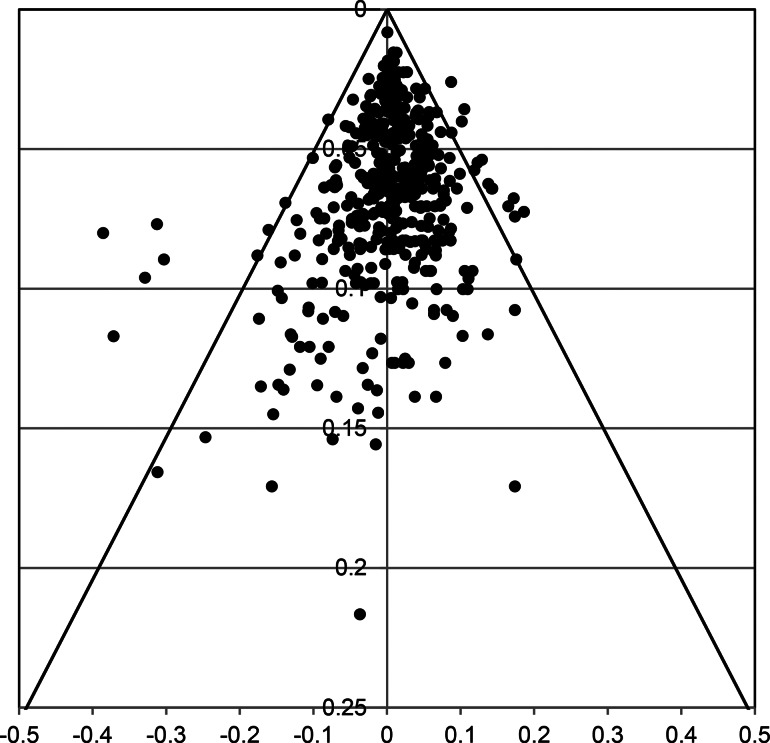
Methods: From Pubmed, Embase, Cochrane, Psycinfo and other sources, 111 studies (159 treatment arms, N = 9100) of psychotherapy for non-forensic adult patients with BPD were included. Dropout per quarter during one year of treatment was analyzed on participant level with multilevel survival analysis, to deal with multiple predictors, nonconstant dropout chance over time, and censored data. Multiple imputation was used to estimate quarter of drop-out if unreported. Sensitivity analyses were done by excluding DBT-arms with deviating push-out rules.

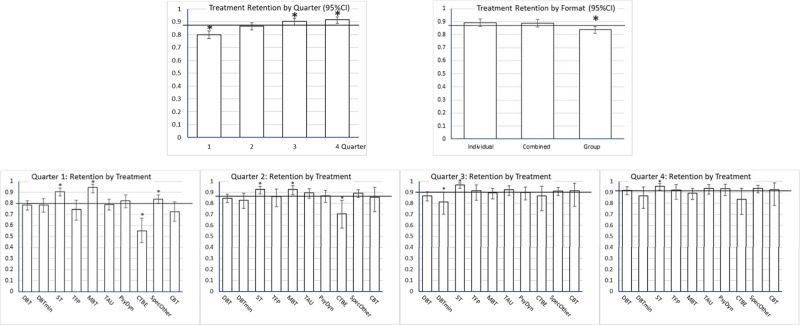
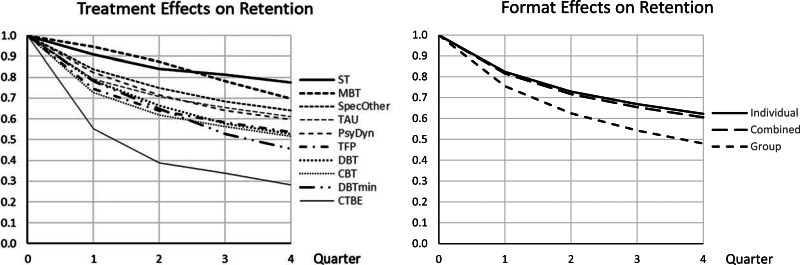
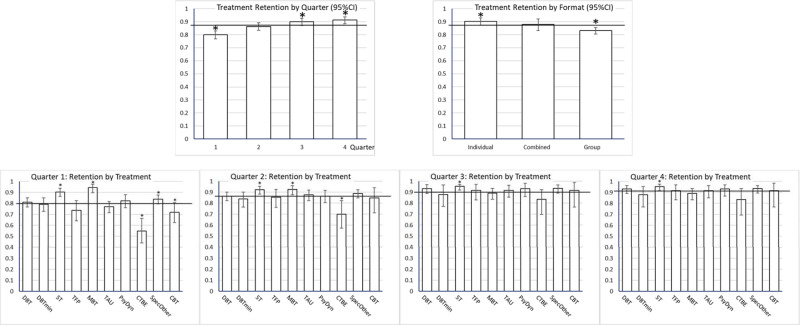
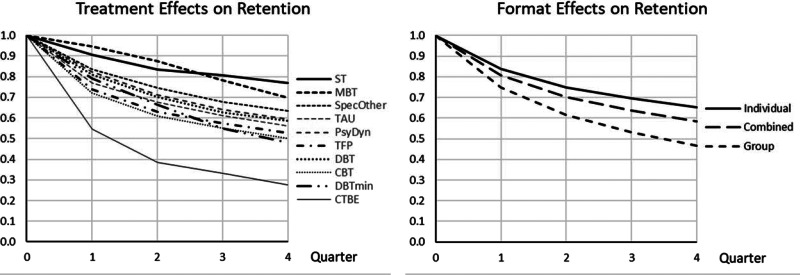
Results: Dropout was highest in the first quarter of treatment. Schema therapy had the lowest dropout overall, and mentalization-based treatment in the first two quarters. Community treatment by experts had the highest dropout. Moreover, individual therapy had lowest dropout, group therapy highest, with combined formats in-between. Other variables such as age or substance-use exclusion criteria were not associated with dropout.

Conclusion: The findings do not support claims that all treatments are equal, and indicate that efforts to reduce dropout should focus on early stages of treatment and on group treatment.

Keywords: Borderline personality disorder; dropout; meta-analysis; psychotherapy; treatment retention.


Figures

Fig. 1.
Fig. 1.
Flowchart of study selection.
Fig. 2.
Fig. 2.
Treatment retention proportion per quarter (with 95%CI) as estimated in the complete dataset. The horizontal line is the average treatment retention, to which the estimated effects are compared (deviation contrasts). Significant effects (p < 0.05) indicated by *. Upper left panel: treatment retention by quarter, showing increasing retention with time. Upper right panel: treatment retention by treatment format, showing significantly less retention in group treatment. Lower panels: treatment retention by treatment types and quarter. In all quarters, ST had significantly higher treatment retention than average. In quarters 1 and 2 MBT had significantly higher retention, CTBE significantly less, than average. Reduced DBT (DBTmin) had significantly less retention in quarter 3.
Fig. 3.
Fig. 3.
Retention curves for 4 quarters for the complete data set. (a) (left). Cumulative treatment retention over 4 quarters depicted with survival curves for the 10 treatment models. Over 1 year CTBE had considerable less treatment retention, while ST and MBT had considerable more. (b) (right). Cumulative treatment retention over 4 quarters depicted with survival curves for the 3 treatment formats. Over 1 year group formats had considerable less treatment retention than the other two.
Fig. 4.
Fig. 4.
Funnel plot of 463 residuals of the final GLMM survival analysis (x-axis = residual; y-axis = study precision per quarter). Residuals were the differences between observed and estimated survival proportions. To the left residuals related to more actual dropouts in a quarter than predicted by the model, to the right residuals related to less actual dropouts than predicted by the model. There were 23 (4.96%) residuals outside the 95% CI.
Fig. 5.
Fig. 5.
Treatment retention proportion per quarter (with 95% CI) as estimated in the reduced dataset, without DBT-arms with deviating pushout rules. The horizontal line is the average treatment retention, to which the estimated effects are compared (deviation contrasts). Significant effects (p < 0.05) indicated by *. Upper left panel: treatment retention by quarter, showing increasing retention with time. Upper right panel: treatment retention by treatment format, illustrating significantly less retention in group and more in individual treatment. Lower panels: treatment retention by treatment types and quarter. In all quarters, ST had significantly higher treatment retention than average. In quarters 1 and 2 MBT had significantly higher retention, CTBE significantly less, than average. In Quarter 1, specified others had significantly more and CBT less retention than average.
Fig. 6.
Fig. 6.
Retention curves for 4 quarters for the reduced data set (sensitivity analysis). (a) (left). Cumulative treatment retention over 4 quarters depicted with survival curves for the 10 treatment models, estimated from the reduced data set, without DBT-arms with deviant pushout rules. Over 1 year CTBE had considerable less treatment retention, while ST and MBT had considerable more. (b) (right). Cumulative treatment retention over 4 quarters depicted with survival curves for the 3 treatment formats, estimated from the reduced data set, without DBT-arms with deviant pushout rules. Over 1 year group formats had considerable less treatment retention, while individual had considerably more treatment retention than average. The combined format was in between.
Fig. 7.
Fig. 7.
Funnel plot of 455 residuals of the final GLMM survival analysis (x-axis = residual; y-axis = study precision per quarter) of the reduced data set. Residuals were the differences between observed and estimated survival proportions. To the left residuals related to more actual dropouts in a quarter than predicted by the model, to the right residuals related to less actual dropouts than predicted by the model. There were 24 (5.3%) residuals outside the 95% CI.

References

    1. Agresti, A., & Coull, B. A. (1998). Approximate is better than “exact” for interval estimation of binomial proportions. The American Statistician, 52(2), 119–126.
    1. American Psychiatric Association (2013). Diagnostic and statistical manual of mental disorders (5th ed.). Washington, DC: Author.
    1. APA Publications and Communications Board Working Group on Journal Article Reporting Standards (2008). Reporting standards for research in psychology: Why do we need them? What might they be? American Psychologist, 63, 839–851. doi:10.1037/0003-066X.63.9.839 - DOI - PMC - PubMed
    1. Arntz, A., Jacob, G. A., Lee, C. W., Brand-de Wilde, O. M., Fassbinder, E., Harper, R. P., … Farrell, J. M. (2022). Effectiveness of predominantly group schema therapy and combined individual and group schema therapy for borderline personality disorder: A randomized clinical trial. JAMA Psychiatry, 79(4), 287–299. doi:10.1001/jamapsychiatry.2022.0010 - DOI - PMC - PubMed
    1. Arntz, A., Stupar-Rutenfrans, S., Bloo, J., van Dyck, R., & Spinhoven, P. (2015). Prediction of treatment discontinuation and recovery from borderline personality disorder: Results from an RCT comparing schema therapy and transference focused psychotherapy. Behaviour Research and Therapy, 74, 60–71. doi:10.1016/j.brat.2015.09.002 - DOI - PubMed