. 2022 Dec 1;132(23):e158096.
doi: 10.1172/JCI158096.

Cyclin G1 induces maladaptive proximal tubule cell dedifferentiation and renal fibrosis through CDK5 activation

Affiliations

Cyclin G1 induces maladaptive proximal tubule cell dedifferentiation and renal fibrosis through CDK5 activation

Kensei Taguchi et al. J Clin Invest. .

Abstract

Acute kidney injury (AKI) occurs in approximately 13% of hospitalized patients and predisposes patients to chronic kidney disease (CKD) through the AKI-to-CKD transition. Studies from our laboratory and others have demonstrated that maladaptive repair of proximal tubule cells (PTCs), including induction of dedifferentiation, G2/M cell cycle arrest, senescence, and profibrotic cytokine secretion, is a key process promoting AKI-to-CKD transition, kidney fibrosis, and CKD progression. The molecular mechanisms governing maladaptive repair and the relative contribution of dedifferentiation, G2/M arrest, and senescence to CKD remain to be resolved. We identified cyclin G1 (CG1) as a factor upregulated in chronically injured and maladaptively repaired PTCs. We demonstrated that global deletion of CG1 inhibits G2/M arrest and fibrosis. Pharmacological induction of G2/M arrest in CG1-knockout mice, however, did not fully reverse the antifibrotic phenotype. Knockout of CG1 did not alter dedifferentiation and proliferation in the adaptive repair response following AKI. Instead, CG1 specifically promoted the prolonged dedifferentiation of kidney tubule epithelial cells observed in CKD. Mechanistically, CG1 promotes dedifferentiation through activation of cyclin-dependent kinase 5 (CDK5). Deletion of CDK5 in kidney tubule cells did not prevent G2/M arrest but did inhibit dedifferentiation and fibrosis. Thus, CG1 and CDK5 represent a unique pathway that regulates maladaptive, but not adaptive, dedifferentiation, suggesting they could be therapeutic targets for CKD.

Keywords: Cell cycle; Chronic kidney disease; Fibrosis; Nephrology.


Figures

Figure 1
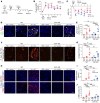
Figure 1. PTC CG1 promotes renal fibrosis in CKD.
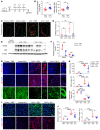
(A) CG1 expression in kidney tissue from patients with and without kidney injury. Scale bar: 20 μm. (B) Quantification of CG1 staining of patients in A. NK, normal kidney. (C) Representative images of RNAScope for Ccng1 and Hnf4a in PTCs of control kidney and CKD models. Scale bars: 20 μm. (D) Quantification of number of Ccng1 RNA dots in Hnf4a+ PTCs. n = 10 in control kidney; n = 25 in CKD models. (E) Quantification of the percentage of CG1+ cells in kidney tubules and all other cell types. (F) Schematic diagrams of experimental CKD models with WT and CG1-KO mice. (G) Plasma BUN at weekly time points after administration of AA (5 mg/kg every other day for a week). (H) Plasma BUN at weekly time points after repeated injection with low-dose cisplatin (5 mg/kg once a week for 4 weeks). (I) Plasma BUN on days 0, 3, and 9 after UUO surgery. (J) Representative images of obstructed kidneys in WT and CG1-KO mice in the UUO model. (K) Ratio of obstructed kidney weight (KW)/body weight. WT UUO (n = 14) and CG1-KO UUO (n = 12). (L) Representative large, scanned images of picrosirius red–stained kidney sections with polarized-light microscopy. Dashed outline indicates region of interest quantified. Scale bars: 500 μm. (M) The quantification of collagen deposition area/kidney (%) from L. Control (n = 5), CKD (n = 8–10). (N) Representative images of stained kidney for α-SMA. Scale bars: 100 μm. (O) Quantitative analysis of α-SMA+ area/cortex (%). Control (n = 5), CKD (n = 8–10). Data are presented as the mean ± SD. *P < 0.05; **P < 0.01; ***P < 0.001; ****P < 0.0001 by unpaired, 2-tailed Student’s t test (B, G, H, I, and K) or 1-way ANOVA with Tukey’s post hoc test (M and O).
Figure 2
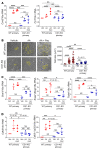
Figure 2. Inducing G2/M arrest in CG1-KO mice does not reverse the protective phenotype.
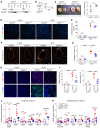
(A) A schematic diagram of injection with AA (5 mg/kg) and paclitaxel (PAC) (20 mg/kg). (B) Plasma BUN level over time and (C) body weight (compared to day 0) in WT (n = 9) and CG1-KO mice (n = 8–10). (D) Representative images of p-H3+Ki-67+ PTCs from kidneys of WT and CG1-KO mice on day 42 following AA administration. Scale bar: 20 μm. (E) Quantification of the number of p-H3+Ki-67+ PTCs in cortex (n/mm2). (F) Representative images of picrosirius red–stained kidney sections from mice treated with PBS (n = 5), AA (n = 8), AA + PAC (n = 8), and (G) the corresponding quantification of collagen deposition area/cortex (%). Scale bars: 500 μm. (H) Representative images of the kidneys stained for SOX9 (upper) and α-SMA (lower). Scale bars: 50 μm. (I and J) The corresponding quantification of the number of SOX9+ PTCs/cortex (n/mm2), and α-SMA+ area/cortex (%) in left panel. PBS (n = 5) and AA + PAC (n = 8–9). Data are presented as the mean ± SD. *P < 0.05; **P < 0.01; ***P < 0.001; ****P < 0.0001 by unpaired, 2-tailed Student’s t test (B and C) or 1-way ANOVA with Tukey’s post hoc test (E, G, I, and J).
Figure 3
Figure 3. Inducing G2/M arrest in vitro does not induce fibrotic or dedifferentiation markers in primary PTCs.
(A) Real-time PCR analysis of Ctgf and Fn1 in WT and CG1-KO primary PTCs treated with PBS, AA, or AA + PAC for 7 days. n = 3 independent experiments. (B) Representative phase-contrast images of WT and CG1-KO primary PTCs treated with PBS, AA, or AA + PAC for 7 days, and the quantification of individual cell size (μm2) of WT and CG1-KO primary PTCs in PBS, AA, and AA + PAC. n = 25 each. A portion of cells are outlined in yellow to demonstrate cell size; all cells/field were quantified. Scale bars: 100 μm. (C) Dedifferentiation marker mRNA expression in WT and CG1-KO primary PTCs treated with PBS, AA, or AA + PAC for 7 days. n = 3 independent experiments. (D) Real-time PCR analysis of Cdk5 and Cdk5r1 (p35) in WT and CG1-KO primary PTCs treated with PBS, AA, or AA + PAC for 7 days. n = 3 independent experiments. AA, 5 μg/mL; PAC, 1 μM. Data are presented as the mean ± SD. *P < 0.05; **P < 0.01; ***P < 0.001; ****P < 0.0001 by 1-way ANOVA with Tukey’s post hoc test.
Figure 4
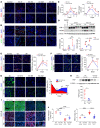
Figure 4. CG1 modulates PTC dedifferentiation and proliferation in CKD.
(A and B) Representative images of SOX9-labeled kidney sections from WT and CG1-KO mice in acute (day 7) and chronic (day 42) phases of AA. Scale bar: 20 μm (C) Corresponding quantification of the number of SOX9+ cells/kidney. Control (n = 5) and injured kidney (n = 3–6). (D) Western blot analysis of KIM-1, SOX9, and β-actin in acute phase of AA, including day 7 and day 14 after administration of AA and the corresponding quantification of SOX9/β-actin and KIM-1/β-actin. (E and F) Representative images of SOX9- and Ki-67–labeled kidney sections from WT and CG1-KO mice on day 3 and day 9 of UUO and corresponding quantification of the number of SOX9+ or Ki-67+ cells/kidney. Control (NK; n = 5) and injured kidney (n = 5–9). Scale bar: 20 μm. (G) Representative images of LTL staining in kidneys on days 0, 14, 28, and 42 following AA and corresponding quantification. Scale bar: 50 μm. (H) Western blotting analysis of YAP in whole-kidney lysates of WT and CG1-KO mice following AA. (I) Representative images of Na+/K+-ATPase– or VIM-stained kidney sections following UUO. Scale bars: 100 μm. HM, high magnification. (J) The corresponding quantification of Na+/K+-ATPase+ or VIM+ area/cortex (%). Control (n = 4–6) and injured kidney (n = 8–9). Scale bar: 100 μm. Data are presented as the mean ± SD. *P < 0.05; **P < 0.01; ***P < 0.001; ****P < 0.0001 by 1-way ANOVA with Tukey’s post hoc test.
Figure 5
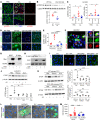
Figure 5. CG1 binds to and activates CDK5 in PTCs.
(A) Representative images of p-CDK5–labeled kidneys from day 42 WT PBS, CG1-KO PBS, WT AA, and CG1-KO AA. Scale bar: 50 μm. (B) Western blot analysis of p-CDK5 in AA-treated WT and CG1-KO kidneys and quantitative analysis in WT AA (n = 5) and CG1-KO AA (n = 5). (C) Real-time PCR analysis of CDK5 and p35 following PBS or AA treatment (PBS, n = 3; AA, n = 8). (D and E) Representative images and quantification of p-CDK5 in WT and CG1-KO primary PTCs treated with PBS or AA (5 μg/mL) for 7 days. Scale bars: 50 μm. n = 5 in each group. HM, high magnification. (F) Representative images of p-CDK5 in hCG1-overexpressing HEK293T cells. Scale bars: 20 μm. (G) Representative Western blots of CG1-Myc and CDK5 in whole-cell extract (WCE) of Myc-CG1–overexpressing HEK293T and immunoprecipitation by Myc. (H) Western blot analysis of E-cadherin, CG1, and total CDK5 in LLC-PK1 cells transfected with human CG1 (hCG1) and/or hCDK5 for 48 hours. (I) Representative images of E-cadherin in AA-treated LLC-PK1 cells transfected with DN-CDK5 or empty vector (EV). Scale bar: 20 μm. (J) Representative Western blot analysis of CTGF in LLC-PK1 cells treated with/without AA (2.5 μg/mL) and PBS, roscovitine, or RO5454291 from Glixx labs (GLX). (K) Western blot analysis of CTGF in WT and CG1-KO primary PTCs treated with AA (5 μg/mL) for 7 days with/without CDK5 inhibitors roscovitine (8 μM) and GLX (50 μM). (L and M) Representative phase-contrast images and quantification of cell size in human CG1–overexpressing (hCCNG1-overexpressing) LLC-PK1 cells with/without roscovitine. Scale bar: 20 μm. n = 25 in each. Data are presented as the mean ± SD. *P < 0.05; **P < 0.01; ***P < 0.001; ****P < 0.0001 by unpaired, 2-tailed Student’s t test (B) or 1-way ANOVA with Tukey’s post hoc test (C, E, J, K, and M).
Figure 6
Figure 6. CG1/CDK5 axis regulates PTC dedifferentiation and fibrosis in CKD rodents.
(A) Schematic diagram of the UUO model with CDK5 inhibitor GLX. (B) Quantitative analysis of obstructed kidney weight (KW)/body weight (mg/g BW) and obstructed/contralateral kidneys (%) following UUO with GLX or vehicle. (C) Large, scanned images of picrosirius red–stained kidneys imaged by polarized-light microscopy from UUO plus GLX or vehicle. Dashed outline indicates region of interest quantified. Scale bars: 500 μm. (D) Quantification of picrosirius red+ area/cortex (%) in C. Contralateral kidney of vehicle, n = 5; contralateral kidney of GLX, n = 5; UUO with vehicle, n = 6; UUO with GLX, n = 6. (E) Western blot analysis of SOX9 and VIM in whole-kidney lysates of UUO and contralateral kidneys with vehicle or GLX, and (F) quantification of SOX9/β-actin and VIM/β-actin. (G) Representative images of dedifferentiation markers (SOX9, Na+/K+-ATPase, and VIM) in kidneys from contralateral or UUO kidneys treated with vehicle or GLX. Scale bars: 25 μm. HM, high magnification. (H) Quantitative analysis of the number of SOX9+ PTCs/cortex (n/mm2), Na+/K+-ATPase+/cortex (%), or VIM+ area/cortex (%) in contralateral or UUO kidney treated with vehicle or GLX. Contralateral kidney of vehicle, n = 5; contralateral kidney of GLX, n = 5; UUO with vehicle, n = 7; UUO with GLX, n = 7–8. (I) Representative images of collagen type IV α1 chain (COL4a1) in contralateral or UUO kidney with vehicle or GLX. Scale bar: 50 μm. (J) The corresponding analysis of COL4a1+ area/cortex (%). Contralateral kidney of vehicle, n = 3; contralateral kidney of GLX, n = 3; UUO with vehicle, n = 6; UUO with GLX, n = 7. Data are presented as the mean ± SD. *P < 0.05; **P < 0.01; ***P < 0.001; ****P < 0.0001 by unpaired, 2-tailed Student’s t test (B) or 1-way ANOVA with Tukey’s post hoc test (D, F, H, and J).
Figure 7
Figure 7. Tubule-specific deletion of CDK5 inhibits dedifferentiation and fibrosis.
(A) Western blot analysis of CDK5 levels in CDK5fl/fl and CDK5ΔTub mice in the kidney and different organs. (B) Schematic representation of the UUO model. (C) Representative images of thick kidney slices from CDK5fl/fl and CDK5ΔTub and quantification of kidney weight (KW)/body weight following UUO. n = 4–5 kidneys. Scale: 1 mm/tick. (D and E) Representative images of p-H3 and Ki-67 staining in CDK5fl/fl and CDK5ΔTub kidneys following UUO and quantification of the staining. Scale bar: 50 μm. (F and G) Representative polarized-light images of picrosirius red–stained CDK5fl/fl and CDK5ΔTub kidneys and quantification of the positive signal. n = 8–9 independent experiments. Dashed outline indicates region of interest quantified. Scale bars: 500 μm. (H and I) Representative immunofluorescence images of α-SMA– and vimentin-stained CDK5fl/fl and CDK5ΔTub kidneys following UUO and quantification of the staining. Scale bars: 20 μm. (J and K) Real-time PCR analysis of profibrotic and dedifferentiation markers in CDK5fl/fl and CDK5ΔTub kidneys. n = 3–6 animals. Data are presented as the mean ± SD. *P < 0.05; **P < 0.01; ***P < 0.001; ****P < 0.0001 by unpaired, 2-tailed Student’s t test (C) or 1-way ANOVA with Tukey’s post hoc test (E, G, and IK).
Figure 8
Figure 8. Model of CG1 regulation of dedifferentiation and CKD.
Following AKI, there is loss of tubule epithelial cells by cell death followed by adaptive dedifferentiation and proliferation of the surviving cells. Once the surviving cells divide to repair the damaged epithelium, they redifferentiate into a normal epithelium. Long-term expression of CG1 induces maladaptive dedifferentiation, in which the epithelial cells undergo G2/M arrest, secretion of profibrotic cytokines, and induction of tubulointerstitial fibrosis. Mechanistically, CG1 expression upregulates and activates CDK5, leading to dedifferentiation. Dedifferentiation precedes the induction of the cell cycle and G2/M arrest.

Comment in

  • Decoupling dedifferentiation and G2-M arrest in kidney fibrosis

References

    1. Wang HE, et al. Acute kidney injury and mortality in hospitalized patients. Am J Nephrol. 2012;35(4):349–355. doi: 10.1159/000337487. - DOI - PMC - PubMed
    1. Bonventre JV. Dedifferentiation and proliferation of surviving epithelial cells in acute renal failure. J Am Soc Nephrol. 2003;14(suppl 1):S55–S61. doi: 10.1097/01.ASN.0000067652.51441.21. - DOI - PubMed
    1. Ferenbach DA, Bonventre JV. Mechanisms of maladaptive repair after AKI leading to accelerated kidney ageing and CKD. Nat Rev Nephrol. 2015;11(5):264–276. doi: 10.1038/nrneph.2015.3. - DOI - PMC - PubMed
    1. Ferenbach DA, Bonventre JV. Acute kidney injury and chronic kidney disease: From the laboratory to the clinic. Nephrol Ther. 2016;12(suppl 1):S41–S48. - PMC - PubMed
    1. Priante G, et al. Cell death in the kidney. Int J Mol Sci. 2019;20(14):3598. doi: 10.3390/ijms20143598. - DOI - PMC - PubMed

Publication types