. 2023 Jan;10(3):e2205462.
doi: 10.1002/advs.202205462. Epub 2022 Dec 1.

Promotion of Lung Cancer Metastasis by SIRT2-Mediated Extracellular Protein Deacetylation

Affiliations

Promotion of Lung Cancer Metastasis by SIRT2-Mediated Extracellular Protein Deacetylation

Meng Wu et al. Adv Sci (Weinh). 2023 Jan.

Abstract

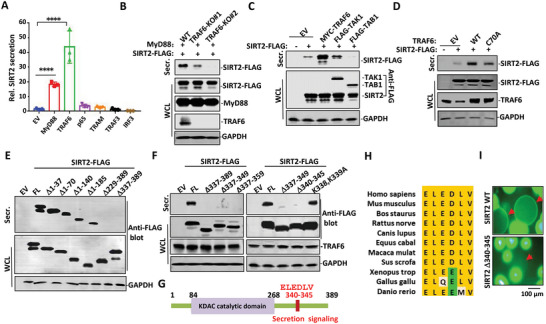
Acetylation of extracellular proteins has been observed in many independent studies where particular attention has been given to the dynamic change of the microenvironmental protein post-translational modifications. While extracellular proteins can be acetylated within the cells prior to their micro-environmental distribution, their deacetylation in a tumor microenvironment remains elusive. Here it is described that multiple acetyl-vWA domain-carrying proteins including integrin β3 (ITGB3) and collagen 6A (COL6A) are deacetylated by Sirtuin family member SIRT2 in extracellular space. SIRT2 is secreted by macrophages following toll-like receptor (TLR) family member TLR4 or TLR2 activation. TLR-activated SIRT2 undergoes autophagosome translocation. TNF receptor associated factor 6 (TRAF6)-mediated autophagy flux in response to TLR2/4 activation can then pump SIRT2 into the microenvironment to function as extracellular SIRT2 (eSIRT2). In the extracellular space, eSIRT2 deacetylates ITGB3 on aK416 involved in cell attachment and migration, leading to a promotion of cancer cell metastasis. In lung cancer patients, significantly increased serum eSIRT2 level correlates with dramatically decreased ITGB3-K416 acetylation in cancer cells. Thus, the extracellular space is a subcellular organelle-like arena where eSIRT2 promotes cancer cell metastasis via catalyzing extracellular protein deacetylation.

Keywords: SIRT2; acetylation; lung cancer; metastasis; secretion.


Conflict of interest statement

The authors declare no conflict of interest.

Figures

Figure 1
Figure 1
SIRT2 secrets from macrophages upon TLR4 or TLR2 activation. A) Mouse peritoneal macrophages were treated with LPS or PAM for indicated times. Proteins in cell culture supernatants (Secr.) were concentrated with trichloroacetic acid (TCA) precipitation and stained with Ponceau S while cells were lysed with RIPA buffer as WCL. Both Secr. and WCL fractions were analyzed in Western blot with SIRT2 antibody. A weak Tubulin secretion was detected with PAM treatment (right panel). B) THP1 cells stably expressing GFP‐SIRT2 were primed with phorbol 12‐myristate 13‐acetate (PMA) for 2 days followed by LPS treatment for indicated times. SIRT2 antibody conjugated agarose beads (red arrows) were added into the cell culture and the GFP‐SIRT2 signal trapped by the beads was then visualized with a fluorescent microscope. C) THP1 cells primed with PMA were treated with LPS or PAM for 24 h. TCA precipitated cell supernatant (Secr.) and WCL were analyzed in Western blot using antibodies against SIRT family members as indicated. D,E) Mouse peritoneal macrophages were treated with different ligands as indicated for 24 h in (D) and (E). SIRT2 abundance in cell supernatant (Secr.) and WCL samples were analyzed in Western blot with SIRT2 antibody or GAPDH/β‐actin antibody. Densitometric analysis was performed using ImageJ software and plotted in the histograms. Peritoneal macrophages collected from wild‐type, F) TLR2−/‐ mice or G) TLR4LPS‐del mice were treated with LPS or PAM. Cell culture medium (Secr.) and WCL were then analyzed in Western blot for SIRT2 secretion. Densitometric analysis was conducted using ImageJ software. Data are shown as mean ± SEM. **, p < 0.01, ****, p < 0.0001; NS indicates no significant difference between mock‐treated (‐) and the indicated treatment group or between indicated two groups.
Figure 2
Figure 2
TRAF6 mediates SIRT2 secretion in activated macrophages. A) SIRT2 was transfected with empty vector (EV), MyD88, TRAF6, p65, TRAM, or TRAF3 in HEK293T cells. The cell culture supernatants were collected for SIRT2 protein measurement using ELISA. Data are shown as mean ± SEM. ****, p < 0.0001 between EV (empty vector) and MyD88 group or between EV group and TRAF6 group. B) Wild‐type or TRAF6‐KO HEK293T cells were transfected with MyD88 and SIRT2‐FLAG. Secreted SIRT2‐FLAG was enriched with anti‐FLAG M2 agarose beads and eluted with sample buffer. WCL and eluate were subjected to Western blot analysis using antibodies against FLAG, MyD88, or TRAF6. C) SIRT2‐FLAG was co‐transfected with EV, TRAF6, TAK1, or TAB1 in HEK293T cells. SIRT2‐FLAG secreted into culture medium (Secr.) was enriched with anti‐FLAG M2 agarose beads and subjected, together with WCL, to Western blot analysis using FLAG antibody. D) SIRT2‐FLAG was co‐transfected with wild‐type TRAF6 or catalytically inactive TRAF6 (C70A) mutant in HEK293T cells. Secreted SIRT2‐FLAG and the expressions of transfectants were analyzed in Western blot. E) Various N‐terminal or C‐terminal domain deletion mutants of SIRT2 in FLAG tagged form were transiently expressed in HEK293T cells. Secreted SIRT2‐FLAG proteins (enriched with M2 beads) were analyzed by Western blot with FLAG antibody. F) A series of C‐terminal domain deletion variants, as well as K338A/K339A mutant of SIRT2 in FLAG tagged form were constructed and transiently expressed in HEK293T cells. Secreted SIRT2‐FLAG proteins (enriched with M2 beads) were analyzed in Western blot with FLAG antibody. G) Schematic drawing of human SIRT2 shows the secretion signaling motif. H) Sequence alignment of SIRT2 secretion signaling motif across different species. I) GFP‐SIRT2 WT or GFP‐SIRT2 Δ340–345 expressing THP1 cells were differentiated with PMA followed by LPS treatment in the presence of SIRT2 antibody conjugated agarose beads (red arrows). GFP (SIRT2) halo on the beads surface was visualized with fluorescent microscope.
Figure 3
Figure 3
The autophagic machinery is utilized for SIRT2 secretion. A) HEK293T cells transfected with either wild type or catalytic‐defective C70A mutant of TRAF6 were subjected to Western Blot analysis for LC3 expression. B) Mouse peritoneal macrophages were treated with LPS or PAM for 24 h, followed by Western blot analysis with antibodies against LC3 and GAPDH. C) Transmission electron microscopy of mouse peritoneal macrophages treated with LPS or PAM for 24 h. Arrows indicate autophagic vesicles. The number of autophagic vesicles per cell was plotted. D) THP1 cells transfected with GFP‐SIRT2 and mCherry‐LC3 were primed with PMA for 48 h, followed by stimulation with LPS or PAM for 24 h. The intracellular distributions of SIRT2 and LC3 were visualized by fluorescent microscopy. Intensity profiles were generated from the white lines using ImageJ. E) Mouse peritoneal macrophages were pre‐treated with DMSO, 3MA (0.5, 1 mmm), Baf A (50 nm), or Resatorvid (50 µm) for 1 h followed by LPS treatment. Cell culture supernatants were collected and subjected to SIRT2 ELISA analysis. Statistics difference was compared to the LPS treatment group. F) Mouse peritoneal macrophages were pre‐treated with DMSO, 1 mm 3MA, or 100 nm DMA for 1 h followed by LPS treatment. SIRT2 proteins of Secr and WCL fractions were analyzed in Western blot. G) Mouse peritoneal macrophages were pre‐treated with 3MA or Baf A followed by LPS treatment. SIRT2 proteins of Secr and WCL fractions were analyzed in Western blot. H) PMA primed THP1 cells were treated with increasing concentrations of AR‐12 for 1 h, followed by LPS stimulation for 24 h. SIRT2 of Secr. and WCL fractions were analyzed in Western blot. I) SIRT2 secretion was induced by LPS treatment in peritoneal macrophages obtained from wild type and ATG7‐KO mice. Densitometric readings were normalized to those in the resting WT group and plotted in the bar graphs. J) ATG7‐KO, K) ATG14‐KO, L) Focal adhesion kinase family interacting protein of 200 kD (FIP200)‐KO or wild type immortalized bone marrow‐derived macrophages (iBMMs) were treated with LPS or PAM for 24 h. SIRT2 proteins of Secr. and WCL fractions were analyzed in Western blot. Densitometric readings were normalized to those in the resting WT group and plotted in the bar graphs. Data are shown as mean ± SEM. **,p < 0.01; ***,p < 0.001; ****, p < 0.0001 between the indicated treatment groups.
Figure 4
Figure 4
Secreted SIRT2 deacetylates membrane proteins extracellularly in lung cancer cells. A) Viable (left) or formaldehyde fixed/Triton X‐100 permeabilized (right) A549 cells were immuno‐stained with pan anti‐acetyl‐K antibody followed by Alexa Fluor 488 conjugated secondary antibody. Cells were visualized with confocal fluorescent microscope. B) A549 and H1299 cells were stained with 7‐AAD and pan acetyl‐K antibody followed by flow cytometry analysis. Cells stained negative for 7‐AAD staining (with intact membranes) were analyzed for acetylation intensity. C–E) A549 cells were co‐cultured with or without LPS‐stimulated THP1 cells. Cells were then non‐permeably stained with pan acetyl‐K antibody and Alexa Fluor 488 conjugated secondary antibody followed by visualization under C) confocal microscopy or D,E) analysis with flow cytometry. F,G) A549 cells were left untreated (Ctrl) or treated with conditioned medium harvested from LPS stimulated peritoneal macrophages from WT, TLR4LPS‐del, or ATG7‐KO mice. Cells were then stained with pan acetyl‐K antibody and Alexa Fluor 488 conjugated secondary antibody, followed by flow cytometry analysis. H,I) SPCA1 and H1299 cells were either untreated or treated with rSIRT2 WT or rSIRT2‐H187Y proteins. Cells were then stained with pan acetyl‐K antibody and Alexa Fluor 488 conjugated secondary antibody, followed by flow cytometry analysis. J) Extracellular membrane acetylation of A549 cells received mock, rSIRT2 WT, or rSIRT2‐H187Y treatment were visualized with confocal microscope using non‐permeable pan acetyl‐K antibody for staining. K) Median fluorescence intensities (MFIs) of these A549 cells were quantified. L) A549 cells were co‐cultured with LPS‐stimulated THP1 cells in the presence or absence of SIRT2 inhibitor AGK2. Cells were then non‐permeably stained with pan acetyl‐K antibody and Alexa Fluor 594 conjugated secondary antibody followed by visualization under confocal microscopy. M) Intensity profiles were generated in different groups using ImageJ. Data are shown as mean ± SEM. **, p < 0.01; ***, p < 0.001; ****, p < 0.0001; NS suggests no significant difference between CTRL and the indicated group.
Figure 5
Figure 5
Identification of extracellular deacetylation proteomics in SIRT2−/‐ mice. A) Workflow for Isobaric TMT based acetylome analysis of mice lung and liver tissues. Integrated approach involving TMT labeling, HPLC fractionation, affinity enrichment, mass spectrometry‐based quantitative proteomics was used to quantify dynamic changes of lysine acetylome between SIRT2−/‐ mice and their wild type littermates. B) Quantitative overview of each TMT experimental database search of lung and liver organs. C) In lung tissues, 580 acetyl‐K sites in 341 protein groups were identified, among which 443 sites in 259 proteins were quantified and 113 sites were up‐regulated, 74 sites were down‐regulated in SIRT2−/‐ mice when compared to their wild‐type littermates. In liver tissues, 760 acetyl‐K sites in 386 protein groups were identified from mouse liver, among which 609 sites in 320 proteins were quantified and 345 sites were up‐regulated, 29 sites were down‐regulated. D) Venn diagram of proteins with significantly up‐regulated lysine acetylation (SIRT2−/‐ versus WT) from each experimental group comparison. Membrane and extracellular proteins in the overlapping region are presented below. E) Scatter plots depicting the log2(fold change) of lysine acetylation(normalized to protein abundance) versus ‐log10 (p‐value) for acetyl‐peptides. Proteins harbor significantly up‐regulated (fold change > 1.2) or down‐regulated (fold change < 0.83) acetyl‐K sites in SIRT2−/‐ lung (upper) or liver (below) tissues are in red. Example membrane or extracellular proteins bearing dramatically increased acetyl‐Ks are highlighted. Collagen IVa2 (COL4A2); Annexin A5 (ANXA5); Serpin Family A Member 1 (A1AT1 and A1AT2); Laminina5 (LAMA5); Laminina3 (LAMA3); Ubiquinol‐Cytochrome C Reductase Hinge Protein (UQCRH); Transmembrane 7 Super‐family Member 2 (TM7SF2); Isoamyl Acetate‐Hydrolyzing Esterase 1 Homolog (IAH1). Histograms depict subcellular localization of those proteins with upregulated acetyl‐Ks according to Gene Ontology (GO) annotations. The number of proteins in each cluster is indicated beside the bars.
Figure 6
Figure 6
SIRT2 deacetylates the vWA domain of ITGB3. A) MS/MS spectra of 2 peptides with up‐regulated K acetylation, including Col4a2 K181 (EDRDK(ac)YR) and Serpina1a K292 (ELISK(ac)FLLNR) were recovered from SIRT2−/‐ mouse lung tissues. B) Synthetic peptides with indicated K acetylation were incubated with or without rSIRT2 protein tagged with His in the presence of NAD+ followed by linear mode MALDI‐TOF‐MS analysis. The mass reduction of 42 daltons in mass spectrum confirmed the SIRT2‐catalyzed lysine deacetylation reaction. C) Polyclonal antibody against acetyl‐K416 within the vWA domain of ITGB3 (using synthesized acetyl‐peptide of K416 motif as the antigen) was generated in rabbit and validated by dot blot experiment. This antibody was reactive with ITGB3‐aK416 peptide in a concentration dependent manner while it had no immuno‐reactivity toward the unacetylated control peptide. D) A549 cells were treated with NAM or TSA. WCL was blotted with the ITGB3‐aK416 antibody and ITGB3 antibody. E) HEK293T cells were transfected with the indicated plasmids. SIRT2‐FLAG was enriched with anti‐FLAG M2 agarose beads and the expression level of ITGB3 was analyzed using Western blotting. F) HEK293T cells were transfected with the indicated plasmids. ITGB3‐Flag was enriched with anti‐FLAG M2 agarose beads and K416 acetylation was analyzed with either ITGB3‐aK416 antibody or pan acetyl‐K antibody. G) HEK293T cells were transfected with indicated plasmids (i.e., EV, ITGB3, ITGB3 plus CREB‐binding protein (CBP), SIRT2 WT, SIRT2 Δ340–345) in lower panel. An aliquot of cells transfected with ITGB3 plus CBP was co‐cultured for 36 h with 1: EV transfected cells, 2: SIRT2 WT transfected cells, 3: SIRT2 Δ340–345 transfected cells (upper panel). Cells were then lysed in 2× SDS sample buffer and subjected to Western blot analysis with indicated antibodies. H) ITGB3‐aK416 acetylation was evaluated in HEK293T cells transiently expressing ITGB3 along with or without HA‐CBP (target cells, upper panel) and cultured with supernatant collected from WT or ATG7KO HEK293T cells transfected with EV or SIRT2‐FLAG (feeder cells, lower panel). WCL were extracted and subjected to Western blot analysis using antibody as indicated. I) A549 cells were cultured alone or co‐cultured with LPS‐treated or untreated THP1 cells. THP1 cells were removed with PBS wash and A549 cells were then non‐permeably stained with anti‐ITGB‐aK416 antibody and Alexa Fluor 594 conjugated secondary antibody followed by visualization under confocal microscopy.
Figure 7
Figure 7
Secreted SIRT2 promotes lung cancer metastasis. A) Cell migration and invasion were assessed in A549 cells by Transwell assay using culture medium supplemented with purified rSIRT2 WT or rSIRT2 H187Y proteins as chemoattractant. Migrated or invaded A549 cells were stained with crystal violet. The proliferation of A549 cells was determined by CCK‐8 assay. B) A549 cell migration and invasion toward culture medium from either SIRT2 WT‐transfected or the SIRT2 D340–345‐transfected HEK293T cells were determined by Transwell assay. The proliferation of A549 cells was determined by CCK‐8 assay. C) Transwell assay of invasion and migration of A549 cells using culture medium from either SIRT2 WT transfected HEK293T cells, SIRT2 WT plus siTRAF6, or SIRT2 WT plus siATG7 co‐transfected HEK293T cells as chemoattractant. Western blot analysis confirmed the knockdown of TRAF6 and ATG7 in these cells. D) Transwell assay of migration of H1299 cells using culture medium from either empty vector‐transfected or SIRT2‐transfected WT or ATG7‐KO HEK293T cells as chemoattractant. Western blot analysis of ATG7 expression was shown on the right. E–H) B16 melanoma cells were injected into wild‐type, SIRT2−/‐ or ATG7‐KO mice through the tail vein. E) Representative images of whole lungs with B16 melanoma cell nodules. F) Metastatic nodules were counted 14 days post B16 cell tail injection. G) H&E staining of the lung sections of the above mice. H) The levels of ITGB3 K416 acetylation in lung cancer tissues of three types of animals as indicated were compared by IHC staining with the ITGB3‐aK416 antibody. I) Lung cancer cells (A549 cells and H1299 cells) were cultured alone or co‐cultured with macrophages treated with LPS or AGK2 plus LPS followed by transwell migration assay. J) A549 cells (2 × 105) were cultured alone or co‐cultured with wildtype or SIRT2−/− macrophages (2 × 105) in the presence or absence of LPS. Transwell migration assay was performed to analyze metastasis tendency of these A549 cells. K) Lewis lung cancer cells (5 × 106) were subcutaneously injected into the flank of C57BL/6 mice. 6 weeks later, the primary tumors were excised. 2 × 105 TAMs isolated from the tumor tissues were compared with BMDMs for SIRT2 secretion in response to LPS or no treatment. Secreted SIRT2 were measured with ELISA. L) Lewis lung cancer cells (2 × 105) were cocultured with macrophages isolated from lung cancer adjacent normal tissues (CANM) or lung tumor tissues (TAM) obtained from lung cancer patients, treated with or without LPS (2 µg mL−1) for 12 h. 24 h after incubation, Lewis lung cancer cells left in the Boyden chamber were stained with crystal violet and photographed. Columns represented mean ± SEM of 3 experiments. Data are shown as mean ± SEM. **, p < 0.01; ***, p < 0.001; ****, p < 0.0001; NS suggests no significant difference between mock‐treated (‐) and the indicated group.
Figure 8
Figure 8
SIRT2 secretion and ITGB3 deacetylation correlate with poor prognosis in human lung cancer. A) Blood samples collected from healthy controls (n = 5), NSCLC patients (n = 16), and SCLC patients (n = 21) were analyzed for SIRT2 protein levels with ELISA. B) Lung tissues from normal people or patients with different types of lung cancer were subjected to IHC analysis for ITGB3 acetylation using ITGB3‐aK416 antibody. C) Blood samples collected from healthy controls (n = 5) and lung cancer patients including NSCLC (n = 16) and SCLC (n = 4) patients were analyzed for NAD+ levels. D) Lung adenocarcinoma and adjacent normal tissues from three patients were subjected to IHC analysis for ITGB3 acetylation. E,F) Immunofluorescence analysis of SIRT2, ITGB3‐aK416, and CD68 in lung adenocarcinoma and adjacent normal tissues. DAPI staining was used to label the nucleus. Intensity profiles were generated in different groups using ImageJ in (F). G) IHC analysis of CD68 and SIRT2 from coherent tissue. H&E staining of lung adenocarcinoma and adjacent normal tissues was also performed. H) Tumor associated macrophages (T) or normal tissue associated macrophages (N) (1 × 106) used in Figure 7K were examined for SIRT2 protein expression with Western blot. Relative SIRT2 protein expression intensities from three experiments were quantitated with ImageJ. I,J) Lung tumor tissues (T) and adjacent normal tissues (N) were obtained from lung adenocarcinoma patients and subjected to Western blot analysis with antibodies against ITGB3‐K416 acetylation and ITGB3. Representative immunoblots are shown in (I). Densitometry of immunoblots was measured by ImageJ in (J). K) The IHC staining intensity scores for ITGB3‐K416 acetylation in lung cancer tissue microarray (n = 85). T: lung tumor tissues, N: adjacent normal tissues. L) Kaplan‐Meier analysis of overall survival in the above 85 patients according to ITGB3‐K416 acetylation intensity. Score ≤ 60 was considered as low while score > 60 as high. Data are shown as mean ± SEM. *, p < 0.05; ***, p < 0.001; NS suggests no significant difference between control and the indicated groups or between the indicated two groups.
Figure 9
Figure 9
Illustration of promotion of lung cancer metastasis by SIRT2‐mediated extracellular protein deacetylation. Macrophages secrete SIRT2 protein into extracellular space where SIRT2 protein deacetylates proteins of cell membrane and extracellular matrix, resulting in cancer cell metastasis.

References

    1. Winkler J., Abisoye‐Ogunniyan A., Metcalf K. J., Werb Z., Nat. Commun. 2020, 11, 5120. - PMC - PubMed
    1. Cox T. R., Nat. Rev. Cancer 2021, 21, 217. - PubMed
    1. Dieterich I. A., Lawton A. J., Peng Y., Yu Q., Rhoads T. W., Overmyer K. A., Cui Y., Armstrong E. A., Howell P. R., Burhans M. S., Li L., Denu J. M., Coon J. J., Anderson R. M., Puglielli L., Nat. Commun. 2019, 10, 3929. - PMC - PubMed
    1. Harada H., Farhani N., Wang X. F., Sugita S., Charish J., Attisano L., Moran M., Cloutier J. F., Reber M., Bremner R., Monnier P. P., Nat. Chem. Biol. 2019, 15, 1035. - PubMed
    1. Lundby A., Lage K., Weinert B. T., Bekker‐Jensen D. B., Secher A., Skovgaard T., Kelstrup C. D., Dmytriyev A., Choudhary C., Lundby C., Olsen J. V., Cell Rep. 2012, 2, 419. - PMC - PubMed

Publication types

LinkOut - more resources