. 2023 May 9;7(9):1725-1738.
doi: 10.1182/bloodadvances.2022008490.

Activation priming and cytokine polyfunctionality modulate the enhanced functionality of low-affinity CD19 CAR T cells

Affiliations

Activation priming and cytokine polyfunctionality modulate the enhanced functionality of low-affinity CD19 CAR T cells

Ilaria M Michelozzi et al. Blood Adv. .

Abstract

We recently described a low-affinity second-generation CD19 chimeric antigen receptor (CAR) CAT that showed enhanced expansion, cytotoxicity, and antitumor efficacy compared with the high-affinity (FMC63-based) CAR used in tisagenlecleucel, in preclinical models. Furthermore, CAT demonstrated an excellent toxicity profile, enhanced in vivo expansion, and long-term persistence in a phase 1 clinical study. To understand the molecular mechanisms behind these properties of CAT CAR T cells, we performed a systematic in vitro characterization of the transcriptomic (RNA sequencing) and protein (cytometry by time of flight) changes occurring in T cells expressing low-affinity vs high-affinity CD19 CARs following stimulation with CD19-expressing cells. Our results show that CAT CAR T cells exhibit enhanced activation to CD19 stimulation and a distinct transcriptomic and protein profile, with increased activation and cytokine polyfunctionality compared with FMC63 CAR T cells. We demonstrate that the enhanced functionality of low-affinity CAT CAR T cells is a consequence of an antigen-dependent priming induced by residual CD19-expressing B cells present in the manufacture.


Conflict of interest statement

Conflict-of-interest disclosure: S.G. received speaker’s honoraria from Novartis and patents and royalties from UCLB. M.A.P. owns stock in and is in part employed by Autolus Therapeutics, that has licensed CAT CAR. P.J.A. has received royalties for a patent related to CAT CAR from Autolus and receives research funding from Autolus. The remaining authors declare no competing financial interests.

Figures

None
Graphical abstract
Figure 1.
Figure 1.
Generation and phenotypic characterization of CAR T cells from HD-PBMCs. (A) Experimental workflow. PBMCs were isolated from HDs and LV transduced to express CD19 CAR construct (FMC63 or CAT) following overnight activation with CD3/CD28 beads. Six days after transduction, CAR T cells were cultured without (unstimulated) or with target cells (NALM6) at a 1:1 ratio (stimulated). Unstimulated and stimulated cells were analyzed by flow cytometry and sorted for RNA-seq 24 hours poststimulation. Mass cytometry analysis was performed on unstimulated and stimulated cells 24 hours poststimulation. Activated UNTR T cells were used as a control throughout the experiment. (B) (Left) spaghetti plots showing transduction levels of CAR T cells as percentage of mCherry+ (in CD3+) and (right) as MFI of mCherry in unstimulated transduced T cells measured by FACS 7 days posttransduction. Lines connect results from individual donors (n = 12 HDs, n = 3 independent experiments). (C) Spaghetti plot showing the percentage of surface CAR expression (in CD3+) in unstimulated transduced T cells measured by FACS 10 days posttransduction. Lines connect results from individual donors (n = 4 HDs, n = 1 independent experiment). (D) Variation (log2 fold change) of CD4 and CD8 proportion in unstimulated UNTR T cells and FMC63 and CAT CAR T cells measured by FACS 7 days posttransduction. The dotted horizontal line (0) represents the conditions in which CD4 = CD8. Data represent mean ± SEM (n = 12 HDs, n = 3 independent experiments). (E) Bar plots showing the percentage of TCM (CD45RACD62L+) (left), TEM (CD45RACD62L) (middle), and TEMRA (CD45RA+CD62L) (right) in unstimulated CD3+ UNTR T cells and FMC63 and CAT CAR T cells measured by FACS 10 days posttransduction. Data represent mean ± SEM (n = 7 HDs, n = 2 independent experiments). (B-E) Statistical significance was calculated by paired t test; ∗P < .05, ∗∗P < .01, and ∗∗∗∗P < .0001. Each experimental condition is indicated by a specific color code (UNTR, light gray; FMC63, light blue; CAT, orange). MFI, mean fluorescent intensity; SEM, standard error of the mean.
Figure 2.
Figure 2.
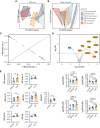
RNA-seq and mass cytometry analyses of unstimulated UNTR and CAR-transduced T cells. (A) PCA of the top 500 variable genes from RNA-seq analysis across all experimental conditions (n = 6 HDs, n = 2 independent experiments). (B) PCA of mass cytometry EMD scores computed at 24 hours poststimulation in CD3+ cells across all experimental conditions (n = 4 HDs, n = 1 independent experiment). (C) Fuzzy clustering analysis of RNA-seq data across all experimental conditions (n = 6 HDs, n = 2 independent experiments). (D) Volcano plot showing differentially expressed genes between unstimulated FMC63 and CAT CAR T cells (top). The dashed horizontal line represents the statistical significance threshold (FDR <0.1). The bar plots show the expression of selected differentially expressed genes (FDR <0.1) in unstimulated UNTR and transduced T cells (bottom). Data represent mean ± SEM (n = 6 HDs, n = 2 independent experiments). (E) Bar plots showing the expression of mass cytometry EMD scores for granzyme B, perforin B, HLA-DR, CD25, NFAT1, pZAP70, and pS6 in unstimulated CAR T cells at 24 hours upon stimulation. The data shown are normalized to stimulated CD3+ UNTR T cells. The dotted horizontal line (0) represents the expression of a specific marker in unstimulated CD3+ UNTR T cells. Data represent mean ± SEM (n = 7 HDs, n = 2 independent experiments). Statistical significance was calculated by paired t test; ∗P < .05 and ∗∗P < .01. (A-E) Each experimental condition is indicated by a specific color code (unstimulated conditions: UNTR, light gray; FMC63, light blue; and CAT, orange; stimulated conditions: UNTR, gray; FMC63, blue; and CAT, red). FDR, false discovery rate; SEM, standard error of the mean.
Figure 3.
Figure 3.
Phenotypic and molecular characterization of stimulated CAR-transduced T cells. (A) Variation (log2 fold change) of CD4 and CD8 proportion in stimulated UNTR T cells and FMC63 and CAT CAR T cells measured by FACS (n = 12 HDs, n = 3 independent experiments). The dotted horizontal line (0) represents the conditions in which CD4 = CD8. (B) Bar plot showing the percentage of TCM (CD45RACD62L+) in stimulated CD3+ UNTR T cells and FMC63 and CAT CAR T cells measured by FACS 96 hours postantigen stimulation (n = 7 HDs, n = 2 independent experiments). (C) Bar plots showing the expression of T-cell exhaustion markers (PD1, TIM3, and LAG3) as MFI in stimulated CD3+ UNTR T cells and FMC63 and CAT CAR T cells measured by FACS 96 hours postantigen stimulation (n = 4 HDs, n = 1 independent experiment). (D) Volcano plot showing differentially expressed genes between FMC63 and CAT CAR T cells upon NALM6 coculture (left). The dashed horizontal line represents the statistical significance threshold (FDR <0.1). Bar plots showing the expression of selected differentially expressed genes (FDR <0.1) in stimulated UNTR T cells and in CAR T cells (n = 6 HDs, n = 2 independent experiments) (right). (E) Bar plots showing the expression of mass cytometry EMD scores for CD25, HLA-DR, NFAT1, FOXP3, pZAP70, pS6, pp38, pCREB, pRB, and CD4 in stimulated CAR T cells at 24 hours upon stimulation. The data shown are normalized to stimulated CD3+ UNTR T cells. The dotted horizontal line (0) represents the expression of a specific marker in stimulated CD3+ UNTR T cells (n = 7 HDs, n = 2 independent experiments). (A-E) Bar plots show mean ± SEM. Each experimental condition is indicated by a specific color code (UNTR, gray; FMC63, blue; and CAT, red). Panels A-C,E show statistical significance calculated by paired t test; ∗P < .05, ∗∗P < .01, ∗∗∗P < .001, and ∗∗∗∗P < .0001. FDR, false discovery rate; MFI, mean fluorescent intensity; SEM, standard error of the mean.
Figure 4.
Figure 4.
Cytokine polyfunctionality in stimulated CAR-transduced T cells. (A) Bar plots showing the expression of mass cytometry EMD scores for effector (granzyme B, IFN-γ, TNF-α) and stimulatory (GM-CSF, IL-2) cytokines in stimulated CAR T cells. The data shown are normalized to stimulated CD3+ UNTR T cells. The dotted horizontal line (0) represents the expression of a specific marker in stimulated CD3+ UNTR T cells. (n = 7 HDs, n = 2 independent experiments). (B) Bar plots showing the mean cytokine polyfunctionality in stimulated CAR T cells, normalized to stimulated CD3+ UNTR T cells. The dotted horizontal line (1) represents the mean polyfunctionality in stimulated CD3+ UNTR T cells. (n = 7 HDs, n = 2 independent experiments). (C) Stacked bar plots showing the percentage of stimulated CAR T cells (CD3+mCherry+) expressing 1 to 4 or ≥5 cytokines per cell as measured by mass cytometry. (D) Circos plots showing all the combinations of the 8 cytokines in stimulated FMC63 (left) and CAT (right) CAR T cells analyzed by mass cytometry. The numbers indicate patterns of cytokine coexpression (from 1-4 or ≥5 cytokines/cell). A specific color code has been assigned to each cytokine. (A-B) Data represent mean ± SEM. Statistical significance was calculated by paired t test; ∗P < .05 and ∗∗∗P < .001. Each experimental condition is indicated by a specific color code (FMC63, blue and CAT, red). GM-CSF, granulocyte-macrophage colony-stimulating factor; SEM, standard error of the mean; TNF-α, tumor necrosis factor α.
Figure 5.
Figure 5.
Molecular characterization of CAR T cells generated from CD19-depleted PBMCs. (A) UMAP representation of the 4 cell populations (CD8, CD4, CD3 low/neg, and CD19) identified by FlowSOM analysis in 4 representative unstimulated samples analyzed by mass cytometry at 24 hours poststimulation (left) (n = 4 HDs, n = 1 independent experiment). Cell types are indicated by different colors. Percentage of residual B cells detected by mass cytometry in unstimulated samples at 24 hours poststimulation (right) (n = 7 HDs, n = 2 independent experiments). (B) Bar plots showing the percentage of TCM (CD45RACD62L+) (left) and TEM (CD45RACD62L) (right) in unstimulated CD19-depleted CD3+ UNTR T cells and FMC63 and CAT CAR T cells measured by FACS (n = 4 HDs, n = 1 independent experiment). (C) Bar plots showing the expression of mass cytometry EMD scores for granzyme B, perforin B, HLA-DR, CD25, NFAT1, pZAP70, and pS6 in unstimulated CD19-depleted CAR T cells at 24 hours upon stimulation. The data shown are normalized to stimulated CD3+ UNTR T cells. The dotted horizontal line (0) represents the expression of a specific marker in unstimulated CD3+ CD19-depleted UNTR T cells. (n = 3 HDs, n = 1 independent experiment). (D) Bar plots showing the expression of mass cytometry EMD scores for CD25, HLA-DR, NFAT1, pZAP70, pS6, pp38, pRB, and CD4 in stimulated CD19-depleted CAR T cells at 24 hours upon stimulation. The data shown are normalized to stimulated CD3+ UNTR T cells. The dotted horizontal line (0) represents the expression of a specific marker in stimulated CD19-depleted CD3+ UNTR T cells (n = 3 HDs, n = 1 independent experiment). (E) Bar plots showing the mean polyfunctionality in CD19-depleted CAR T cells at 24 hours upon stimulation. The data shown are normalized to stimulated CD3+ UNTR T cells. The dotted horizontal line (1) represents the mean polyfunctionality in stimulated CD3+ CD19-depleted UNTR T cells (n = 3 HDs, n = 1 independent experiment). (A-E) Each experimental condition is indicated by a specific color code (unstimulated conditions: UNTR, light gray; FMC63, light blue; CAT, orange; stimulated conditions: FMC63, blue; CAT, red). Bar plots show mean ± SEM. Statistical significance was calculated by paired t test; ∗P < .05 and ∗∗P < .01. SEM, standard error of the mean.

References

    1. Miliotou AN, Papadopoulou LC. CAR T-cell therapy: a new era in cancer immunotherapy. Curr Pharm Biotechnol. 2018;19(1):5–18. - PubMed
    1. Pehlivan KC, Duncan BB, Lee DW. CAR-T cell therapy for acute lymphoblastic leukemia: transforming the treatment of relapsed and refractory disease. Curr Hematol Malig Rep. 2018;13(5):396–406. - PubMed
    1. Lee DW, Gardner R, Porter DL, et al. Current concepts in the diagnosis and management of cytokine release syndrome. Blood. 2014;124(2):188–195. - PMC - PubMed
    1. Gust J, Hay KA, Hanafi LA, et al. Endothelial activation and blood-brain barrier disruption in neurotoxicity after adoptive immunotherapy with CD19 CAR-T cells. Cancer Discov. 2017;7(12):1404–1419. - PMC - PubMed
    1. Watanabe K, Kuramitsu S, Posey AD, Jr., June CH. Expanding the therapeutic window for CAR T cell therapy in solid tumors: the knowns and unknowns of CAR T cell biology. Front Immunol. 2018;9 - PMC - PubMed

Publication types

MeSH terms