. 2023 Apr 11;7(7):1219-1224.
doi: 10.1182/bloodadvances.2021006838.

Elevated RIPK3 correlates with disease burden in myelofibrosis

Affiliations

Elevated RIPK3 correlates with disease burden in myelofibrosis

Veronika Dill et al. Blood Adv. .
No abstract available


Conflict of interest statement

Conflict-of-interest disclosure: P.J.J. has had a consulting or advisory role and received honoraria, research funding, and/or travel/accommodation expenses from Ariad, AbbVie, Bayer, Boehringer, Novartis, Pfizer, Servier, Roche, Bristol Myers Squibb (BMS), and Celgene. V.D., P.H., and S.J. received honoraria from Novartis. K.S. has had a consulting or advisory role, and received honoraria, and /or travel/accommodation expenses from AbbVie, Blueprint Medicines, BMS, and Novartis. M.S. received honoraria from Roche, Novartis and BMS. F.B.Q. received honoraria and research funding from BMS/Celgene. The remaining authors declare no competing financial interests.

Figures

Figure 1.
Figure 1.
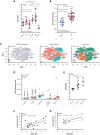
RIPK3 is significantly increased in MF and correlates with disease burden. (A) Intracellular RIPK3 protein expression of PBMCs from 9 healthy control subjects, 11 patients with ET, 10 patients with PV, 8 patients with pre-MF, 16 patients with MF, and 3 patients with sAML after a history of MPN were quantified via flow cytometry. RIPK3 protein expression was calculated as the ratio of stained antibody MFI divided by isotype control MFI. Shown are the mean and error bars denoting standard deviation. The presence of a JAK2 V16F mutation is indicated by the coloration of the individual patient samples. One-way ANOVA P < .0001; P values from post hoc analysis with Tukey test as indicated in the figure. (B) RIPK3 gene expression (mRNA) was analyzed in primary human CD34+ PBMCs from 39 patients with PMF (including 18 JAK2 V16F mutated and 21 JAK2 V617F wild-type patients) and 16 healthy control subjects using the Human Genome U219 Array (GEO: GSE53482). Shown are the mean and error bars denoting standard deviation. P values from Student t test as indicated in the figure. (C-D) Analysis of single-cell RNA sequencing data of primary human CD34+ HSPCs from a public database (GEO: GSE144568). (C) Dimensionality reduction by t-SNE summarizing all MF and control cells analyzed. Each dot represents a single cell. Left panel: t-SNE colored by RIPK3 expression (low [gray] or high [blue]). Middle panel: t-SNE colored by disease status (healthy donors [blue] or MF [red]). Right panel: t-SNE colored by hematopoietic cell types according to the expression of lineage signature genes as indicated in the figure. (D) Boxplots indicating RIPK3 expression within positive cells in MF and control cells, normalized by the number of positive cells. (E-G) RIPK3 protein expression in PBMCs was analyzed and calculated as described in Figure 1A. (E) RIPK3 protein expression in PBMCs from 17 patients with MF (including PMF, post-PV MF, and post-ET MF) including 6 patients with DIPSS-based classification as intermediate-risk I, 8 intermediate-risk II patients, and 3 high-risk patients. Shown are the mean and error bars denoting standard deviation. One-way ANOVA P = .0133; P values from post hoc Tukey test as indicated in the figure. (F) Linear regression analysis of RIPK3 protein levels and leucocyte count (G/L) in patients with MF (including PMF, post-ET MF, and post-PV MF) (n = 16). Pearson r = 0.562, P = .0235, y = 2.552x – 0.5553. (G) Linear regression analysis of RIPK3 protein levels with spleen length (cm) in patients with MF (including PMF, post-ET M, F, and, post-PV MF; n = 8). Pearson r = 0.7705, P = .0252, y = 3.095x + 5.833. All panels: level of significance .05: ∗P < .05, ∗∗P < .005, ∗∗∗P < .0005 and ∗∗∗∗P <.0001. ANOVA, analysis of variance; DIPSS, Dynamic International Prognostic Scoring System; HSPC, hematopoietic stem and progenitor cell; MFI, mean fluorescence intensity; mRNA, messenger RNA; PMF, primary myelofibrosis; sAML, secondary acute myeloid leukemia; t-SNE, t-distributed stochastic neighbor embedding.
Figure 2.
Figure 2.
RIPK3 inhibition reduces TNF levels in MF supernatant and increases the viability of MF PBMCs. (A) Cytokine levels of IL-8 were determined by CBA in the PB serum of 3 healthy control subjects and 1 patient with MF. Data are shown as dot plots reporting mean and standard deviation. P values from Mann-Whitney test as indicated in the figure. (B) Cytokine levels of VEGF were determined by CBA in the PB serum of 3 healthy control subjects and 20 patients with MF. Data are shown as dot plots reporting mean and standard deviation. P values from Mann-Whitney test as indicated in the figure. (C) RIPK3 protein levels were quantified in PBMCs from 14 patients with MF as described in Figure 1A and correlated with corresponding b-FGF levels (pg/mL) analyzed by CBA. The strength of the association was calculated by Pearson correlation coefficient. The functional relationship was characterized by linear regression analysis. Pearson r = 0.5548, P = .0488, y = 7.301X -17.37. (D) Cytokine levels of TNF were determined by CBA in the supernatant of liquid culture of PBMCs from 6 patients with MF, and 4 healthy control subjects after treatment with the RIPK3 inhibitor GSK’843 (1 μM) and vehicle control DMSO (1:1000) for 72 hours. Data are shown as dot plots reporting mean and standard deviation. Student t test as shown in the figure. (E) Cell viability of PBMCs from 3 healthy control subjects and 4 patients with MF was analyzed by flow cytometry after staining with 7AAD and Annexin V. Shown is the ratio between the percentage of viable PBMCs after treatment with soluble control (DMSO 1:1000), and the percentage of viable PBMCs after treatment with GSK’843 (1 μM) for 72 hours. Shown are the mean and error bars denoting standard deviation. For comparison between entities, one-way ANOVA was performed (P = .0037) with a post-hoc Tukey test as shown in the figure. For comparison between treatment (GSK 1 μM) and soluble control (DMSO 1:1000), Student t test was used as shown in the figure. (F) BMMCs were treated for 72 hours with GSK’843 (1 μM) and vehicle control (DMSO 1:1000), before being plated in cytokine-enriched methylcellulose. The number of colonies was counted after 14 days. Experiments were performed in duplicates. Shown is the number of colonies from 3 patients with pre-MF (including pre-MF and PMF) and 4 healthy control subjects. The colony subtypes are indicated in the legend. Two-way ANOVA was performed. All panels: level of significance: .05; ∗P < .05, ∗∗P < .005. ANOVA, analysis of variance; BMMCs, BM mononuclear cells; CBA, cytometric bead assay; IL-8, interleukin-8; PMF, primary myelofibrosis; VEGF, vascular endothelial growth factor.

References

    1. Craver BM, El Alaoui K, Scherber RM, Fleischman AG. The critical role of inflammation in the pathogenesis and progression of myeloid malignancies. Cancers (Basel) 2018;10(4):104–120. - PMC - PubMed
    1. Hasselbalch HC, Bjorn ME. MPNs as inflammatory diseases: the evidence, consequences, and perspectives. Mediators Inflamm. 2015;2015 - PMC - PubMed
    1. Hoermann G, Greiner G, Valent P. Cytokine regulation of microenvironmental cells in myeloproliferative neoplasms. Mediators Inflamm. 2015;2015 - PMC - PubMed
    1. Le Bousse-Kerdiles MC, Martyre MC. Dual implication of fibrogenic cytokines in the pathogenesis of fibrosis and myeloproliferation in myeloid metaplasia with myelofibrosis. Ann Hematol. 1999;78(10):437–444. - PubMed
    1. Fleischman AG, Aichberger KJ, Luty SB, et al. TNFalpha facilitates clonal expansion of JAK2V617F positive cells in myeloproliferative neoplasms. Blood. 2011;118(24):6392–6398. - PMC - PubMed

Publication types

MeSH terms

Substances