

One-Step Preparation of an Injectable Hydrogel Scaffold System Capable of Sequential Dual-Growth Factor Release to Maximize Bone Regeneration
- PMID: 36453668
- PMCID: PMC11468681
- DOI: 10.1002/adhm.202202401
One-Step Preparation of an Injectable Hydrogel Scaffold System Capable of Sequential Dual-Growth Factor Release to Maximize Bone Regeneration
Abstract
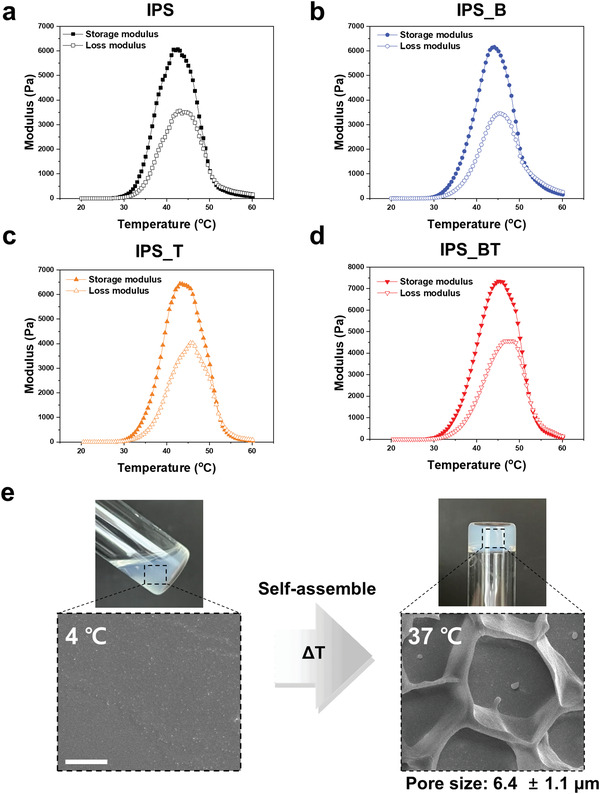
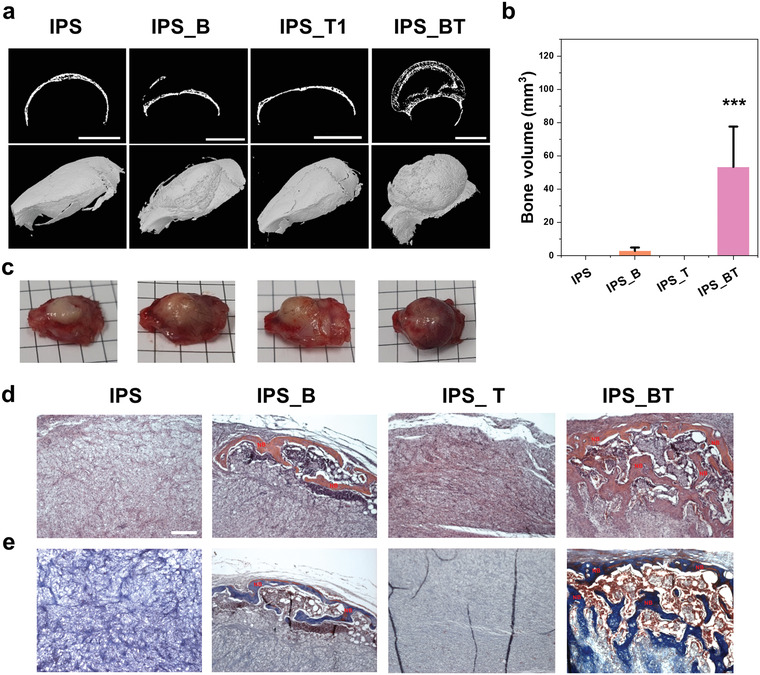
Numerous growth factors are involved in the natural bone healing process, which is precisely controlled in a time- and concentration-dependent manner. Mimicking the secretion pattern of growth factors could be an effective means to maximize the bone regeneration effect. However, achieving the sequential delivery of various growth factors without the use of multiple materials or complex scaffold designs is challenging. Herein, an injectable poly(organophosphazene) hydrogel scaffold (IPS) encapsulating bone morphogenetic protein (BMP)-2 and TGFβ-1 (IPS_BT) is studied to mimic the sequential secretion of growth factors involved in natural bone healing. The IPS_BT system is designed to release TGFβ-1 slowly while retaining BMP-2 for a longer period of time. When IPS_BT is injected in vivo, the hydrogel is replaced by bone tissue. In addition, angiogenic (CD31 and alpha-smooth muscle actin (α-SMA)) and stemness (Nanog and SOX2) markers are highly upregulated in the early stages of bone regeneration. The IPS system developed here has promising applications in tissue engineering because 1) various amounts of the growth factors can be loaded in one step, 2) the release pattern of each growth factor can be controlled via differences in their molecular interactions, and 3) the injected IPS can be degraded and replaced with regenerated bone tissue.
Keywords: angiogenesis; bone healing; growth factors; injectable hydrogels; stem cells.
© 2022 The Authors. Advanced Healthcare Materials published by Wiley-VCH GmbH.
Conflict of interest statement
The authors declare no conflict of interest.
Figures


Similar articles
-
Novel therapeutic core-shell hydrogel scaffolds with sequential delivery of cobalt and bone morphogenetic protein-2 for synergistic bone regeneration.Acta Biomater. 2015 Sep;23:295-308. doi: 10.1016/j.actbio.2015.06.002. Epub 2015 Jun 6. Acta Biomater. 2015. PMID: 26054564
-
Injectable and in situ crosslinkable gelatin microribbon hydrogels for stem cell delivery and bone regeneration in vivo.Theranostics. 2020 May 15;10(13):6035-6047. doi: 10.7150/thno.41096. eCollection 2020. Theranostics. 2020. PMID: 32483436 Free PMC article.
-
Effects of controlled dual growth factor delivery on bone regeneration following composite bone-muscle injury.Acta Biomater. 2020 Sep 15;114:63-75. doi: 10.1016/j.actbio.2020.07.026. Epub 2020 Jul 18. Acta Biomater. 2020. PMID: 32688092
-
Tuning physical properties and BMP-2 release rates of injectable hydrogel systems for an optimal bone regeneration effect.Biomaterials. 2017 Apr;122:91-104. doi: 10.1016/j.biomaterials.2017.01.016. Epub 2017 Jan 12. Biomaterials. 2017. PMID: 28110173
-
Hydrogel based injectable scaffolds for cardiac tissue regeneration.Biotechnol Adv. 2014 Mar-Apr;32(2):449-61. doi: 10.1016/j.biotechadv.2013.12.010. Epub 2014 Jan 7. Biotechnol Adv. 2014. PMID: 24406815 Review.
Cited by
-
Micro-fragmented collagen hydrogel wound dressing: Enhanced porosity facilitates elevated stem cell survival and paracrine effects for accelerated wound maturation.Mater Today Bio. 2025 Mar 22;32:101678. doi: 10.1016/j.mtbio.2025.101678. eCollection 2025 Jun. Mater Today Bio. 2025. PMID: 40225133 Free PMC article.
-
Integrating Micro- and Nanostructured Platforms and Biological Drugs to Enhance Biomaterial-Based Bone Regeneration Strategies.Biomacromolecules. 2025 Jan 13;26(1):140-162. doi: 10.1021/acs.biomac.4c01133. Epub 2024 Dec 2. Biomacromolecules. 2025. PMID: 39621708 Free PMC article. Review.
-
Thermo-responsive Bioink for Personalized 3D Printed Scaffolds with Antioxidant and Fibroblast Delivery to Accelerate Diabetic Wound Healing.Biomater Res. 2025 Jun 11;29:0216. doi: 10.34133/bmr.0216. eCollection 2025. Biomater Res. 2025. PMID: 40822258 Free PMC article.
References
-
- Mishima Y., Lotz M., J. Orthop. Res. 2008, 26, 1407. - PubMed
-
- a) Karst M., Gorny G., Galvin R. J., Oursler M. J., J. Cell. Physiol. 2004, 200, 99; - PMC - PubMed
- b) Crane J. L., Xian L., Cao X., Methods Mol. Biol. 2016, 1344, 287; - PubMed
- c) Jansen J. A., Vehof J. W. M., Ruhé P. Q., Kroeze‐Deutman H., Kuboki Y., Takita H., Hedberg E. L., Mikos A. G., J. Controlled Release 2005, 101, 127. - PubMed
Publication types
MeSH terms
Substances
LinkOut - more resources
Full Text Sources
Research Materials
