. 2022 Nov 28;50(21):12328-12343.
doi: 10.1093/nar/gkac1030.

Deciphering RNA G-quadruplex function during the early steps of HIV-1 infection

Affiliations

Deciphering RNA G-quadruplex function during the early steps of HIV-1 infection

Samir Amrane et al. Nucleic Acids Res. .

Abstract

G-quadruplexes (G4s) are four-stranded nucleic acid structures formed by the stacking of G-tetrads. Here we investigated their formation and function during HIV-1 infection. Using bioinformatics and biophysics analyses we first searched for evolutionary conserved G4-forming sequences in HIV-1 genome. We identified 10 G4s with conservation rates higher than those of HIV-1 regulatory sequences such as RRE and TAR. We then used porphyrin-based G4-binders to probe the formation of the G4s during infection of human cells by native HIV-1. The G4-binders efficiently inhibited HIV-1 infectivity, which is attributed to the formation of G4 structures during HIV-1 replication. Using a qRT-PCR approach, we showed that the formation of viral G4s occurs during the first 2 h post-infection and their stabilization by the G4-binders prevents initiation of reverse transcription. We also used a G4-RNA pull-down approach, based on a G4-specific biotinylated probe, to allow the direct detection and identification of viral G4-RNA in infected cells. Most of the detected G4-RNAs contain crucial regulatory elements such as the PPT and cPPT sequences as well as the U3 region. Hence, these G4s would function in the early stages of infection when the viral RNA genome is being processed for the reverse transcription step.


Figures

Graphical Abstract
Graphical Abstract
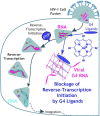
Formation of viral RNA G-quadruplexes occurs during the early stages of HIV-1 infection. Targeting them with G4-ligands prevents initiation of reverse transcription.
Figure 1.
Figure 1.
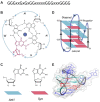
G4 nucleic acid structures. (A) Example of a G-quadruplex motif: Repeats of two to four guanines are separated by inter-block sequences composed of 1 to 15 nt (X, any nucleotide). The blocks of more than three Gs can be interrupted by one or two non-G residues. (B) Structure of a G-quartet. The guanine in red adopt a syn conformation. Those in black are in the anti conformation. Different groove sizes are depicted (N, narrow; M, medium; W, wide). The tetrad is stabilized by a central K+ or Na+ cation (blue). (C) Syn and anti conformations adopted by Guanines. (D) Schematic representation of a hybrid type G4 (PDB = 2LOD) composed of three tetrads with three different loop types: propeller, diagonal and lateral. Syn and anti conformations appear in red and cyan. (E) Surface view of the G4 (PDB = 2LOD). Syn and anti conformations appear in red and cyan.
Figure 2.
Figure 2.
In silico detection of the putative G4FSs in HIV-1 and biophysical validation. (A) Scheme of HIV-1 genome composed of nine genes. The positions of the putative G4FSs are indicated by red dashed lines for the sequences located on the RNA or DNA plus strands and blue dashed lines indicate those located on the minus strand of the DNA. (B) Putative G4FSs detected using G4Hunter using a window of 25 nt. The average of the 2177 scores for each window is then assigned to the first nucleotide of the 25-nt sequence. Regions with scores greater than or equal to 1 (in absolute value) can form a G4, whereas those with scores below 1 (in absolute value) are unlikely to form a G4. The putative G4FSs are numbered. Above the numbers, symbols indicate whether the region forms a stable DNA (green) or RNA (purple) G4 in vitro (marked with ✓), an unstable G4 (marked with ≈), or does not form a G4 (marked with ✗). The final sequence alignment has a length of about 12 000 nt exceeding the size of 9.2 kb known for the HIV-1 genome due to the insertion of “gaps” necessary to optimize the sequence alignment. (C) Logo representations of the putative G4FSs generated using Weblogo (www.weblogo.com). The heights of the residues are proportional to frequencies in the alignment. (D) Average evolutionary rates of each putative G4FS and RRE-S1, RRE-S2, TAR regulatory elements. The average pairwise p-distances are shown in Figure S2. (E–H) Biophysical analyses of the U3-G4FS. The oligonucleotide was dissolved at a concentration of 5–10 μM in a buffer containing 70 mM KCl and 10 mM potassium phosphate at pH 7. (E) Circular dichroism profiles of full-length dU3 (blue) and full-length rU3 (pink). (F) Circular dichroism profiles of truncated dU3 and truncated rU3. (G) UV melting profiles of full-length dU3 and full-length rU3. (H) UV melting profiles of truncated dU3 and truncated rU3.
Figure 3.
Figure 3.
Interaction of porphyrin-based G4 binders with viral DNA and RNA G4 structures. (A) Chemical structures of the non-metalated and gold(III) porphyrin metallo-complexes studied here. The first generation porphyrin TMPyP4 is called here H2T (presence of two protons without gold(III)), which can be directly compared to the gold(III) metallo complex AuTMPyP4 called here AuT (two protons are replaced by gold(III)). (B–F) FRET melting assay. The DNA oligonucleotides were labeled with fluorophores (TAMRA and fluorescein) at either end and dissolved at a concentration of 0.2 μM in 10 mM KCl, 90 mM LiCl, and 10 mM lithium cacodylate at pH 7.2. Thermal denaturation experiments were performed by heating and recording the fluorescence emission of the fluorescein. Ligands were added at a concentration of 0.5 μM. As a first approximation, the higher the increase in T1/2, the higher the affinity of the ligand for the target. (B–D) dU3-1-ft melting profiles were recorded in absence of ligand (pink triangles) or in the presence of 0.5 μM porphyrin. Competition experiments were performed in the presence of a competitor duplex (Table S1) at 10 μM (grey squares and violet circles). (E, F) Summary of the stabilization induced by the ligands on dU3-2 (dark blue), dU3-1 (red), and dU3-3 (cyan) quadruplexes in the (E) absence or (F) presence of 10 μM ds26 (Table S1b). (G–I) Ligand-induced fluorescence quenching assay evaluated the binding of the porphyrin ligands to rU3-1Cy5, which induces the quenching of the fluorescence of Cy5 dye. Conditions: 10 mM KCl, 90 mM LiCl, 10 mM Li-cacodylate pH 7.2 and 10 nM of rU3-1Cy5. (G) Saturation binding curves for the 5′ quartet of the 5′rU3-1Cy5 G4. (H) Saturation binding curves for the 3′ quartet of the 3′rU3-1Cy5 G4. The curves fitting allow the determination of Kd. (I) Histogram representation of the Kd values measured for porphyrin binding to the 5′ and 3′ end G quartets.
Figure 4.
Figure 4.
Analyses of effects of G4 binders on HIV-1 infectivity. (A) Dose effect of the G4 binders on HIV-1 infectivity in the presence of indicated porphyrins. Infection was performed with native HIVLai. The G4 ligands were added to the cells at the time of infection. β-Galactosidase activity was measured to evaluate the viral infectivity. Data are the results of at least three independent experiments each performed in duplicate. (B) Correlation between HIV-1 inhibition (IC50) of each G4 binder and stabilization of DNA G4 conformations dU3-1ft (parallel), dU3-3ft (hybrid), and dU3-2ft (antiparallel) (ΔTm, in°C). The best fit was obtaining using an exponential equation (AuT and H2T (TMPyP4)) were excluded from the fit). (C) Correlation between HIV-1 inhibition (IC50) and Kd measured for the RNA rU3-1-cy5. The best fit was obtained using a linear equation (AuT and H2T were excluded from the fit). (D, E) Dose and incubation time effect of the G4 binders on HIV-1 infectivity in the presence of AuMA (D) or AuPG (E). Ligands were added two hours before infection (2 h B.I blue line) with a ligand washing step before infection; or at the time of infection (0 red line); or after infection (post-infection): half hour (dotted blue line), 1 h (violet line), 2 h (yellow line) or twenty four hours (green dotted line).
Figure 5.
Figure 5.
Determination of HIV-1 replication step inhibited by the G4 ligands. (A) Scheme of HIV-1 replication cycle highlighting the steps for viral nucleic acids extraction. (B) Quantification of viral RNA performed by RT-qPCR 2 h post infection in the absence of drug (red bar) and in the presence of 2 μM AuPG or 2 μM AuMA. (C and D) Quantification of viral DNA (C) 6 h and (D) 24 h post infection. Experiments were performed in the presence of 2 μM of G4 ligands or AZT at 10 μM concentration. Data are the results of at least three independent experiments each performed in duplicate.
Figure 6.
Figure 6.
Effect of the G4 ligands on reverse transcription. (A) Scheme of the RT process. Viral DNA is in cyan, viral RNA is in red and tRNALys is in purple. The red arrows indicate positions of the pairs of primers used for PCR amplification of (a) strong-stop cDNA, (b) first jump cDNA, and (c) second jump cDNA. The G4FSs are indicated by numbers. The steps of the reverse transcription process are as follows: (1) The tRNA primer base pairs to the primer-binding site (PBS). (2) The reverse transcriptase initiates minus-strand DNA synthesis creating an RNA/DNA duplex on the U5-R region. RNase H degrades the RNA resulting in the strong-stop cDNA. (3) Via pairing with the R sequence of the strong-stop cDNA, the minus-strand DNA is translocated to the 3′ end of the viral RNA; this is the first jump cDNA. (4) The minus-strand DNA synthesis resumes. RNase H degrades the RNA that has been copied with exceptions of the PPT and cPPT sequences that are resistant to RNase H. (5) The PPTs serve as primers for plus-strand DNA synthesis. (6) The U3, R, U5 and PBS sequences of the plus DNA strand are synthesized. (7) After the removal of the tRNA primer, the PBS of the minus-strand DNA is translocated to the 5′ end of the minus-strand DNA. The plus-strand DNA synthesis resumes, and both the plus and minus-strand DNAs are then elongated. This leads to the second jump cDNA. (8) The plus strand synthesis initiated at the U3 junction displaces the segment of the plus-strand that was initiated from the cPPT, creating the central flap. (B–E) Detection and quantification of viral DNAs. Virus indicates DNA from cells infected with virus in the absence of drug; AuPG and AuMA indicate DNA from infected cells treated with 2 μM porphyrin; cells indicates DNA from uninfected cells; and the line indicates no DNA. (B) Gel separation of products of amplification with primers to strong-stop cDNA. (C) Gel separation of products of amplification with primers to first jump DNA. (D) Gel separation of products of amplification with primers to second jump cDNA. (E) Taqman amplification with primers to strong-stop cDNA. Percent strong-stop cDNA relative to virus-infected cells. (F) Mechanism of action of the porphyrin G4-binders during HIV-1 viral cycle. The main steps from the virus-cell fusion (top) to the assembly of new viruses (bottom) are represented. Viral RNA is colored in red and viral DNA is colored in cyan. The G4-binder is represented in blue. The G4 binders act during the two first hours after cell entry and prevent reverse transcription of viral RNA.
Figure 7.
Figure 7.
G4 RNA pull-down. (A) AuMA-biotin G4 probe. (B) G4 RNA pull-down strategy: 1) after 2 h infection, cells were fixed, cross-linked and lysed by sonication; 2) overnight incubation with AuMA or AuMA-biotin; 3) 2 h incubation with Streptavidin beads; 4) washing, reverse cross-linking and RNA extraction; 5) RNAs amplification and quantification by RT-qPCR. (C) Analysis of PCR products. Pull down and amplification of viral RNA was performed using primers described in Table S3. Lane 1: 25 bp DNA step ladder. Lanes 2−13: 10 μl of RT-qPCR products were injected on a 2% agarose gel stained with SYBR safe. For each G4FS are shown the incubation products for AuMA-biotin (left) and AuMA (right); a cell negative control is provided in figure S27. (D) Relative PCR products enrichment for 6 G4FS and a non-G4 control. The ΔCt values for each condition were obtained by substracting the Ct value of the input by the Ct value of AuMA−biotin or AuMA (Table S3). We considered that a ΔCt value of 3.32 results from a 10-time enrichment of the sequence. ( = ) The actual value for non-G4/AuMA is 0.001.

References

    1. Patel D.J., Phan A.T., Kuryavyi V.. Human telomere, oncogenic promoter and 5′-UTR G-quadruplexes: diverse higher order DNA and RNA targets for cancer therapeutics. Nucleic Acids Res. 2007; 35:7429–7455. - PMC - PubMed
    1. Guédin A., Alberti P., Mergny J.-L.. Stability of intramolecular quadruplexes: sequence effects in the central loop. Nucleic Acids Res. 2009; 37:5559–5567. - PMC - PubMed
    1. Varshney D., Spiegel J., Zyner K., Tannahill D., Balasubramanian S.. The regulation and functions of DNA and RNA G-quadruplexes. Nat. Rev. Mol. Cell Biol. 2020; 21:459–474. - PMC - PubMed
    1. Marquevielle J., De Rache A., Vialet B., Morvan E., Mergny J.-L., Amrane S.. G-quadruplex structure of the C. elegans telomeric repeat: a two tetrads basket type conformation stabilized by a non-canonical C-T base-pair. Nucleic Acids Res. 2022; 50:7134–7146. - PMC - PubMed
    1. Paeschke K., Simonsson T., Postberg J., Rhodes D., Lipps H.J.. Telomere end-binding proteins control the formation of G-quadruplex DNA structures in vivo. Nat. Struct. Mol. Biol. 2005; 12:847–854. - PubMed

Publication types