. 2023 Feb;46(1):93-115.
doi: 10.1007/s13402-022-00738-w. Epub 2022 Dec 1.

AKT-driven epithelial-mesenchymal transition is affected by copper bioavailability in HER2 negative breast cancer cells via a LOXL2-independent mechanism

Affiliations

AKT-driven epithelial-mesenchymal transition is affected by copper bioavailability in HER2 negative breast cancer cells via a LOXL2-independent mechanism

Alessandra Vitaliti et al. Cell Oncol (Dordr). 2023 Feb.

Abstract

Background: The main mechanism underlying cancer dissemination is the epithelial to mesenchymal transition (EMT). This process is orchestrated by cytokines like TGFβ, involving "non-canonical" AKT- or STAT3-driven pathways. Recently, the alteration of copper homeostasis seems involved in the onset and progression of cancer.

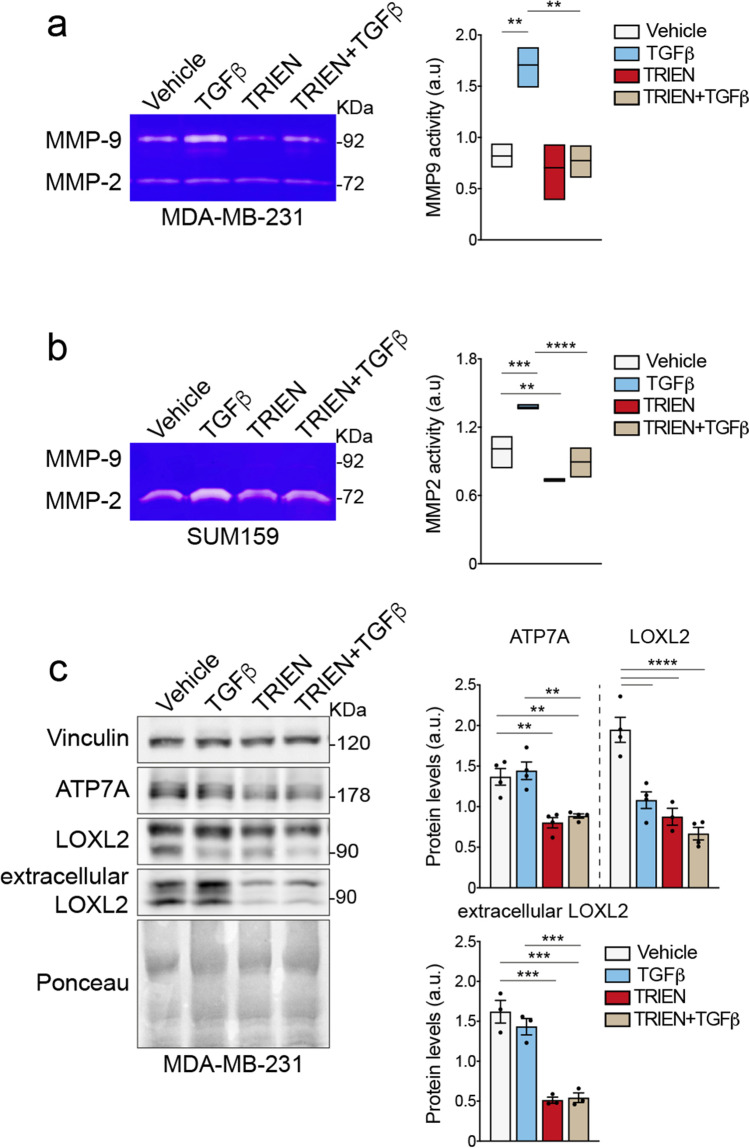
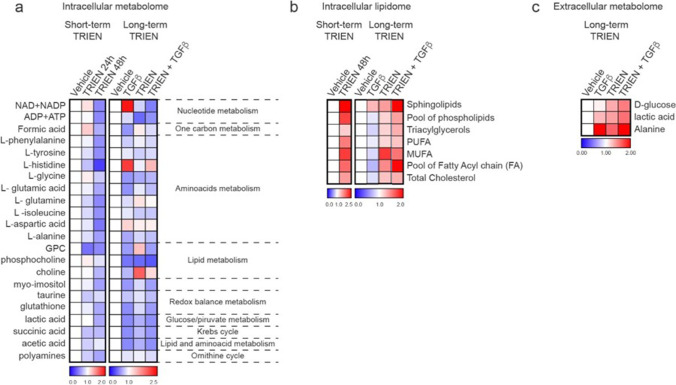
Methods: We expose different breast cancer cell lines, including two triple negative (TNBC) ones, an HER2 enriched and one cell line representative of the Luminal A molecular subtype, to short- or long-term copper-chelation by triethylenetetramine (TRIEN). We analyse changes in the expression of EMT markers (E-cadherin, fibronectin, vimentin and αSMA), in the levels and activity of extracellular matrix components (LOXL2, fibronectin and MMP2/9) and of copper homeostasis markers by Western blot analyses, immunofluorescence, enzyme activity assays and RT-qPCR. Boyden Chamber and wound healing assays revealed the impact of copper chelation on cell migration. Additionally, we explored whether perturbation of copper homeostasis affects EMT prompted by TGFβ. Metabolomic and lipidomic analyses were applied to search the effects of copper chelation on the metabolism of breast cancer cells. Finally, bioinformatics analysis of data on breast cancer patients obtained from different databases was employed to correlate changes in kinases and copper markers with patients' survival.

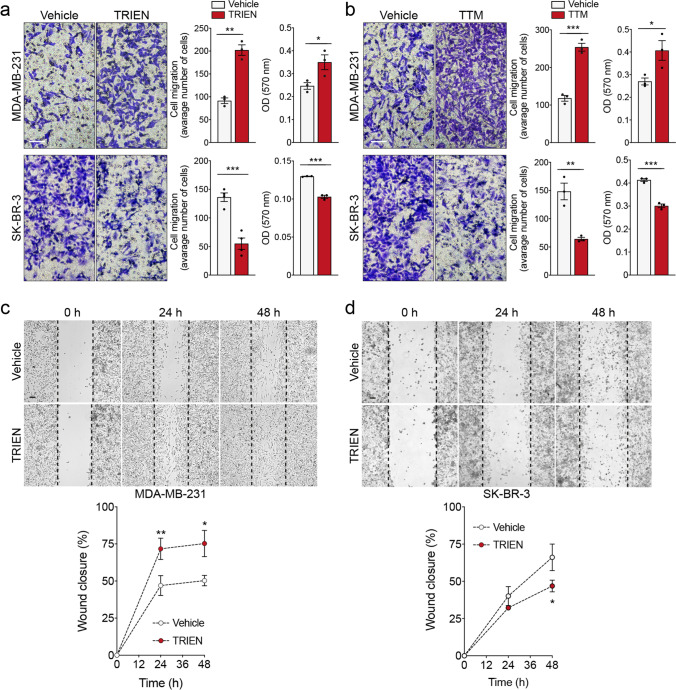
Results: Remarkably, only HER2 negative breast cancer cells differently responded to short- or long-term exposure to TRIEN, initially becoming more aggressive but, upon prolonged exposure, retrieving epithelial features, reducing their invasiveness. This phenomenon may be related to the different impact of the short and prolonged activation of the AKT kinase and to the repression of STAT3 signalling. Bioinformatics analyses confirmed the positive correlation of breast cancer patients' survival with AKT activation and up-regulation of CCS. Eventually, metabolomics studies demonstrate a prevalence of glycolysis over mitochondrial energetic metabolism and of lipidome changes in TNBC cells upon TRIEN treatment.

Conclusions: We provide evidence of a pivotal role of copper in AKT-driven EMT activation, acting independently of HER2 in TNBC cells and via a profound change in their metabolism. Our results support the use of copper-chelators as an adjuvant therapeutic strategy for TNBC.

Keywords: AKT; Breast cancer; Copper; Epithelial to mesenchymal transition; HER2; LOXL2; TGFβ; TRIEN.


Conflict of interest statement

The authors declare no competing interests.

Figures

Fig. 1
Fig. 1
Basal levels of cuproproteins in different breast cancer cell lines and their modulation following TRIEN treatment. Cell extracts obtained from MDA-MB-231, SUM159, T47D and SK-BR-3 were applied to SDS–PAGE followed by Western blot with monoclonal antibodies for the detection of basal levels of (a) ATP7A, LOXL2, CCS and of the subunit II of cytochrome c oxidase. The level of CCS and the of the subunit II of cytochrome c oxidase, was measured by Western blot (left panels; correspondent densitometric analysis in the right panels), following 24 or 48 h of 125 µM TRIEN treatment in (b) MDA-MB-231, (c) SUM159, (d) T47D, and (e) SK-BR-3 cells. Twenty micrograms of proteins were loaded on each lane. Vinculin was used as loading control. One representative blot is shown for each antigen out of at least three independent experiments. (f, upper panel). SOD1 activity was assessed in the different cell lines lysates using an in-gel assay, under non-denaturing, SDS-free conditions, after 48 h of treatment with 125 µM TRIEN; fifty micrograms of proteins were applied to each lane. One representative SOD1 activity assay is shown out of at least three different experiments; (f, lower panel) densitometric analysis of the activity assay. Data are presented as a mean ± SEM. Student's t-test *p < 0.05, **p < 0.01 with respect to the untreated cells only
Fig. 2
Fig. 2
Cu bioavailability modulates the level of the epithelial to mesenchymal transition hallmarks. The basal levels of fibronectin, E-cadherin, αSMA and vimentin were measured in cell extracts from (a) MDA-MB-231, SUM159, T47D and following 24 h exposure to 125 µM TRIEN for (b) MDA-MB-231, (c) SUM159, (d) T47D and 48 h after TRIEN treatment for (e) SK-BR-3. Twenty micrograms of proteins were loaded on each lane. Vinculin or actin were used as loading controls. (f) Immunofluorescence detection of E-cadherin in MDA-MB-231, SUM159, T47D 24 h after TRIEN exposure and SK-BR-3 cells 48 h after treatment with 125 µM TRIEN (upper panels) and its corresponding signal analysis (lower panels). (g) Fibronectin immunofluorescence of T47D and SUM159 (left panels) and its corresponding signal analysis (right panels). (h) αSMA immunofluorescence in MDA-MB-231 and SK-BR-3 (left panels) and its corresponding signal analysis (right panels). Phalloidin was used to label F-actin whilst nuclei were labeled with DAPI. Calibration bars corresponds to 100 μm in the immunofluorescence images; 40 × magnification. One representative blot/image and the corresponding signal analysis is shown for each antigen, out of at least three independent experiments. Student's t-test *p < 0.05, **p < 0.01 and ***p < 0.001 with respect to the untreated cells only. Data are presented as a mean ± SEM
Fig. 3
Fig. 3
Decreased Cu bioavailability differently affects the migration of MDA-MB-231 and SK-BR-3 breast cancer cell lines. (a and b, upper panel) MDA-MB-231 and (a and b, lower panel) SK-BR-3 cells were assayed for in vitro migration using a Boyden chamber. After 24 h of exposure to (a) 125 µM TRIEN and (b) 5 µM TTM, migrated cells per field were stained with crystal violet and counted. One representative phase contrast image (20 × magnification) is shown, out of at least three independent experiments. Student's t-test *p < 0.05, **p <0.01, ***p < 0.001 with respect to the untreated cells only. Data are presented as a mean ± SEM. Wound-healing assay in (c) MDA-MB-231 and (d) SK-BR-3 cells treated with TRIEN for up to 48 h. A single scratch was made in the center of the cell monolayer and the wound closure areas visualized under an inverted microscope with 20 × magnification (upper panel). Cell motility was quantified by measuring the distance between the invading front of cells in at least 5 random selected microscopic fields for each single condition and time point (lower panel). Data are presented as a mean ± SEM (n ≥ 3, ***p < 0.001, Two-Way ANOVA). Calibration bars 100 μm in transwell migration (a and b) and wound healing assay (c and d)
Fig. 4
Fig. 4
Cu chelation modulates the activation of the AKT/GSK3β/SNAIL axis. (a, left panel) Western Blot of phosphorylated AKT at Ser473 (pAKT Ser473), total AKT (AKT), phosphorylated ERK1/2 (pERK1/2) and total ERK 1/2 (ERK1/2) in MDA-MB-231, SUM159, T47D and SK-BR-3 following 24 h exposure to 125 µM TRIEN for MDA-MB-231, SUM159, T47D and 48 h after TRIEN treatment for SK-BR-3. (a, right panel) densitometric analysis of phosphorylated AKT at Ser473 residue (pAKTSer473)/total AKT. (b, left panel) Western blot and (b, right panel) densitometric analysis of pAKT at Thr308 (pAKT Thr308) and total AKT (AKT) in MDA-MB-231; (c, left panel) Western blot and (c, right panel) densitometric analysis of phosphorylated GSK3β at Ser9 (pGSK3β Ser9) and SNAI1 in MDA-MB-231and (d) SK-BR-3 cells. Twenty micrograms of proteins were loaded on each lane. Vinculin was used as loading control. One representative blot is shown for each antigen, data are presented as a mean ± SEM (n ≥ 3, Student's t-test *p < 0.05; **p < 0.01 ***p < 0.001). (e) The level of the EMT-TFs SNAI1, TWIST1, SNAI2 and ZEB1 transcripts in MDA-MB-231 cells were evaluated by qPCR analysis following 24 h exposure to 125 µM TRIEN. Results were expressed with respect to the control (vehicle), defined as 1. Data were reported as mean ± SEM of three independent measurements (*p < 0.05, **p < 0.01 vs vehicle)
Fig. 5
Fig. 5
Effects of prolonged TRIEN exposure and TGFβ treatment on EMT markers and breast cancer cells phenotype. Western blot (upper panels) and densitometric analysis (lower panels) of fibronectin and αSMA in (a) MDA-MB-231, (b) SK-BR-3 and (c) SUM159 following 10 ng/ml TGFβ (24 h) and/or 125 µM TRIEN (6 days in total) treatment. 20 µg of proteins were applied to each lane. Vinculin was used as loading control. (d) Immunofluorescence images of E-cadherin in MDA-MB-231, SK-BR-3 and SUM159 cells (d, left panels) and their corresponding signal analysis (d, right panels). Calibration bar: 100 μm. 40 × magnification. (e) Western blot (e, left panel) and densitometric analysis (e, right panels) of phosphorylated AKT at Ser473 (pAKT), total AKT (AKT), phosphorylated ERK1/2 (pERK1/2) and total ERK 1/2 (ERK1/2), phosphorylated SMAD2 (pSMAD2), total SMAD2 (SMAD2), phosphorylated SMAD3 (pSMAD3), total SMAD3 (SMAD3) and phosphorylated STAT3 (pSTAT3) in MDA-MB-231. Vinculin was used as loading control. One representative blot/image is shown for each antigen, data are presented as a mean ± SEM (n ≥ 3, One-way ANOVA, *p < 0.05; **p < 0.01 ***p < 0.001, ****p < 0.0001)
Fig. 6
Fig. 6
Prolonged TRIEN exposure impairs the activities of MMPs and the level of LOXL2, even in the presence of TGFβ. (a, left panel) Gelatin zymography assay performed in the cell media of MDA-MB-231 and (b, left panel) SUM159 showing the activity of MMP2 and MMP9 upon treatment with TGFβ (24 h) or 125 µM TRIEN (6 days), alone and in combination, and their densitometric analyses (right panels). 40 μl of media was applied to each line. (c, left panel) Western blot and (c, right panels) densitometric analysis of ATP7A, LOXL2, and extracellular LOXL2 in MDA-MB-231, following 10 ng/ml TGFβ (24 h) or 125 µM TRIEN (6 days) treatment, alone and in combination. 40 µg of proteins or 25 µl were loaded on each lane. Vinculin was used as loading control; Ponceau S staining was used as loading control for the extracellular LOXL2. One representative image/blot is shown for each gelatin zymography assay/antigen, data are presented as a mean ± SEM (n ≥ 3, One-way ANOVA, **p<0.01, ***p<0.001, ****p<0.0001
Fig. 7
Fig. 7
Effects of TRIEN and TGFβ treatment on the metabolic pathways of MDA-MB-231 cells. (a) NMR analysis of the intracellular aqueous metabolites and (b) intracellular lipidome in MDA-MB-231 following up to 48 h 125 µM TRIEN treatment (left panel) and following cells treatment for 24 h with 10 ng/ml TGFβ, alone or added to TRIEN-pretreated TNBC cells (right panel). (c) NMR analysis of the extracellular metabolome of MDA-MB-231 cells correlated to the glucose/pyruvate metabolism, following cells treatment with 10 ng/ml TGFβ for 24 h, alone or added to 125 µM TRIEN-pretreated cells. Metabolomic data are presented as heat maps of fold change, the metabolites level of the untreated control is referred as 1
Fig. 8
Fig. 8
Database analysis correlates mRNA expression profile of AKT and CCS in TNBC patients to their survival. (a) AKT and (b) CCS mRNAs expression across various classes of breast cancer were retrieved from the Gene Expression Database of Normal and Tumor Tissues 2 (GENT2). Statistical significance was determined by one-way ANOVA. Kaplan–Meier overall survival (OS) plots comparing breast cancer patients with high and low mRNA levels of (c) AKT and (d) CCS obtained from GENT2. The survival between high- and low-mRNA levels cohorts was compared using log-rank tests. (e) Kaplan–Meier Progression Free Survival (PFI) plot comparing breast cancer patients with high and low level of phosphorylated AKT at Ser473 (AKT_pS473) recovered from The Cancer Proteome Atlas (TCPA) using the TCGA breast invasive carcinoma cohort (BRCA). (f) Relapse Free Survival (RFS) plot comparing breast cancer patients with high and low level of CCS mRNA levels retrieved from the Kaplan Meier Plotter (KMPLOT) database. The survival between high and low levels cohorts was compared using log-rank test
Fig. 9
Fig. 9
Graphical representation of the hypothetical mechanisms proposed for the regulation by copper of proteins/kinases involved in Her2 negative and Her2-overexpressing breast cancer cells aggressiveness

Similar articles

Cited by

References

    1. Zubair M, Wang S, Ali N. Advanced Approaches to Breast Cancer Classification and Diagnosis. Front. Pharmacol. 2020;11:632079. doi: 10.3389/fphar.2020.632079. - DOI - PMC - PubMed
    1. A. De Luca, A. Barile, M. Arciello, L. Rossi, Copper Homeostasis as Target of Both Consolidated and Innovative Strategies of Anti-Tumor Therapy. J. Trace Elem. Med. Biol. 55 (2019). 10.1016/j.jtemb.2019.06.008 - PubMed
    1. C.Y. Loh, J.Y. Chai, T.F. Tang, W.F. Wong, G. Sethi, M.K. Shanmugam, P.P. Chong, C.Y. Looi, The E-Cadherin and N-Cadherin Switch in Epithelial-to-Mesenchymal Transition: Signaling, Therapeutic Implications, and Challenges. Cells. 8 (2019). 10.3390/cells8101118 - PMC - PubMed
    1. Dongre A, Weinberg RA. New Insights into the Mechanisms of Epithelial-Mesenchymal Transition and Implications for Cancer. Nat. Rev. Mol. Cell Biol. 2019;20:69–84. doi: 10.1038/s41580-018-0080-4. - DOI - PubMed
    1. Deshmukh AP, Vasaikar SV, Tomczak K, Tripathi S, Den Hollander P, Arslan E, Chakraborty P, Soundararajan R, Jolly MK, Rai K, et al. Identification of EMT Signaling Cross-Talk and Gene Regulatory Networks by Single-Cell RNA Sequencing. Proc. Natl. Acad. Sci. U. S. A. 2021;118:2102050118. doi: 10.1073/pnas.2102050118. - DOI - PMC - PubMed

MeSH terms