. 2022 Dec 1;11(12):1.
doi: 10.1167/tvst.11.12.1.

Comparing Acute IOP-Induced Lamina Cribrosa Deformations Premortem and Postmortem

Affiliations

Comparing Acute IOP-Induced Lamina Cribrosa Deformations Premortem and Postmortem

Junchao Wei et al. Transl Vis Sci Technol. .

Abstract

Purpose: Lamina cribrosa (LC) deformations caused by elevated intraocular pressure (IOP) are believed to contribute to glaucomatous neuropathy and have therefore been extensively studied, in many conditions, from in vivo to ex vivo. We compare acute IOP-induced global and local LC deformations immediately before (premortem) and after (postmortem) sacrifice by exsanguination.

Methods: The optic nerve heads of three healthy monkeys 12 to 15 years old were imaged with spectral-domain optical coherence tomography under controlled IOP premortem and postmortem. Volume scans were acquired at baseline IOP (8-10 mm Hg) and at 15, 30, and 40 mm Hg IOP. A digital volume correlation technique was used to determine the IOP-induced three-dimensional LC deformations (strains) in regions visible premortem and postmortem.

Results: Both conditions exhibited similar nonlinear relationships between IOP increases and LC deformations. Median effective and shear strains were, on average, over all eyes and pressures, smaller postmortem than premortem, by 14% and 11%, respectively (P's < 0.001). Locally, however, the differences in LC deformation between conditions were variable. Some regions were subjected premortem to triple the strains observed postmortem, and others suffered smaller deformations premortem than postmortem.

Conclusions: Increasing IOP acutely caused nonlinear LC deformations with an overall smaller effect postmortem than premortem. Locally, deformations premortem and postmortem were sometimes substantially different. We suggest that the differences may be due to weakened mechanical support from the unpressurized central retinal vessels postmortem.

Translational relevance: Additional to the important premortem information, comparison with postmortem provides a unique context essential to understand the translational relevance of all postmortem biomechanics literature.


Conflict of interest statement

Disclosure: J. Wei, was at the University of Pittsburgh when he contributed to this work; Y. Hua, None; B. Yang, None; B. Wang, None; S.E. Schmitt, None; B. Wang, None; K.A. Lucy, None; H. Ishikawa, None; J.S. Schuman, Zeiss (F), Carl Zeiss Meditec (C), Opticient (C); M.A. Smith, None; G. Wollstein, None; I.A. Sigal, None

Figures

Figure 1.
Figure 1.
(a) Experimental setup modified from Tran et al. (b) Elevations of IOP in the premortem and postmortem conditions. Baseline IOP was set to 8 mm Hg for M1 and M3 and 10 mm Hg for M2. IOP was then raised stepwise from the baseline to 15, 30, and 40 mm Hg, with each pressure step lasting about 15 minutes: 5-minute “wait” after an IOP elevation and about 10 minutes for the scanning. For M1 and M3, we varied IOP in one eye premortem and the contralateral one postmortem. For M2, we varied IOP in the same eye premortem and postmortem. There was an interval of 25 minutes between the premortem and postmortem conditions. In both conditions, the OCT scans were first acquired at baseline IOP and then at elevated IOPs.
Figure 2.
Figure 2.
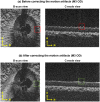
A comparison of OCT scans (a) before and (b) after the correction of motion artifacts. To remove the motion artifacts in OCT scans (red dotted boxes), we first registered the scans sequentially based on the optic nerve head structures and then corrected the artifacts using a causal low-pass filter during the registration. Panel (b) shows the efficiency of our method to remove the motion artifacts (green dotted boxes). A, anterior; N, nasal; S, superior.
Figure 3.
Figure 3.
A comparison of OCT scans (a) before and (b) after denoising. We applied a 3D median filter on the OCT volume scans for noise reduction. A nonlinear sigmoid transfer function was then used to further improve the image contrast. Our method was efficient in reducing the speckle-like noise in OCT scans. After denoising, the LC trabecular beams and pores (closeups) were more visible than those before denoising. N, nasal; S, superior.
Figure 4.
Figure 4.
Demonstration of shadow masking. (a) C-mode view of the LC at baseline IOP in the premortem condition. The outline of blood vessel shadows was manually delineated and used to identify the region for comparison. (b) C-mode view of the LC at baseline IOP in the postmortem condition. (c) The same scan in the postmortem condition masked using the outline from the scan in the premortem condition. N, nasal; S, superior.
Figure 5.
Figure 5.
Demonstration of the 3D image registration technique in the premortem (left) and postmortem (right) conditions. Shown are OCT C-mode view acquired at IOPs of 10 mm Hg (red) and 30 mm Hg (green) to visualize the differences and overlap (yellow). The differences before registration cannot be removed by simple translation or rotation. The 3D registration produced excellent coincidence between the images, without concentrations. The largest differences were due to noise and intensity variations that result in slightly greenish or reddish regions despite the coincidence of the LC features. N, nasal; S, superior.
Figure 6.
Figure 6.
Contour plots of the IOP-induced LC strains of monkey M1 in the premortem and postmortem conditions. Left two columns: the effective strain in the premortem and postmortem conditions; right two columns: the shear strain in the premortem and postmortem conditions. Rows 1 to 3 correspond to the three levels of IOP elevation (from low to high). The distribution of the effective strain was similar to that of the shear strain, which was highly focal and concentrated in regions as small as a few pores. IOP-induced LC strains were overall smaller postmortem than premortem, but locally, a few locations had larger strains postmortem than premortem. OS images were flipped for ease of comparison. N, nasal; S, superior.
Figure 7.
Figure 7.
Contour plots of the IOP-induced LC strains of monkey M2 in the premortem and postmortem conditions. Left two columns: the effective strain in the premortem and postmortem conditions; right two columns: the shear strain in the premortem and postmortem conditions. Rows 1 to 3 correspond to the three levels of IOP elevation (from low to high). Similar to the observations of M1 (Fig. 6), IOP-induced LC strains were overall smaller postmortem than premortem, but locally, a few locations had larger strains postmortem than premortem. Note that the color scale of these plots is different from that of Figures 6 and 8. The range was selected to help discern details of the patterns. N, nasal; S, superior.
Figure 8.
Figure 8.
Contour plots of the IOP-induced LC strains of monkey M3 in the premortem and postmortem conditions. Left two columns: the effective strain in the premortem and postmortem conditions; right two columns: the shear strain in the premortem and postmortem conditions. Rows 1 to 3 correspond to the three levels of IOP elevation (from low to high). Similar to the observations of M1 (Fig. 6), the IOP-induced LC strains were overall smaller postmortem than premortem, but locally, a few locations had larger strains postmortem than premortem. N, nasal; S, superior.
Figure 9.
Figure 9.
Contour plots of the ratio of IOP-induced LC strains between premortem and postmortem conditions (M2 OD). Left column: the effective strain; right column: the shear strain. Rows 1 to 3 correspond to the three levels of IOP elevation (from low to high). Larger strains in the premortem condition are shown in red and smaller strains in blue. Some regions were subjected premortem to triple the strains than postmortem (red). A few locations had larger strains postmortem than premortem (blue). N, nasal; S, superior.
Figure 10.
Figure 10.
Boxplots of IOP-induced LC strains in the premortem and postmortem conditions. Left column: the effective strain; right column: the shear strain. Rows 1 to 3 correspond to the strain measurements in M1 to M3. Overall, IOP-induced LC strains postmortem were smaller and less variable than premortem. On average, the effective and shear strains decreased by 14.4% and 11.0%, respectively, in the postmortem condition relative to those in the premortem condition. The largest decreases were in M3 when IOP increased from 8 to 15 mm Hg, in which the effective and shear strains decreased by 23.3% and 16.6%, respectively (P < 0.001).
Figure 11.
Figure 11.
Comparison of IOP-induced LC median strains in the premortem (dashed line) and postmortem (solid line) conditions of M1 to M3. Left: the median effective strain; right: the median shear strain. For all the three monkeys, the median effective and shear strains increased nonlinearly with IOP in both the premortem and postmortem conditions. Although the values were different, the trends were similar premortem and postmortem.
Figure 12.
Figure 12.
Schematic representation of how the central retinal vessel influences the IOP-induced LC deformations in the premortem and postmortem conditions. In this framework, in the premortem condition, the central retinal vessel acts like a tent pole to support the central region of the LC., As IOP increases, the direct effects of IOP “push” the LC posteriorly, and the indirect effects deform the sclera, expanding the canal, which in turn “pull” the LC taut from the sides. After exsanguination, even at normal IOP, the vessel collapses due to the loss of blood pressure. Without the support of vessel, the central region of the LC in the postmortem condition also moves posteriorly relative to the premortem condition. As IOP increases, further posterior displacement of the LC is limited, resulting in the decreased LC strains in the postmortem condition.
Figure 13.
Figure 13.
Comparison of the optic nerve head between premortem and postmortem conditions. Shown on the left are OCT B-scans for M2 OD acquired at IOPs of 10 mm Hg (top) and 40 mm Hg (bottom). The premortem scan is shown in red, and the postmortem scan is shown in green, with yellow representing overlap. Shown on the right are the effective and shear strains of the LC calculated by DVC between pre- and postmortem conditions. At baseline IOP (10 mm Hg), the central LC in the postmortem condition was displaced more posteriorly relative to the premortem condition. This is consistent with the DVC measurements showing larger strains in the central region of the LC (as indicated by the dashed circle). A potential explanation is that, in the premortem condition, the central retinal vessels are under hydraulic stiffening from blood pressure and thus provide support to the adjacent tissues. After exsanguination, the vessels collapse due to the loss of blood pressure, resulting in the tissues being displaced posteriorly. It is also interesting that the large displacements were accompanied by LC strains comparable to those caused by fairly large changes in IOP. As IOP increases to 40 mm Hg (bottom), further posterior displacement of the LC is limited in the postmortem condition, resulting in smaller LC strains postmortem than premortem. A, anterior; N, nasal; S, superior.
Figure 14.
Figure 14.
An example of correlation coefficient map overlaid on the OCT image (M2 OD postmortem). The high correlations indicate a robust DVC analysis. Note that the correlation coefficients are discrete. We interpolated the coefficient values to generate the contour plot.

References

    1. Quigley HA. Glaucoma. Lancet. 2011; 377: 1367–1377. - PubMed
    1. Burgoyne CF. A biomechanical paradigm for axonal insult within the optic nerve head in aging and glaucoma. Exp Eye Res. 2011; 93: 120–132. - PMC - PubMed
    1. Sigal IA. Interactions between geometry and mechanical properties on the optic nerve head. Invest Ophthalmol Vis Sci. 2009; 50: 2785–2795. - PubMed
    1. Wang B, Tran H, Smith MA, et al. .. In-vivo effects of intraocular and intracranial pressures on the lamina cribrosa microstructure. PLoS One. 2017; 12: e0188302. - PMC - PubMed
    1. Quigley HA. Reappraisal of the mechanisms of glaucomatous optic nerve damage. Eye. 1987; 1: 318–322. - PubMed

Publication types