. 2023 Jan 10;8(1):e158937.
doi: 10.1172/jci.insight.158937.

Culture impact on the transcriptomic programs of primary and iPSC-derived human alveolar type 2 cells

Affiliations

Culture impact on the transcriptomic programs of primary and iPSC-derived human alveolar type 2 cells

Konstantinos-Dionysios Alysandratos et al. JCI Insight. .

Abstract

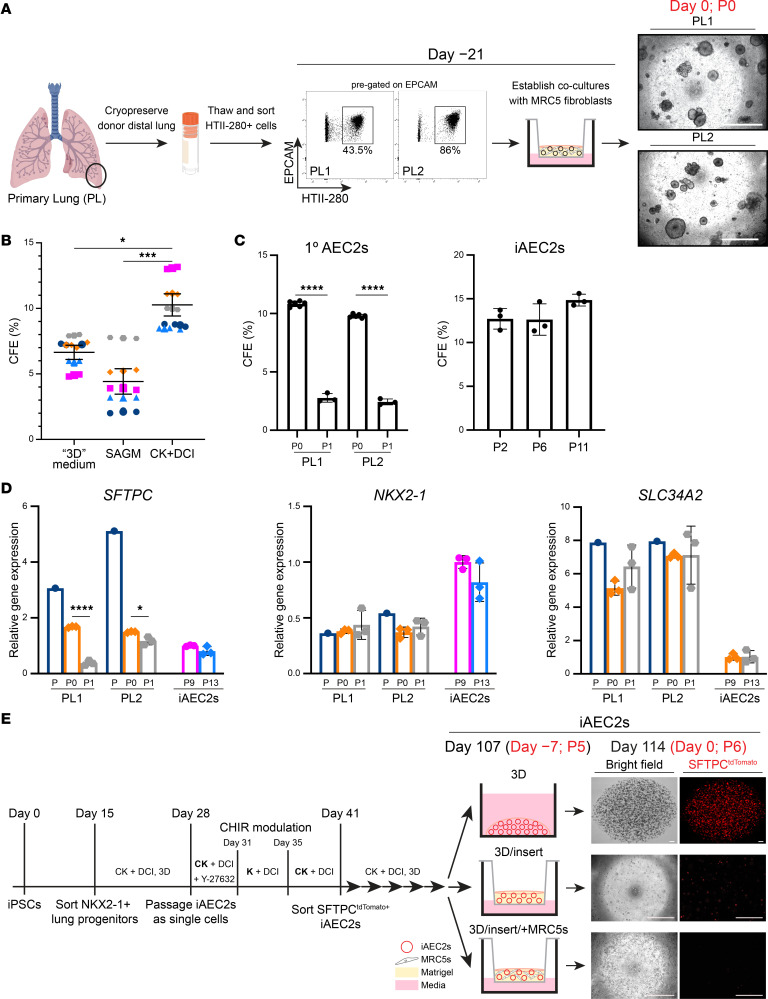
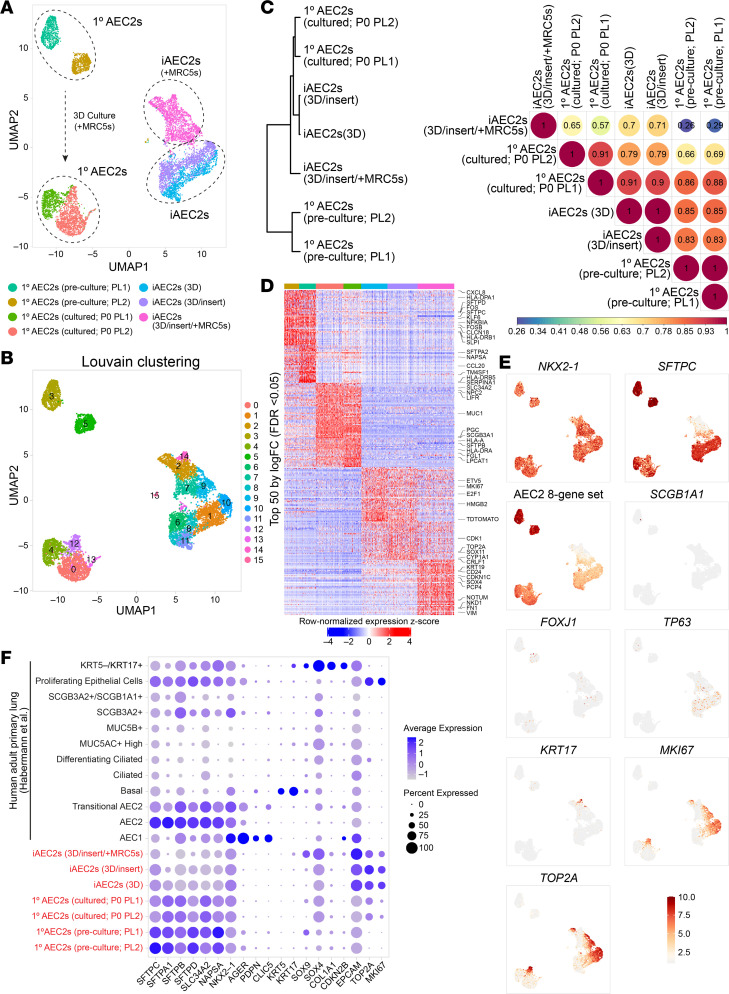
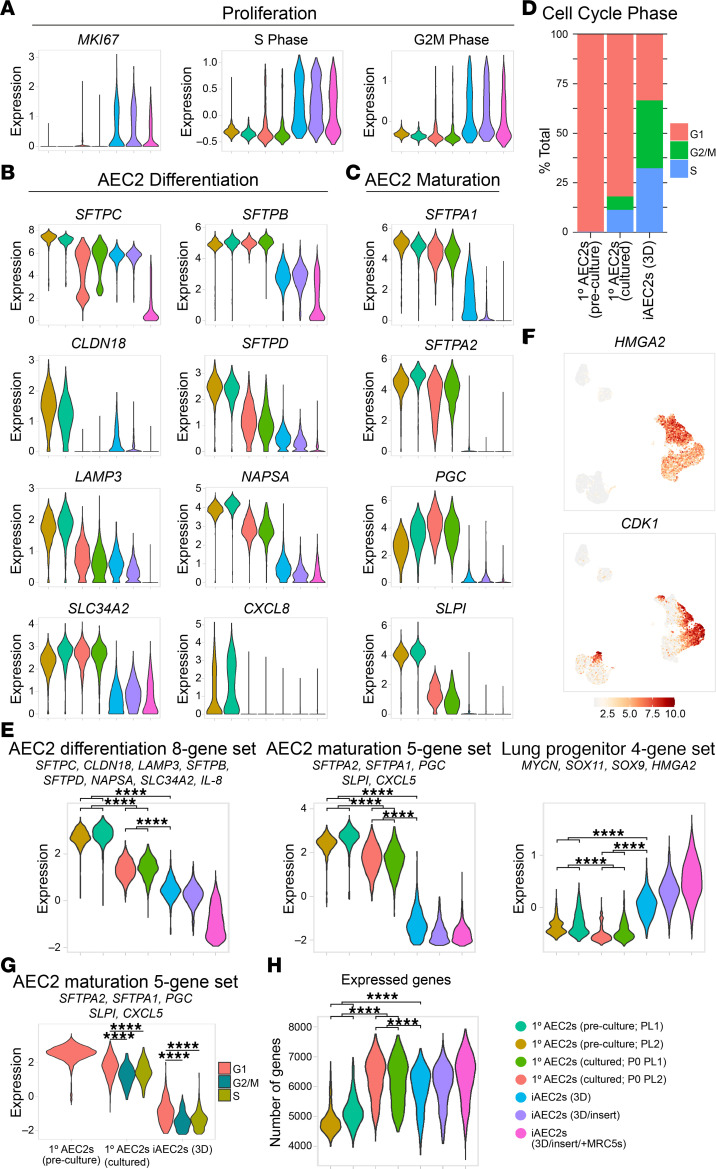
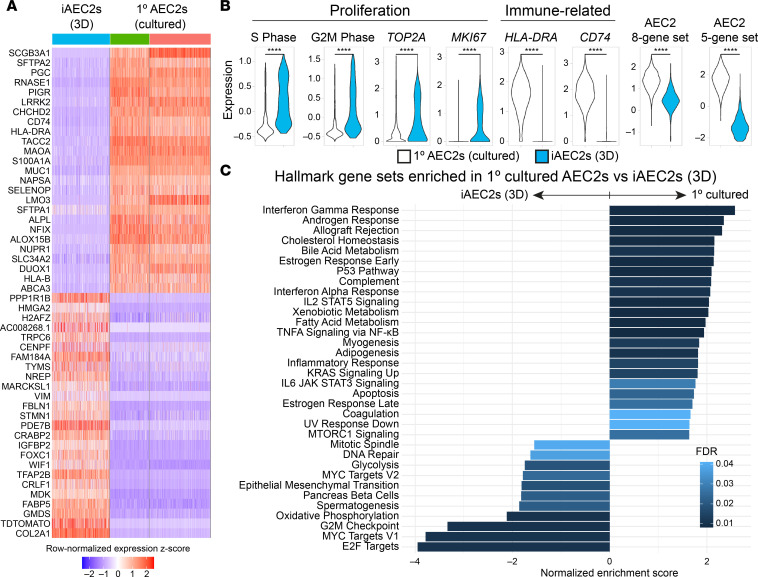
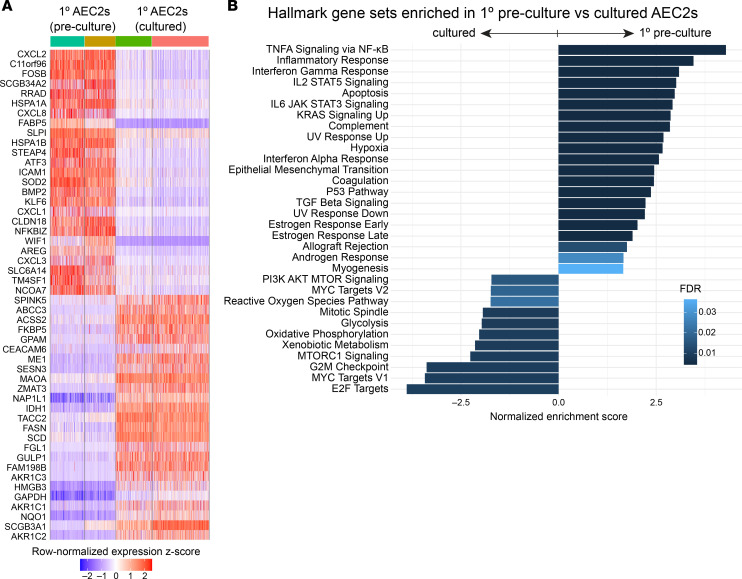
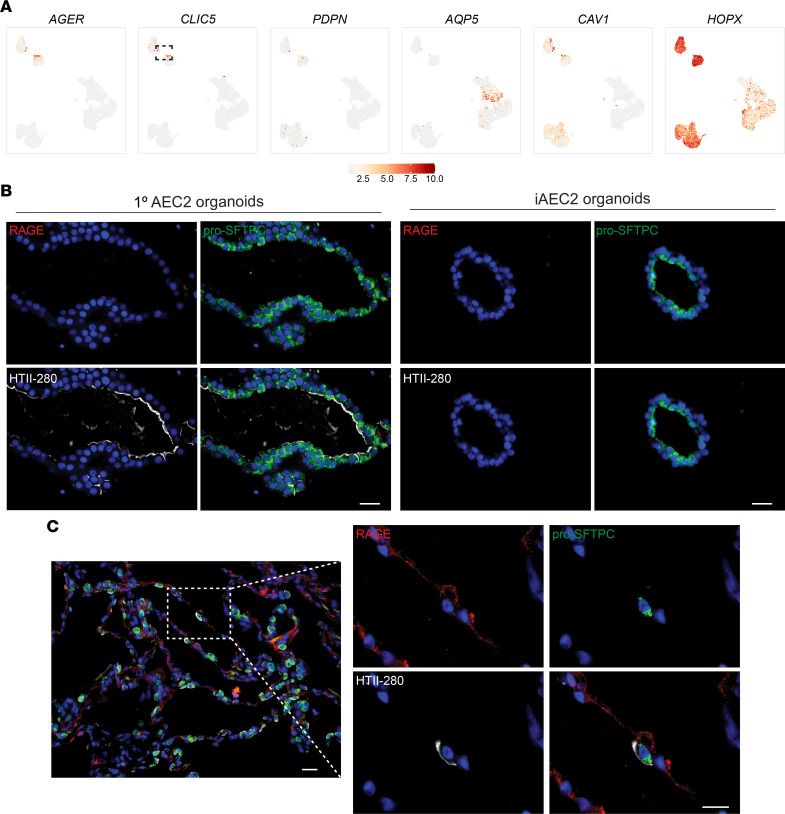
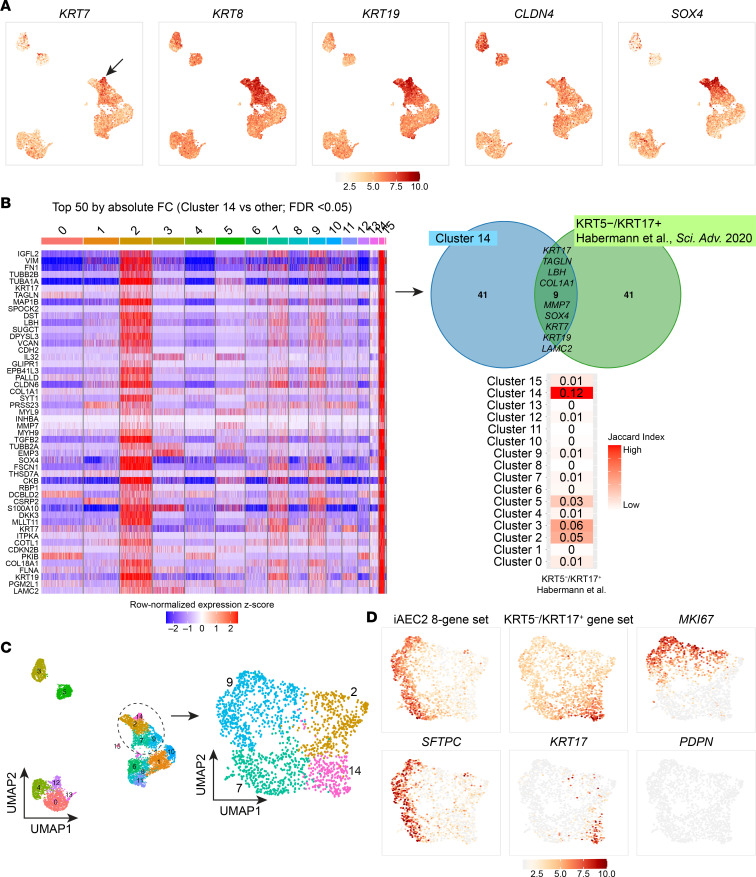
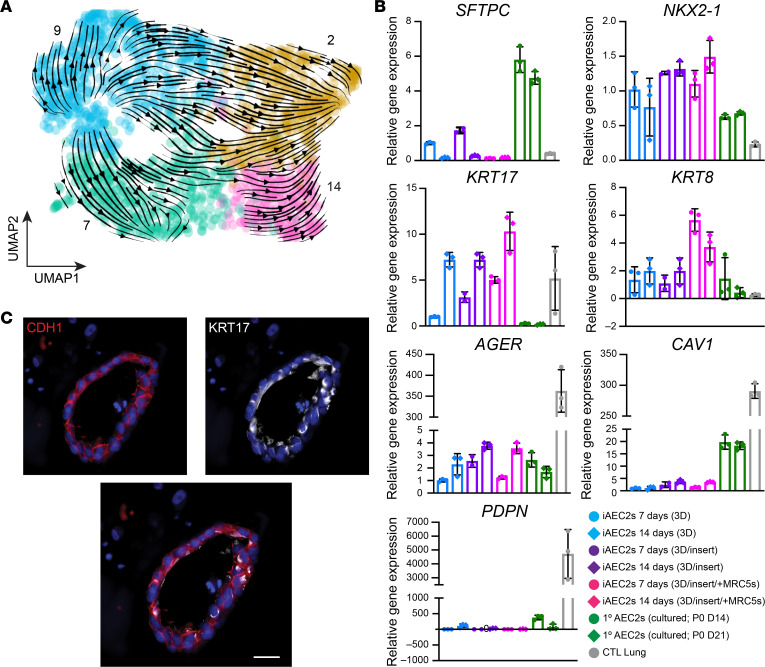
Dysfunction of alveolar epithelial type 2 cells (AEC2s), the facultative progenitors of lung alveoli, is implicated in pulmonary disease pathogenesis, highlighting the importance of human in vitro models. However, AEC2-like cells in culture have yet to be directly compared to their in vivo counterparts at single-cell resolution. Here, we performed head-to-head comparisons among the transcriptomes of primary (1°) adult human AEC2s, their cultured progeny, and human induced pluripotent stem cell-derived AEC2s (iAEC2s). We found each population occupied a distinct transcriptomic space with cultured AEC2s (1° and iAEC2s) exhibiting similarities to and differences from freshly purified 1° cells. Across each cell type, we found an inverse relationship between proliferative and maturation states, with preculture 1° AEC2s being most quiescent/mature and iAEC2s being most proliferative/least mature. Cultures of either type of human AEC2s did not generate detectable alveolar type 1 cells in these defined conditions; however, a subset of iAEC2s cocultured with fibroblasts acquired a transitional cell state described in mice and humans to arise during fibrosis or following injury. Hence, we provide direct comparisons of the transcriptomic programs of 1° and engineered AEC2s, 2 in vitro models that can be harnessed to study human lung health and disease.

Keywords: Human stem cells; Molecular biology; Pulmonology; Stem cells; iPS cells.


Figures

Figure 1
Figure 1. Establishment of synchronous 1° AEC2 and iAEC2 cultures.
(A) Schematic depicting the cryopreservation of distal lung preparations from adult donor lung explants (PL1, 2) and FACS gates used to isolate 1° AEC2s (EPCAM+HTII-280+ cells), which were combined with MRC5 fibroblasts on cell culture inserts on day –21. Representative live-cell imaging of the outgrowths on the day of encapsulation for scRNA-Seq (day 0). (B) Super plot shows the colony-forming efficiency (CFE) of 1° AEC2s in 3 media. Small shapes represent replicate values (n = 3) from each independent donor, and color-matched large shapes represent the average for each donor (n = 5). (C) Bar graphs showing CFE after the first plating in culture prior to passaging (P0), reduced CFE of passaged (P1) 1° AEC2s (n = 2 donors), and stable CFE of iAEC2s across multiple passages (n = 3 experimental replicates). No colonies were formed from P2 1° AEC2s. (D) RT-qPCR showing fold change in gene expression compared with P9 iAEC2s in P13 iAEC2s and preculture (P) and cultured (P0 and P1) 1° AEC2s from 2 donors (PL1 and PL2) (n = 3 experimental replicates). (E) Schematic of directed differentiation protocol from iPSCs to day 107 (P5) iAEC2s. Seven days prior to encapsulation for scRNA-Seq (day –7), 3D iAEC2s were dissociated and plated in 3 parallel conditions: 1) continued 3D feeder-free iAEC2 cultures, 2) 3D feeder-free cultures on cell culture inserts (3D/insert), or 3) 3D cultures on cell culture inserts with MRC5 fibroblasts (3D/insert/+MRC5s) identical to conditions for the 1° AEC2s. Representative live-cell imaging of the outgrowths on day 0. (A and E) Scale bars: 500 μm. Mean ± SEM (B) and mean ± SD (C and D) shown; *P < 0.05, ***P < 0.001, ****P < 0.0001 by 1-way ANOVA with Tukey’s correction for multiple comparisons (B) or unpaired, 2-tailed Student’s t test (C and D).
Figure 2
Figure 2. Single-cell transcriptomic profiling of 1° AEC2s and iAEC2s.
(A) Visualization of preculture 1° AEC2, cultured 1° AEC2, and iAEC2 scRNA-Seq transcriptomes using uniform manifold approximation projection (UMAP). (B) Louvain clustering of cell transcriptomes identifies 16 different clusters driven primarily by sample type or donor identity, but with subclustering within cultured cell populations suggesting the presence of cell heterogeneity in vitro. (C) Dendrogram and heatmap of Pearson’s correlation coefficients between each sample based on normalized expression of the 3,000 most variable genes across all cells. (D) Heatmap of top 50 differentially upregulated genes for each sample by scRNA-Seq (ranked by average log fold change, FDR < 0.05; row-normalized expression z scores). A subset of differentially expressed genes is highlighted with large font. (E) Normalized gene expression overlaid on UMAP plots for the indicated transcripts or gene sets. (F) Average expression levels and frequencies (purple dots) for select genes profiled by scRNA-Seq in preculture 1° AEC2s, cultured 1° AEC2s, and iAEC2s. Comparison is made to a publicly available adult 1° distal lung data set (30), and genes are selected to indicate AEC2, AEC1, airway, epithelial, or proliferation programs.
Figure 3
Figure 3. AEC2 maturation is inversely related to proliferation.
(A) Violin plots showing normalized expression for MKI67 and cell cycle phase in preculture 1° AEC2s, cultured 1° AEC2s, and iAEC2s by scRNA-Seq. (B) Violin plots showing normalized expression for individual genes from a published AEC2 differentiation gene set (36). (C) Violin plots showing normalized expression for individual genes from a published maturation gene set (36). (D) Bar plot of cell cycle phase proportions by sample. (E) Violin plots showing normalized expression for indicated gene sets in preculture 1° AEC2s, cultured 1° AEC2s, and iAEC2s by scRNA-Seq. (F) Normalized gene expression overlaid on UMAP plots for the indicated transcripts. (G) Violin plots of AEC2 maturation gene set by cell cycle phase in preculture 1° AEC2s, cultured 1° AEC2s, and iAEC2s. (H) Violin plots of expressed genes in preculture 1° AEC2s, cultured 1° AEC2s, and iAEC2s by scRNA-Seq. ****P < 0.0001 by 1-way ANOVA with Bonferroni correction for multiple comparisons for all panels.
Figure 4
Figure 4. Pairwise single-cell transcriptomic comparisons of 1° cultured AEC2s versus iAEC2s.
(A) Heatmap of top 25 downregulated and top 25 upregulated genes comparing feeder-free iAEC2s to cultured 1° AEC2s by scRNA-Seq (ranked by average log fold change, FDR < 0.05; row-normalized expression z scores). (B) Violin plots showing normalized expression for indicated genes, gene sets, or cell cycle phase in 1° cultured AEC2s versus iAEC2s by scRNA-Seq. ****P < 0.0001 by unpaired, 2-tailed Student’s t test. (C) Gene set enrichment analysis (GSEA, camera using Hallmark gene sets) of differentially regulated gene sets in cultured 1° AEC2s versus feeder-free (3D) iAEC2s (FDR < 0.05).
Figure 5
Figure 5. Pairwise single-cell transcriptomic comparisons of preculture 1° AEC2s versus cultured AEC2s.
(A) Heatmap of top 25 upregulated and top 25 downregulated genes comparing preculture 1° AEC2s to cultured 1° AEC2s by scRNA-Seq (ranked by average log fold change, FDR < 0.05; row-normalized expression z scores). (B) GSEA (camera using Hallmark gene sets) of differentially regulated gene sets in preculture 1° AEC2s versus cultured AEC2s (cultured 1° AEC2s and feeder-free iAEC2s combined; FDR < 0.05).
Figure 6
Figure 6. Absence of expression of the AEC1 molecular phenotype in cultured human AEC2s.
(A) Normalized gene expression overlaid on UMAP plots for the indicated transcripts. Dashed gate shows the few 1° AEC1s. (B) Representative immunofluorescence microscopy of 1° AEC2 and iAEC2 organoids cultured in CK+DCI medium stained for RAGE (red), pro-SFTPC (green), HTII-280 (white), and DNA (Hoechst, blue). (C) Representative immunofluorescence microscopy of control adult human lung sections stained for the same markers shown in B. (B and C) Scale bars: 25 μm.
Figure 7
Figure 7. Emergence of a transitional cell state from iAEC2s cocultured with MRC5 fibroblasts.
(A) Normalized gene expression overlaid on UMAP plots for the indicated transcripts. Arrow indicates KRT7hi cells. (B) Heatmap of top 50 differentially upregulated genes comparing cluster 14 versus other clusters by scRNA-Seq (ranked by absolute fold change, FDR < 0.05; row-normalized expression z scores). Venn diagram shows that 9 of the top 50 differentially upregulated genes in this cluster have previously been associated with a human KRT5KRT17+ transitional epithelial cell cluster (30). A row-normalized Jaccard index was calculated between clusters identified in the current study and the KRT5KRT17+ transitional epithelial cell cluster (30). (C) Louvain clustering of the sample of iAEC2s cocultured with MRC5s maintaining original cluster identity. (D) Normalized gene expression overlaid on UMAP plots for the indicated transcripts or gene sets.
Figure 8
Figure 8. Characterization and kinetics of transitional state marker gene expression.
(A) RNA velocity analysis indicates that cluster 14 cells (enriched in the KRT5KRT17+ gene set; Figure 7D) arise from iAEC2s over time. (B) RT-qPCR showing fold change in gene expression in the indicated samples compared with iAEC2s cultured in feeder-free conditions for 7 days. Control samples are an adult human distal lung explant (CTL Lung). (C) Representative immunofluorescence microscopy of iAEC2s cocultured with MRC5 fibroblasts and stained for E-cadherin/CDH1 (red), KRT17 (white), and DNA (Hoechst, blue). Scale bars: 25 μm.

References

    1. Barkauskas CE, Noble PW. Cellular mechanisms of tissue fibrosis. 7. New insights into the cellular mechanisms of pulmonary fibrosis. Am J Physiol Cell Physiol. 2014;306(11):C987–C996. doi: 10.1152/ajpcell.00321.2013. - DOI - PMC - PubMed
    1. Katzenstein AL. Pathogenesis of “fibrosis” in interstitial pneumonia: an electron microscopic study. Hum Pathol. 1985;16(10):1015–1024. doi: 10.1016/S0046-8177(85)80279-3. - DOI - PubMed
    1. Winters NI, et al. Epithelial injury and dysfunction in the pathogenesis of idiopathic pulmonary fibrosis. Am J Med Sci. 2019;357(5):374–378. doi: 10.1016/j.amjms.2019.01.010. - DOI - PMC - PubMed
    1. Selman M, Pardo A. Revealing the pathogenic and aging-related mechanisms of the enigmatic idiopathic pulmonary fibrosis. An integral model. Am J Respir Crit Care Med. 2014;189(10):1161–1172. doi: 10.1164/rccm.201312-2221PP. - DOI - PubMed
    1. Borok Z, et al. Modulation of t1alpha expression with alveolar epithelial cell phenotype in vitro. Am J Physiol. 1998;275(1):L155–L164. - PubMed

Publication types