. 2023 Feb 20;35(2):808-826.
doi: 10.1093/plcell/koac338.

The PRK/Rubisco shunt strongly influences Arabidopsis seed metabolism and oil accumulation, affecting more than carbon recycling

Affiliations

The PRK/Rubisco shunt strongly influences Arabidopsis seed metabolism and oil accumulation, affecting more than carbon recycling

Gabriel Deslandes-Hérold et al. Plant Cell. .

Abstract

The carbon efficiency of storage lipid biosynthesis from imported sucrose in green Brassicaceae seeds is proposed to be enhanced by the PRK/Rubisco shunt, in which ribulose 1,5-bisphosphate carboxylase/oxygenase (Rubisco) acts outside the context of the Calvin-Benson-Bassham cycle to recycle CO2 molecules released during fatty acid synthesis. This pathway utilizes metabolites generated by the nonoxidative steps of the pentose phosphate pathway. Photosynthesis provides energy for reactions such as the phosphorylation of ribulose 5-phosphate by phosphoribulokinase (PRK). Here, we show that loss of PRK in Arabidopsis thaliana (Arabidopsis) blocks photoautotrophic growth and is seedling-lethal. However, seeds containing prk embryos develop normally, allowing us to use genetics to assess the importance of the PRK/Rubisco shunt. Compared with nonmutant siblings, prk embryos produce one-third less lipids-a greater reduction than expected from simply blocking the proposed PRK/Rubisco shunt. However, developing prk seeds are also chlorotic and have elevated starch contents compared with their siblings, indicative of secondary effects. Overexpressing PRK did not increase embryo lipid content, but metabolite profiling suggested that Rubisco activity becomes limiting. Overall, our findings show that the PRK/Rubisco shunt is tightly integrated into the carbon metabolism of green Arabidopsis seeds, and that its manipulation affects seed glycolysis, starch metabolism, and photosynthesis.


Conflict of interest statement

Conflict of interest statement. None declared.

Figures

Figure 1
Figure 1
Mutations disrupting PRK are seedling-lethal. A, Structure of the PRK locus (AT1G32060.1), depicting untranslated regions (bold magenta lines), introns (thin black lines), and exons (blue boxes). The region encoding the transit peptide of 54 amino acid residues, as predicted by ChloroP (Emanuelsson et al. 1999), is marked with a dashed box. The locations of the T-DNA (prk-1) and transposon (prk-2) insertions are indicated by triangles. B, Seeds and 12-day-old seedlings derived from selfed heterozygous prk-1 and prk-2 mother plants in comparison to the respective wild-type accessions (Col-0 for prk-1, No-0 for prk-2). The homozygous prk seedlings are pale and do not develop beyond the cotyledon stage. Bars = 1 mm.
Figure 2
Figure 2
Hemizygous PRK-YFP expression rescues the prk growth phenotype and allows selection of homozygous prk seeds. A, Immunoblot using extracts of 10-day-old Col-0 WT and prkCOMP seedlings, showing expression of PRK-YFP and lack of endogenous PRK in the segregating population. Seedlings were sorted according to their growth phenotype (green versus pale; compare Figure 1B). Protein was loaded on an equal fresh weight basis (500 ng per lane). The upper blot displays the cumulative signal of two color channels from anti-PRK and anti-YFP antibodies, whereas actin (red signal) was used as a loading control in the lower blot, as marked on the righthand side. B, Segregating populations of green seeds harvested at different stages (DAF: days after flowering) from individual prkCOMP siliques. Seeds classified as “R” according to the fluorescence sorting are marked with magenta arrowheads. Bars = 1 mm. C, Immunoblot of Col-0 WT and sorted green prkCOMP seeds harvested 10 DAF, showing absence of endogenous PRK and presence of PRK-YFP at levels positively correlated with YFP fluorescence in complemented seeds. Protein equivalents to 0.83 seed are loaded per lane; actin (red signal) was used as a loading control, as marked on the righthand side.
Figure 3
Figure 3
PCA of primary metabolites measured in sorted green prkCOMP seeds. Biplot for principal components 1 and 2. Siliques (n = 19) were opened, the seeds therein sorted and pooled according to fluorescence (6–38 seeds per pool sample in the displayed dataset), and metabolites quantified. Small circles represent individual samples and are colored according to their assigned fluorescence class. Large circles represent group mean points and lightly shaded ellipses are concentration ellipses assuming a multivariate normal distribution, drawn to a normal probability of 68%. Metabolite variables are colored and faded according to their contribution. See Supplemental Data Set 1A for raw metabolite data.
Figure 4
Figure 4
The PRK/Rubisco shunt and changes in the involved metabolites upon loss of prk in green seeds. The upper part of the scheme shows the canonical glycolysis pathway. The lower part shows how enzymes of the nonoxidative steps of the pentose phosphate pathway (PPP), together with PRK and Rubisco acting outside the CBBC, bypass parts of glycolysis (indicated in orange) and recycle CO2 released by PDH in green Brassicaceae seeds (scheme adapted from Schwender et al., 2004). The relative changes in the mean metabolite levels in R seeds with respect to complemented YY seeds (R/YY; same underlying data as shown in Figure 3) originating from hemizygous prkCOMP mother plants are highlighted with colored boxes (log10 scale; see color legend). The value for RuBP was outside the displayed range, with a roughly 19-fold reduction. Statistically significant increases or decreases are indicated by asterisks; **P < 0.01; ***P < 0.001 represent P values from two-way ANOVA adjusted for multiple comparisons according to the Šidák method. Metabolites that were not analyzed are displayed in grey. See Supplemental Data Set 1, B and C for statistical analyses and relative metabolite changes, respectively. Metabolites: ADPGlc, ADP-glucose; DHAP, dihydroxyacetone phosphate; Ery4P, erythrose-4-phosphate; FruBP, fructose-1,6-bisphosphate; Fru6P, fructose-6-phosphate; GAP, glyceraldehyde-3-phosphate; Glc1P, glucose-1-phosphate; Glc6P, glucose-6-phosphate; PEP, phosphoenolpyruvate; Pyr, pyruvate; Rib5P, ribose-5-phosphate; RuBP, ribulose bisphosphate; Sed7P, sedoheptulose-7-phosphate; Xyl5P, xylulose-5-phosphate; 1,3BPG, 1,3-bisphosphoglycerate; 2PGA, 2-phosphoglycerate; 3PGA, 3-phosphoglycerate. Enzymes: Aldo, FruBP aldolase; Eno, 2PGA enolase; GAPDH, GAP dehydrogenase; PFK, phosphofructokinase; PGI, phosphoglucose isomerase; PGK, phosphoglycerate kinase; PGM, phosphoglyceromutase; PK, Pyr kinase; Riso, Rib5P isomerase; TK, transketolase; TPI, triose phosphate isomerase; Xepi; Xyl5P epimerase.
Figure 5
Figure 5
FA quantification in embryos dissected from mature seeds. A, FA contents of sorted embryos excised from prkCOMP, PRKOX, and Col-0 WT seeds. Mature, imbibed seeds were dissected and embryos were sorted according to their fluorescence (no distinction was made between Y and YY samples). FAs were extracted and measured using GC-FID. Values displayed are mean total FA contents on a per-embryo basis (black bar outline) and mean contribution of different FA species to the total content in color. Individual biological replicates (n) consisted of pools of several (5–10) embryos. N = number of mother plants whose seeds were sampled. Error bars represent the standard error of the mean (SEM). ns, not significant (P > 0.05); ***P < 0.001 based on two-tailed t-tests for homoscedastic groups. See Supplemental Data Set 2 for FA quantifications and a statistical analysis of total FA contents. B, FA content of sorted prkCOMP and Col-0 WT embryos in relation to light intensity perceived during development. Mother plants were grown at high light intensity (HL: 300 μmol m−2 s−1). Grey filters reducing light intensity by 50% to normal light (150 μmol m−2 s−1) either on only the mother plant's rosettes (NLr samples) or the entire mother plant (including developing siliques; NL samples) were installed near the time of bolting. Mature seeds were dissected, sorted, and extracted as in (A); data display is as in (A). *P < 0.05; **P < 0.01; ***P < 0.001 based on Welch ANOVA with Dunnett's T3 correction for multiple comparisons. See Supplemental Data Set 3, A and B for FA quantifications and a statistical analysis of total FA contents, respectively. In both (A) and (B), individual data points are scattered over the bars, with matching colors representing the same mother plant.
Figure 6
Figure 6
Chlorophyll content of sorted green prkCOMP seeds. Values displayed are the total chlorophyll contents of R and YY seeds. Samples (n = 11) consisted of pooled seeds (11–22) from the same silique. The asterisk represents a statistically significant difference (*P < 0.05) between the two groups based on a two-tailed paired t-test. See Supplemental Data Set 4 for chlorophyll quantifications and a statistical analysis thereof.
Figure 7
Figure 7
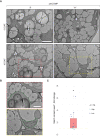
Visualization of lipid bodies and starch in green prk and complemented embryos. A, TEMs of thin sections of resin-embedded prkCOMP embryos harvested and dissected 4 h into the day. At 13 DAF, starch granules (S) were present in plastids of both prk (R) and the complemented (YY) siblings (upper micrographs; similar observations were made at 7 DAF in another experimental batch). At 16 DAF, starch granules were still present in prk embryos, but largely absent in YY embryos (lower micrographs). Bar = 2 μm. B, Enlarged regions of 16 DAF micrographs (from the dotted rectangles in A). Green dashed outlines indicate plastids; S, starch granules; O, oil bodies. Bar = 1 μm. Parts A and B show representative images of >10 images taken for each section. C, Starch measurements of sorted green prkCOMP seeds harvested at 11 DAF. Values displayed are the starch contents of R seeds normalized to the respective YY sample from the same silique. Siliques segregated into two classes with either high- (>15 nmol seed−1) or low-starch content, possibly due to small differences in their developmental stages. This classification of samples is indicated by the color of individual data points. Samples (n) consisted of pools of seeds (11–22) from the same silique. All siliques originated from the same mother plant. The asterisk represents a statistically significant difference (*P < 0.05) against the null hypothesis μ0=1 (indicated as yellow dashed line), based on a two-tailed t-test. See Supplemental Data Set 5 for starch quantifications and the statistical analysis thereof.

Similar articles

Cited by

References

    1. Andersson I, Backlund A (2008) Structure and function of Rubisco. Plant Physiol Biochem 46(3): 275–291 - PubMed
    1. Andriotis VM, Pike MJ, Kular B, Rawsthorne S, Smith AM (2010) Starch turnover in developing oilseed embryos. New Phytol 187(3): 791–804 - PubMed
    1. Andriotis VM, Pike MJ, Schwarz SL, Rawsthorne S, Wang TL, Smith AM (2012) Altered starch turnover in the maternal plant has major effects on Arabidopsis fruit growth and seed composition. Plant Physiol 160(3): 1175–1186 - PMC - PubMed
    1. Arrivault S, Guenther M, Ivakov A, Feil R, Vosloh D, Van Dongen JT, Sulpice R, Stitt M (2009) Use of reverse-phase liquid chromatography, linked to tandem mass spectrometry, to profile the Calvin cycle and other metabolic intermediates in Arabidopsis rosettes at different carbon dioxide concentrations. Plant J 59(5): 826–839 - PubMed
    1. Asokanthan PS, Johnson RW, Griffith M, Krol M (1997) The photosynthetic potential of canola embryos. Physiol Plant 101(2): 353–360

Publication types