. 2022 Dec 1;18(12):e1010709.
doi: 10.1371/journal.pcbi.1010709. eCollection 2022 Dec.

Plausible pathway for a host-parasite molecular replication network to increase its complexity through Darwinian evolution

Affiliations

Plausible pathway for a host-parasite molecular replication network to increase its complexity through Darwinian evolution

Rikuto Kamiura et al. PLoS Comput Biol. .

Abstract

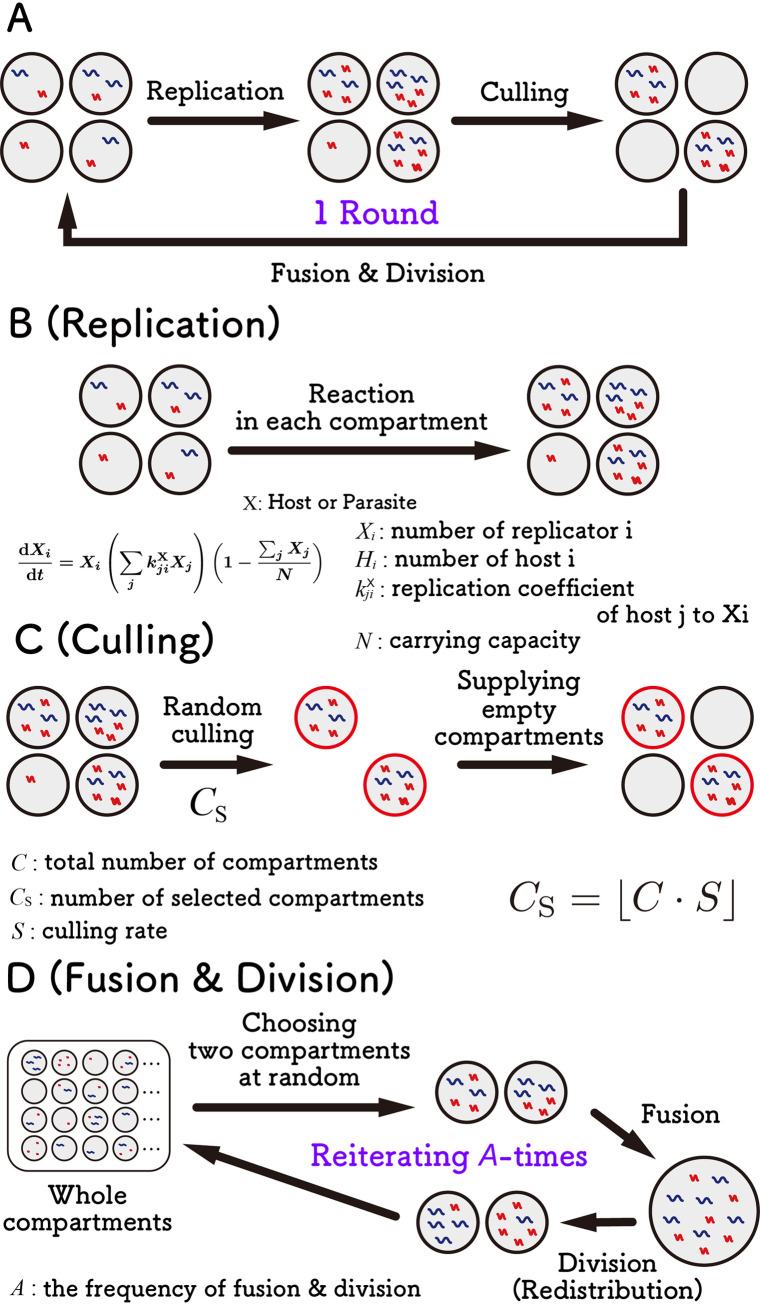
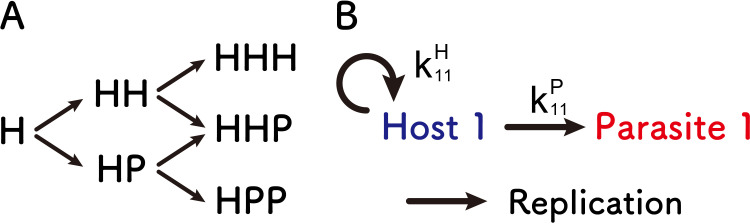
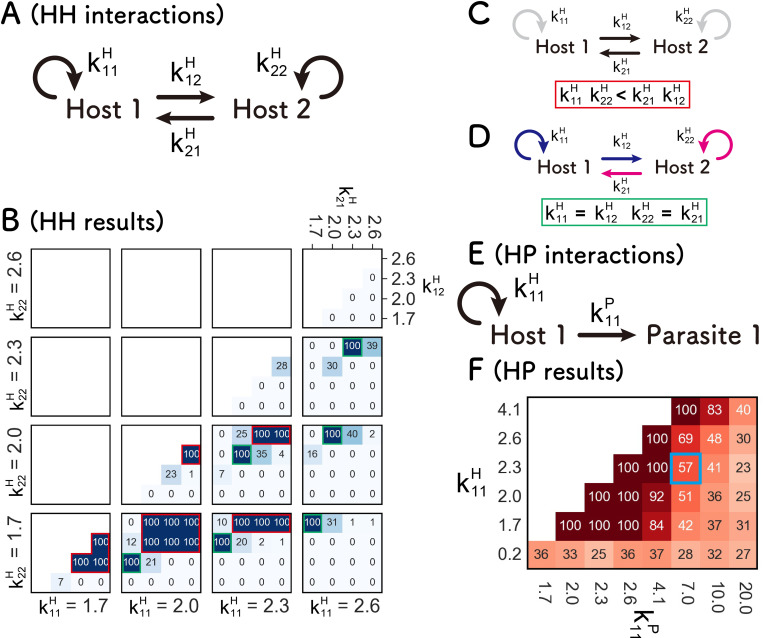
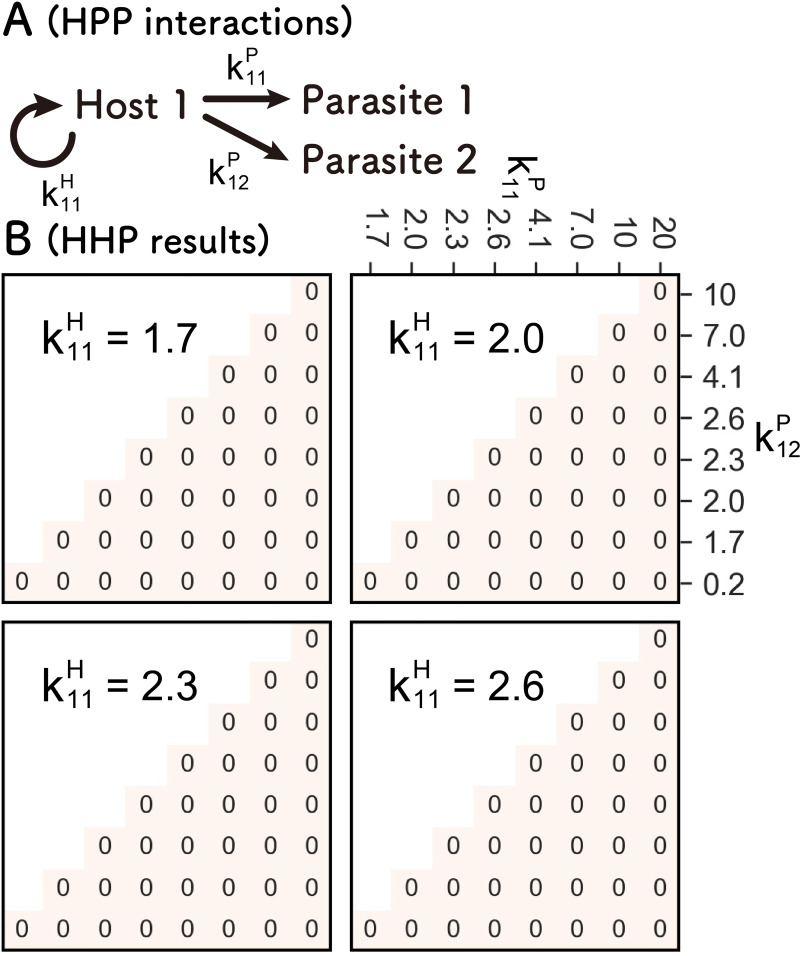
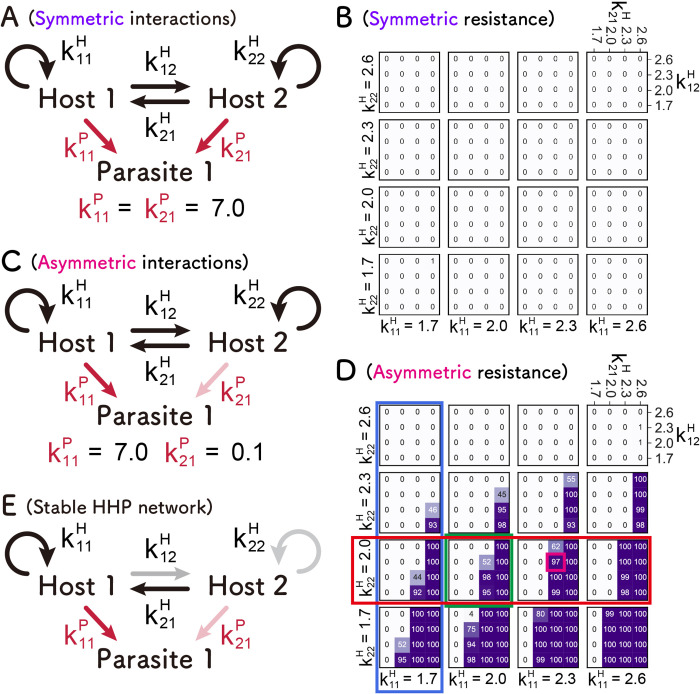
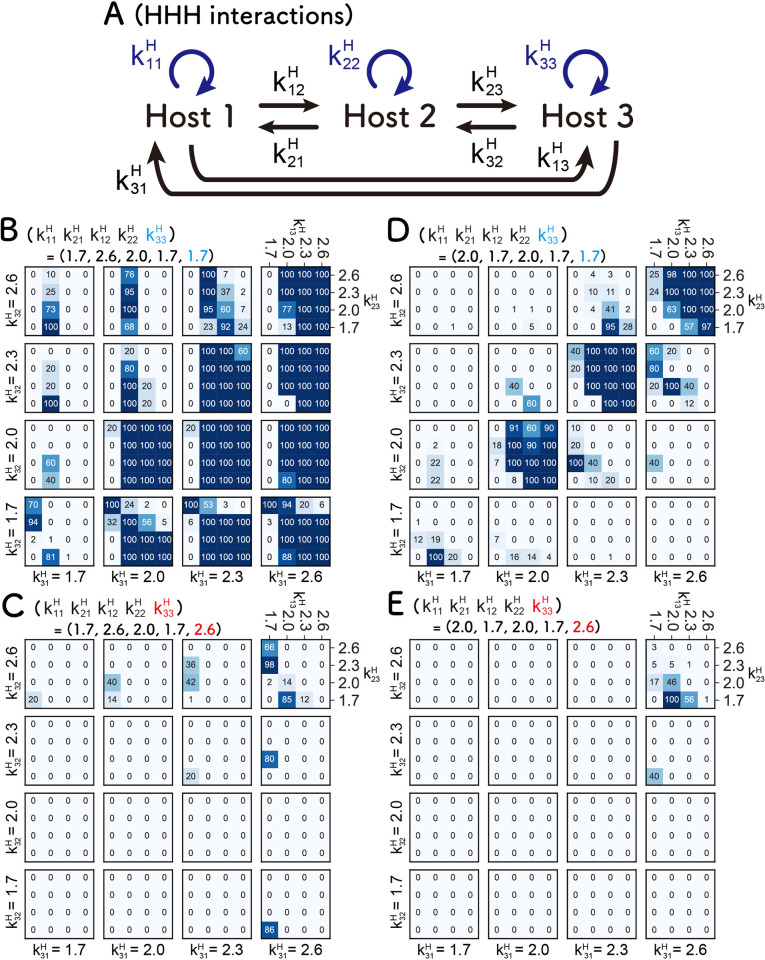
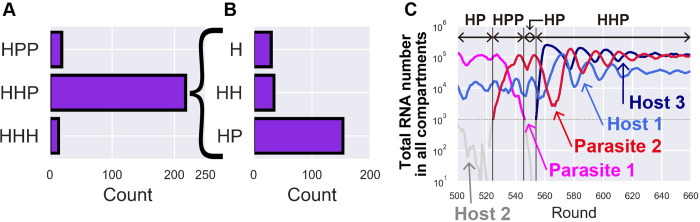
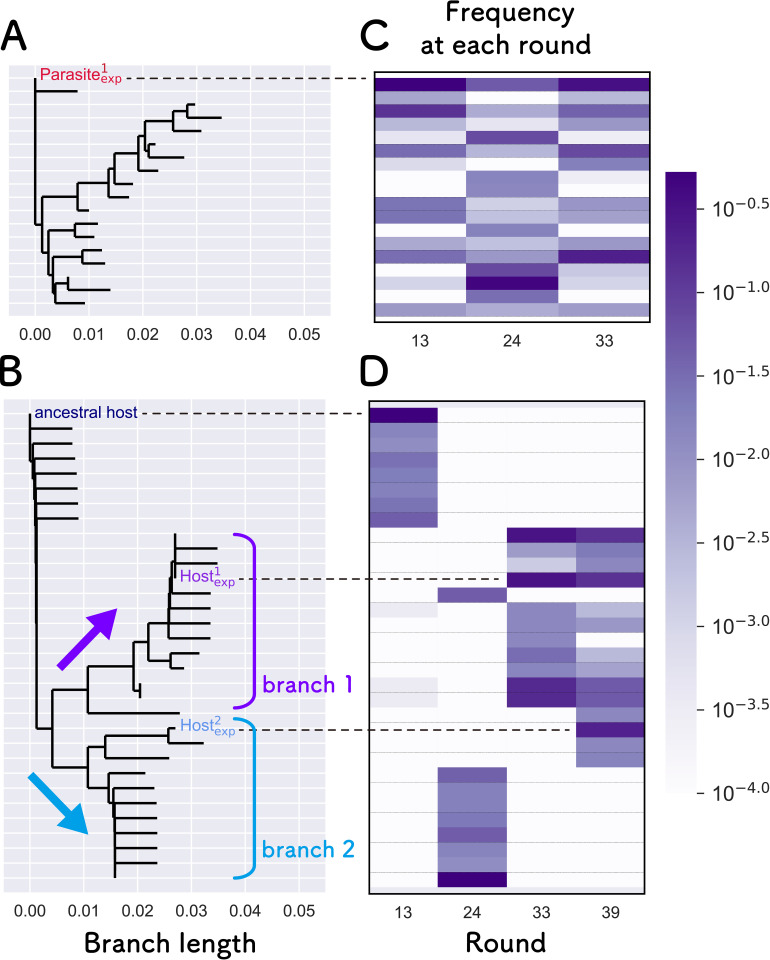
How the complexity of primitive self-replication molecules develops through Darwinian evolution remains a mystery with regards to the origin of life. Theoretical studies have proposed that coevolution with parasitic replicators increases network complexity by inducing inter-dependent replication. Particularly, Takeuchi and Hogeweg proposed a complexification process of replicator networks by successive appearance of a parasitic replicator followed by the addition of a new host replicator that is resistant to the parasitic replicator. However, the feasibility of such complexification with biologically relevant molecules is still unknown owing to the lack of an experimental model. Here, we investigated the plausible complexification pathway of host-parasite replicators using both an experimental host-parasite RNA replication system and a theoretical model based on the experimental system. We first analyzed the parameter space that allows for sustainable replication in various replication networks ranging from a single molecule to three-member networks using computer simulation. The analysis shows that the most plausible complexification pathway from a single host replicator is the addition of a parasitic replicator, followed by the addition of a new host replicator that is resistant to the parasite, consistent with the previous study by Takeuchi and Hogeweg. We also provide evidence that the pathway actually occurred in our previous evolutionary experiment. These results provide experimental evidence that a population of a single replicator spontaneously evolves into multi-replicator networks through coevolution with parasitic replicators.


Conflict of interest statement

The authors have declared that no competing interests exist.

Figures

Fig 1
Fig 1. Theoretical model of compartmentalized replication through serial replication cycles.
(A) Overview of the serial replication cycle of compartmentalized replication, which consists of replication, culling, and fusion-division steps. (B) In the replication step, hosts and parasites in each compartment replicate according to differential equations. (C) In the culling step, a certain number (Cs) of compartments are randomly selected, and the other compartments are replaced with empty compartments. (D) In the fusion-division step, two compartments are randomly chosen, and the internal host and parasites are mixed, followed by random redistribution into two compartments. These processes were repeated A times. The number of compartments is 3,000, and the frequency of fusion-division is 5,000 unless indicated otherwise.
Fig 2
Fig 2. Possible complexification pathways and an example of replication parameters.
(A) Possible complexification pathways in up to three-member replication networks. Starting from a single host self-replicator (H), next possible steps are the addition of another host or parasite to form two-member replication networks, namely, HH and HP. In the next step, another host or parasite could join to form three-member replication networks, namely, HHH, HHP, and HPP. (B) Parameters that characterize HP network as an example. A host replicates itself (i.e., self-replicates) with the coefficient k11H and a parasite with the coefficient k11P. Similar coefficients are used for the other networks.
Fig 3
Fig 3. Search for the parameters that allow sustainable HH and HP networks.
(A) Scheme of the HH network. Each host self-replicates with coefficient k11H or k22H, and replicates the other host with coefficients k12H or k21H. (B) Numbers of the runs in which both Hosts 1 and 2 are sustained for 100 rounds out of 100 independent simulations. The regions enclosed with red and green squares are the two different sustainable conditions each depicted in (C) and (D), respectively. The results on the diagonal line were omitted because Hosts 1 and 2 are identical there. (E) Scheme of the HP network. The host self-replicates with coefficient, k11H, and replicate the parasite with coefficient, k11P. (F) Numbers of the runs in which both the host and parasite are sustained for 100 rounds out of 100 independent simulations. The blue square indicates parameters of the dominant RNAs (Host1exp and Parasite1exp) obtained in the evolutionary experiment.
Fig 4
Fig 4. Search for the parameters that allow sustainable HPP network.
(A) Scheme of the HPP network. The host self-replicates with coefficient k11H and replicates two parasites with coefficient k11P or k12P. (B) Numbers of the runs in which all three replicators (the host and Parasites 1 and 2) are sustained for 100 rounds out of 100 independent simulations.
Fig 5
Fig 5. Search for the parameters that allow sustainable HHP networks.
Symmetric (A) and asymmetric (C) HHP networks. The number of runs in which all three replicators (Hosts 1 and 2, and Parasite 1) were sustained for 100 rounds out of 100 independent simulations in symmetric (B) and asymmetric (D) cases is shown. The magenta square represents the close parameter values of the representative RNAs obtained from the evolutionary experiment. (E) A typical condition for a sustainable HHP network, which contains a parasite-susceptible and parasite-resistant host species; the parasite-susceptible host (Host 1) tends to replicate more efficiently through self- and/or cross-replications. The color depth of the arrows represents the value of the replication coefficients.
Fig 6
Fig 6. Search for the parameters that allow sustainable HHH networks.
(A) Scheme of the HHH networks. (B-E) Numbers of runs in which all three hosts are sustained for 100 rounds out of three independent simulations. The parameter values for Hosts 1 and 2 are fixed at two cases that allows sustainable replication in the HH network. (B, C) Conditions I (Fig 3C, k11H = 1.7, k21H = 2.6, k12H = 2.0, and k22H = 1.7). (D, E) Conditions II (Fig 3D, k11H = 2.0, k21H = 1.7, k12H = 2.0, and k22H = 1.7). For the same reason, we employed a small (1.7) (B and D) or a large (2.6) (C and E) value for the self-replication coefficient of the newly added Host 3 (k33H).
Fig 7
Fig 7. Computer simulation of the evolutionary transition of replication networks.
The evolutionary transition was simulated by introducing a mutagenesis step in the serial replication cycle, as shown in Fig 1, for 1000 rounds. (A) The number of networks maintained for more than 100 rounds during replication cycles in 1000 simulations was counted. (B) Number of networks that preceded the 218 HHP networks shown in A. (C) A typical trajectory of the total number of each replicator in one of the simulations that resulted in the formation of the HHP network. The network composition was determined based on the replicators with more than 1,000. The replicators with less than 1,000 were shown as gray lines. The reason why some replicators started from >100 was that they replicated from 1 to >100 in the round that it appeared.
Fig 8
Fig 8. Phylogenetic analysis of the host and parasitic RNAs that appeared in the previous evolutionary experiment.
Phylogenetic trees of the top eight parasitic (A) and host RNAs (B) that appeared in the early rounds of the previous evolutionary experiment [30]. Phylogenetic trees were constructed using the neighbor-joining method with the Phylo.TreeConstruction module in the Biopython library and default parameters [–52]. The RNA frequencies at each round are shown as heat maps for the parasite (C) and host RNAs (D). Representative parasites and hosts used for the next biochemical experiments are indicated by “Parasite1exp” and “Host1exp”and “Host2exp,” respectively. We could not obtain sequence data of the parasite at round 39 because the total concentration of the parasitic RNA was too low. The horizontal scale of the phylogenetic tree is the same as the number of mutations.
Fig 9
Fig 9. Biochemical analysis of the representative host and parasitic RNAs.
(A) Experimental procedure for the estimation of replication coefficients. In the first translation reaction, RNA replicase was translated from one of the host RNAs (RNA I) for 2 h at 37°C, in which UTP was omitted to avoid RNA replication. In the second replication step, another host or parasitic RNA (RNA II), UTP, and an inhibitor of translation (30 μg/ml streptomycin) were added, and both RNAs I and II were replicated by the replicase for 1 h at 37°C. (B) RNA replication results. Experiments are independently performed three times. The error bars represent standard deviations. (C) Trajectory of RNA concentrations in the compartmentalized serial replication experiment of the three representative RNAs.

Similar articles

Cited by

  • RNA World with Inhibitors.
    Synak J, Rybarczyk A, Kasprzak M, Blazewicz J. Synak J, et al. Entropy (Basel). 2024 Nov 23;26(12):1012. doi: 10.3390/e26121012. Entropy (Basel). 2024. PMID: 39766641 Free PMC article.

References

    1. Orgel LE. Molecular replication. Nature. 1992;358(6383):203–9. doi: 10.1038/358203a0 - DOI - PubMed
    1. Szathmáry E, Maynard Smith J. From replicators to reproducers: The first major transitions leading to life. J Theor Biol. 1997;187(4):555–71. doi: 10.1006/jtbi.1996.0389 - DOI - PubMed
    1. Kauffman SA. Approaches to the origin of life on earth. Life. 2011. Nov;1(1):34–48. doi: 10.3390/life1010034 - DOI - PMC - PubMed
    1. Joyce GF. The antiquity of RNA-based evolution. Nature. 2002;418(6894):214–21. doi: 10.1038/418214a - DOI - PubMed
    1. Poole AM, Jeffares DC, Penny D. The path from the RNA world. J Mol Evol. 1998;46(1):1–17. doi: 10.1007/pl00006275 - DOI - PubMed

Publication types