. 2022 Dec 1;17(12):e0278543.
doi: 10.1371/journal.pone.0278543. eCollection 2022.

Evaluation of co-circulating pathogens and microbiome from COVID-19 infections

Affiliations

Evaluation of co-circulating pathogens and microbiome from COVID-19 infections

James B Thissen et al. PLoS One. .

Abstract

Co-infections or secondary infections with SARS-CoV-2 have the potential to affect disease severity and morbidity. Additionally, the potential influence of the nasal microbiome on COVID-19 illness is not well understood. In this study, we analyzed 203 residual samples, originally submitted for SARS-CoV-2 testing, for the presence of viral, bacterial, and fungal pathogens and non-pathogens using a comprehensive microarray technology, the Lawrence Livermore Microbial Detection Array (LLMDA). Eighty-seven percent of the samples were nasopharyngeal samples, and 23% of the samples were oral, nasal and oral pharyngeal swabs. We conducted bioinformatics analyses to examine differences in microbial populations of these samples, as a proxy for the nasal and oral microbiome, from SARS-CoV-2 positive and negative specimens. We found 91% concordance with the LLMDA relative to a diagnostic RT-qPCR assay for detection of SARS-CoV-2. Sixteen percent of all the samples (32/203) revealed the presence of an opportunistic bacterial or frank viral pathogen with the potential to cause co-infections. The two most detected bacteria, Streptococcus pyogenes and Streptococcus pneumoniae, were present in both SARS-CoV-2 positive and negative samples. Human metapneumovirus was the most prevalent viral pathogen in the SARS-CoV-2 negative samples. Sequence analysis of 16S rRNA was also conducted to evaluate bacterial diversity and confirm LLMDA results.


Conflict of interest statement

The authors have declared that no competing interests exist.

Figures
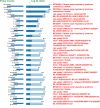
Fig 1
Fig 1. LLMDA result of synthetic SARS-CoV-2 RNA control (Twist Bioscience).
The array was analyzed using the 99% threshold of signal above random controls. The light and dark colored portions of the bars represent the unconditional and conditional log-odds scores, respectively. The conditional log-odds scores show the contribution from a target that cannot be explained by another, more likely target above it. The unconditional score illustrates that some very similar targets share a number of probes.
Fig 2
Fig 2. Observed species richness in SARS-CoV-2 positive vs negative samples detected by the LLMDA.
Samples with no species detected are not included. The samples were coded by color based on their types: nose/throat swabs are shown in red circles; NP swabs are shown in green circles; OP swabs are shown in blue circles.
Fig 3
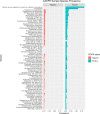
Fig 3. The prevalence of species detected in SARS-CoV-2 positive and negative samples using the LLMDA.
Prevalence is measured as the fraction of samples in which the taxon was found. Species with a prevalence less than 5% across all samples are not shown.
Fig 4
Fig 4. Family prevalence and relative abundance from 16S rRNA sequencing data.
ASV detected in SARS-CoV-2 negative (A) and positive (B) samples. Prevalence is measured as fraction of samples in which the ASV was found. Families displayed were those with the highest overall prevalence.
Fig 5
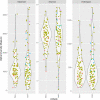
Fig 5. Alpha diversity analysis from 16S rRNA sequencing data.
Violin plots comparing observed ASV count, Shannon index, and inverse Simpson index for SARS-CoV-2 negative and SARS-CoV-2 positive samples. P-values from Welch’s two sample t-test are displayed.
Fig 6
Fig 6. Principle component analysis of beta diversity distances (weighted Unifrac) between samples based on 16S rRNA amplicon sequencing data.
Axes are the first two components representing the indicated percentages of the total variation explained. No clear separation between SARS-CoV-2 positive and SARS-CoV-2 negative samples is apparent, nor is there a significant distinction between sample types.

References

    1. Chen N, Zhou M, Dong X, Qu J, Gong F, Han Y, et al.. Epidemiological and clinical characteristics of 99 cases of 2019 novel coronavirus pneumonia in Wuhan, China: a descriptive study. The Lancet. 2020;395(10223):507–13. doi: 10.1016/S0140-6736(20)30211-7 - DOI - PMC - PubMed
    1. Kim D, Quinn J, Pinsky B, Shah NH, Brown I. Rates of Co-infection Between SARS-CoV-2 and Other Respiratory Pathogens. JAMA. 2020;323(20):2085–6. doi: 10.1001/jama.2020.6266 - DOI - PMC - PubMed
    1. Mirzaei R, Goodarzi P, Asadi M, Soltani A, Aljanabi HAA, Jeda AS, et al.. Bacterial co-infections with SARS-CoV-2. IUBMB life. 2020;72(10):2097–111. Epub 2020/08/10. doi: 10.1002/iub.2356 ; PubMed Central PMCID: PMC7436231. - DOI - PMC - PubMed
    1. Musuuza JS, Watson L, Parmasad V, Putman-Buehler N, Christensen L, Safdar N. Prevalence and outcomes of co-infection and superinfection with SARS-CoV-2 and other pathogens: A systematic review and meta-analysis. PLOS ONE. 2021;16(5):e0251170. doi: 10.1371/journal.pone.0251170 - DOI - PMC - PubMed
    1. He S, Liu W, Jiang M, Huang P, Xiang Z, Deng D, et al.. Clinical characteristics of COVID-19 patients with clinically diagnosed bacterial co-infection: A multi-center study. PLOS ONE. 2021;16(4):e0249668. doi: 10.1371/journal.pone.0249668 - DOI - PMC - PubMed

Publication types

Substances