. 2022 Dec 20;3(12):100845.
doi: 10.1016/j.xcrm.2022.100845. Epub 2022 Nov 15.

Tfh cells and the germinal center are required for memory B cell formation & humoral immunity after ChAdOx1 nCoV-19 vaccination

Affiliations

Tfh cells and the germinal center are required for memory B cell formation & humoral immunity after ChAdOx1 nCoV-19 vaccination

William S Foster et al. Cell Rep Med. .

Abstract

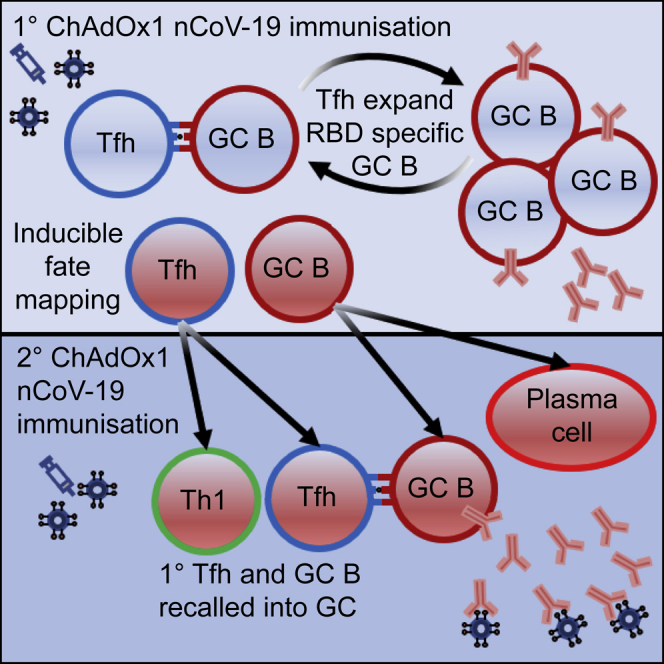
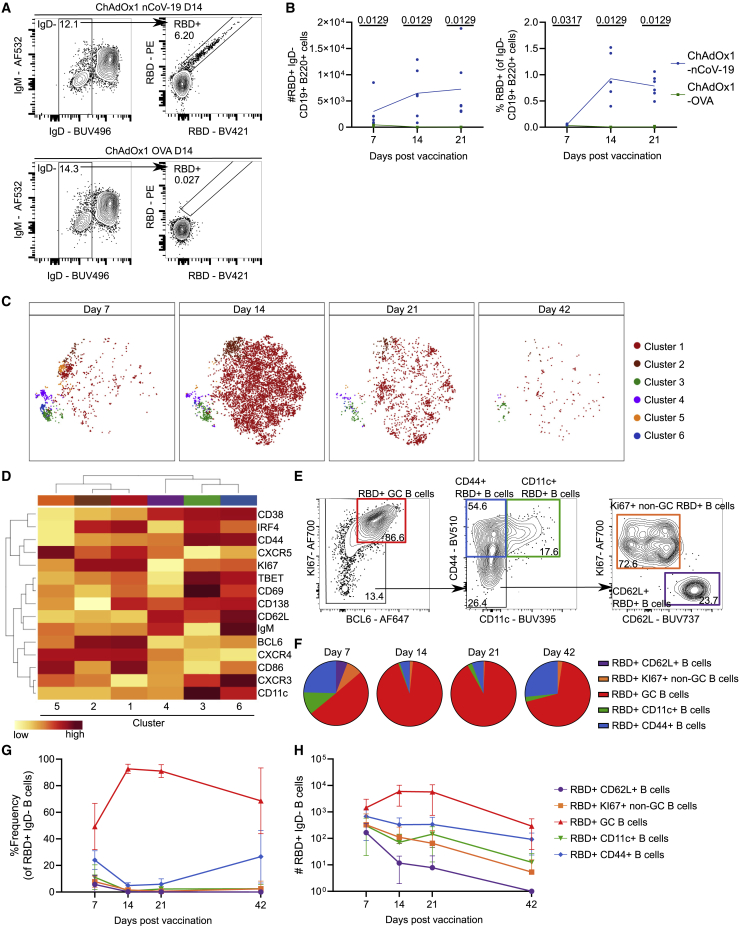
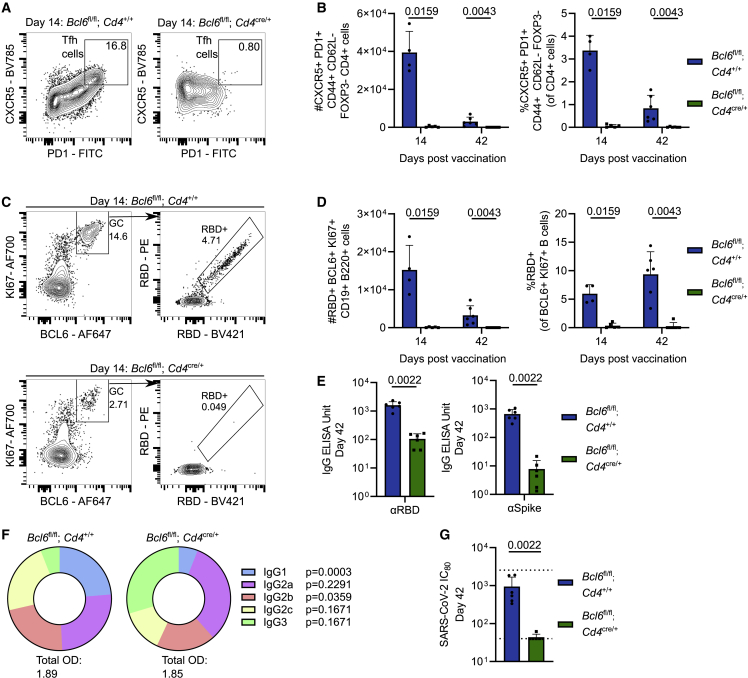
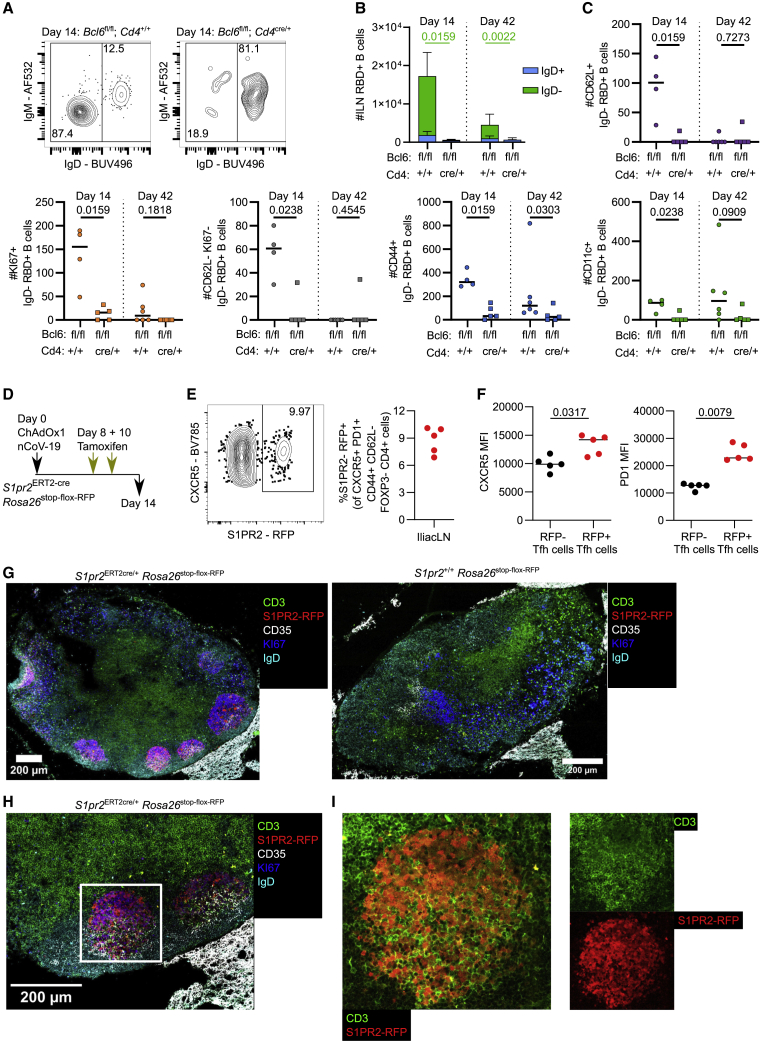
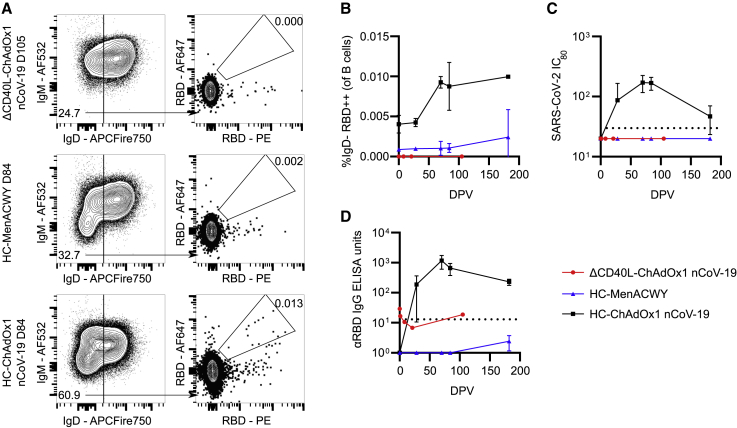
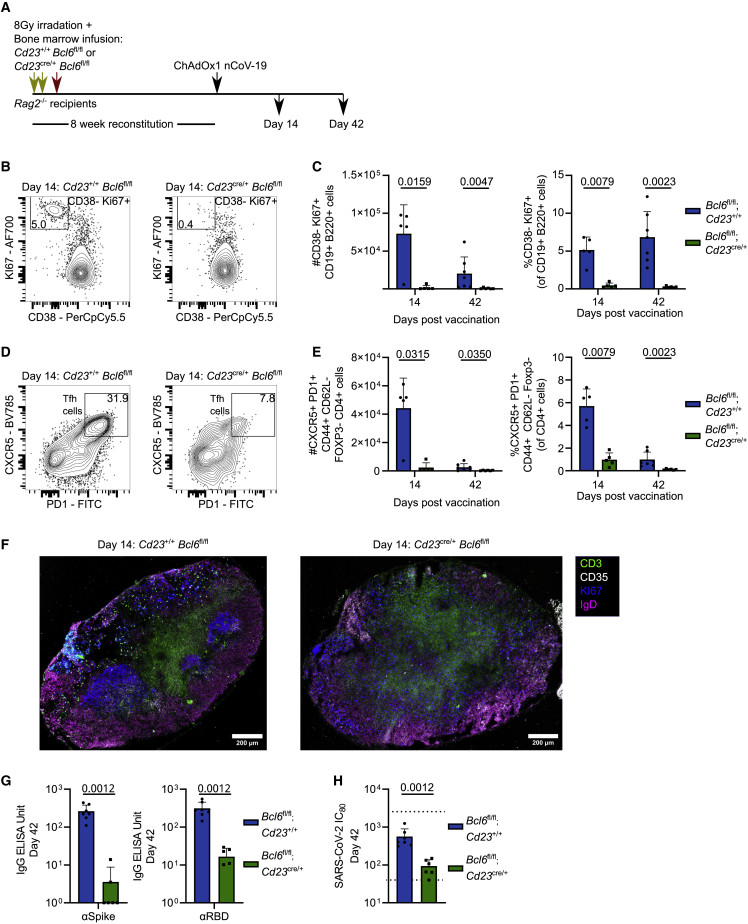
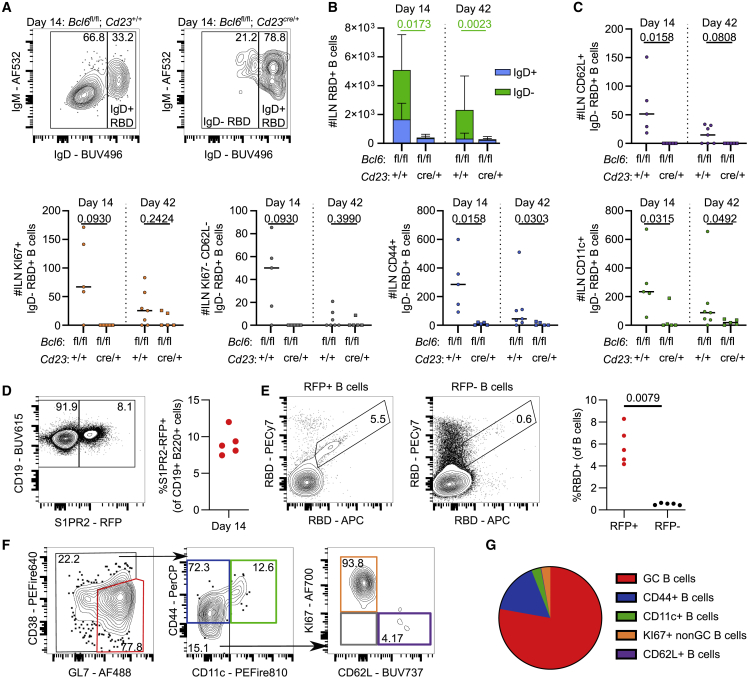
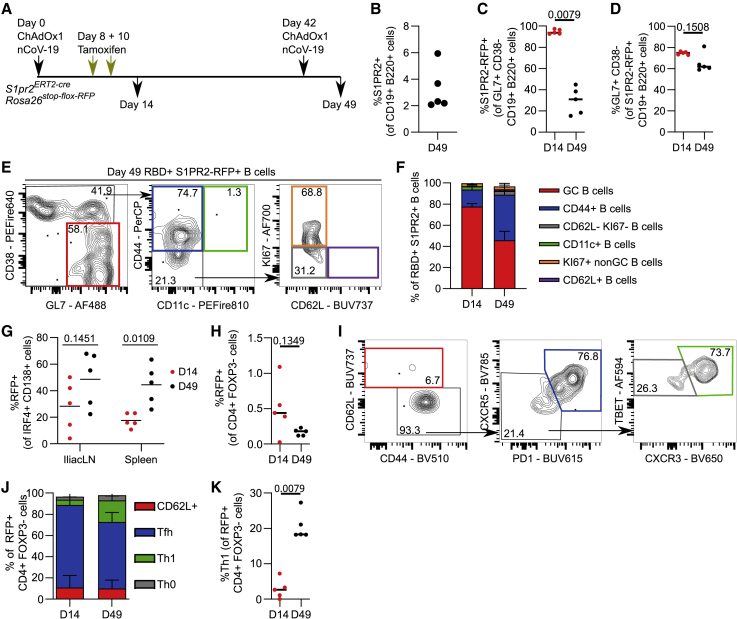
Emergence from the severe acute respiratory syndrome coronavirus 2 (SARS-CoV-2) pandemic has been facilitated by the rollout of effective vaccines. Successful vaccines generate high-affinity plasma blasts and long-lived protective memory B cells. Here, we show a requirement for T follicular helper (Tfh) cells and the germinal center reaction for optimal serum antibody and memory B cell formation after ChAdOx1 nCoV-19 vaccination. We found that Tfh cells play an important role in expanding antigen-specific B cells while identifying Tfh-cell-dependent and -independent memory B cell subsets. Upon secondary vaccination, germinal center B cells generated during primary immunizations can be recalled as germinal center B cells again. Likewise, primary immunization GC-Tfh cells can be recalled as either Tfh or Th1 cells, highlighting the pluripotent nature of Tfh cell memory. This study demonstrates that ChAdOx1 nCoV-19-induced germinal centers are a critical source of humoral immunity.

Keywords: CD40L; ChAdOx1 nCoV-19; SARS-CoV-2; Tfh cells; germinal center; vaccine.


Conflict of interest statement

Declaration of interests T.L. is named on a patent application covering ChAdOx1 nCoV-19. The funders played no role in the conceptualization, design, data collection, analysis, decision to publish, or preparation of the manuscript.

Figures

None
Graphical abstract
Figure 1
Figure 1
ChAdOx1 nCoV-19 immunization generates a mix of RBD-specific GC and memory B cells in the draining medial iliac lymph node (A) Median flow cytometry plots for IgD RBD+ B cell staining, pre-gated on live, single, CD19+ B220+ cells. (B) Total number and relative frequency of IgD RBD+ B cells. (C) tSNE analysis of IgD RBD+ B cells separated by time point. FlowSOM analysis was used to identify 6 clusters of cells. (D) Heatmap showing mean fluorescence intensity (MFI) of each marker used in (C) for clustering analysis. (E) Flow cytometry gating of 5 IgD RBD+ subpopulations based on a concatenated sample of all IgD RBD+ B cells shown in (C). (F) Pie charts showing relative frequency of subpopulations identified in (E) for each of the 4 time points. (G and H) Line graphs showing relative frequency (G) and quantification (H) of subpopulations identified in (E). Error bars show mean and standard deviation. For each time point and condition, n = 5 or 6 per group. For (B), multiple Mann-Whitney tests per row were used, with p values corrected for multiple comparison analysis with the Holm-Šídák method. Data are representative of two individual experiments.
Figure 2
Figure 2
Tfh cells are required for efficient RBD-specific GC B cell generation and serum immunity Bcl6fl/flCd4+/+ and Bcl6fl/flCd4cre/+ mice were immunized with ChAdOx1 nCoV-19 intramuscularly, with tissues taken for analysis at indicated time points. (A) Day 14 median flow cytometry plots for mILN Tfh cell staining, pre-gated on live, single, CD4+ FOXP3, CD44+ CD62L cells. (B) Total number and relative frequency of mILN Tfh cells after immunization at indicated time points. (C) Day 14 median flow cytometry plots for mILN RBD+ GC B cell staining pre-gated on live, single, CD19+ B220+ cells. (D) Total number and relative frequency of mILN RBD+ GC B cells after immunization at indicated time points. (E) Serum anti-spike and anti-RBD IgG antibodies at day 42 post-immunization. (F) Pie charts indicating the mean abundance of each IgG antibody subclass in the serum at the indicated time points after immunization. (G) SARS-CoV-2 neutralizing antibody titers in sera were determined by micro-neutralization test, expressed as reciprocal serum dilution to inhibit pseudotyped virus entry by 80% (IC80). Dashed lines represent upper and lower detection limits. For each time point and condition, n = 4–6, respectively, per group. For (B), (D), and (F), multiple Mann-Whitney tests per row were used, with p values corrected for multiple comparison analysis with the Holm-Šídák method. For (E) and (G), a Mann-Whitney test was used. In bar graphs, each symbol represents a biological replicate, bar height the mean, and the error bars the standard deviation. Data are representative of two individual experiments.
Figure 3
Figure 3
Tfh cells are required for all IgD RBD-specific B cell subsets, except CD11c+ B cells in the draining medial iliac lymph node (A) Day 14 median flow cytometry plots for IgD staining of RBD+ B cells, pre-gated on live, single, CD19+ B220+, RBD+ cells. (B) Total number of RBD+ B cells at indicated time point, p value shown is from comparison of the number of IgD RBD+ cells, bar height shows the mean, and the error bars the standard deviation. (C) IgD RBD+ B cell subsets were enumerated using the gating strategy as shown in Figure 1E. (D) Schematic of experimental setup: S1pr2ERT2−creRosa26stop-flox-RFP mice were immunized with ChAdOx1 nCoV-19 intramuscularly, followed by tamoxifen oral gavage at 8 and 10 days post-immunization. (E) Relative frequency of S1PR2-RFP fate-mapped Tfh cells at day 14. (F) CXCR5 and PD1 MFI of S1PR2-RFP and S1PR2-RFP+ fate-mapped Tfh cells, respectively. (G) Day 14 confocal microscopy from S1pr2ERT2-creRosa26stop-flox-RFP and S1pr2+/+Rosa26stop-flox-RFP mice. (H) 40× objective zoom of highlighted area of (G). (I) Zoom of highlighted area of (H) showing RFP and CD3 channels together and RFP/CD3 channels individually. For (B) and (C), multiple Mann-Whitney tests per row were used, with p values corrected for multiple comparison analysis with the Holm-Šídák method. For (F), Mann-Whitney tests were used. In dot plots, each symbol represents a biological replicate and the bar height the mean. Data are representative of two individual experiments.
Figure 4
Figure 4
Tfh-cell-mediated CD40L signaling is required for circulating RBD+ B cells and serum immunity in humans PBMC and serum were collected from a patient with a loss-of-function CD40L mutation (ΔCD40L) or from 3 healthy controls (HCs) after their second ChAdOx1 nCoV-19 vaccination or from 3 healthy controls who received their second MenACWY (Nimenrix) vaccine at indicated timepoints. (A) Median flow cytometry plots for circulating RBD+ IgD B cell staining, pre-gated on live, single, CD19+ B220+ cells at indicated time points for respective groups. (B) Frequency of IgD RBD+ B cells in the blood. (C) SARS-CoV-2 neutralizing antibody titers in sera were determined by micro-neutralization test, expressed as reciprocal serum dilution to inhibit pseudotyped virus entry by 80% (IC80). Dashed line represents lower detection limit. (D) Serum anti-RBD IgG antibodies were quantified by ELISA. In (B)–(D), symbols represent the mean, and error bars represent the standard deviation for the healthy controls that received either ChAdOx1 nCoV-19 (black) or MenACWY (blue) vaccines.
Figure 5
Figure 5
GC B cells are required for effective serum immunity following ChAdOx1 nCoV-19 vaccination (A) Rag2−/− recipient bone marrow chimera mice experiment overview. (B) Day 14 median flow cytometry plots for mILN GC B cell staining (gated as KI67+ CD38), pre-gated on live, single, CD19+ B220+ cells. (C) Total number and relative frequency of mILN GC B cells after immunization at indicated time points. (D) Day 14 median flow cytometry plots for mILN TFH cell staining, pre-gated on live, single, CD4+ FOXP3, CD44+ CD62L cells. (E) Total number and relative frequency of mILN TFH cells after immunization at indicated time points. (F) Day 14 confocal microscopy of mILNs from Cd23+/+Bcl6fl/fl and Cd23cre/+Bcl6fl/fl mice. (G) Serum anti-spike and anti-RBD IgG antibodies at day 42 post-immunization. (H) SARS-CoV-2 neutralizing antibody titers in sera were determined by micro-neutralization test, expressed as reciprocal serum dilution to inhibit pseudotyped virus entry by 80% (IC80). Dashed lines represent upper and lower detection limits. For each time point and condition, n = 5–7, respectively, per group. For (C) and (E), multiple Mann-Whitney tests per row were used, with p values corrected for multiple comparison analysis with the Holm-Šídák method. For (G) and (H), Mann-Whitney tests were used. In bar graphs, each symbol represents a biological replicate, bar height the mean, and the error bars the standard deviation. Data are representative of two individual experiments.
Figure 6
Figure 6
GC B cells are required for IgD RBD+ B cell amplification and can be S1PR2 fate mapped (A) Day 14 median flow cytometry plots for IgD staining of mILN RBD+ B cells, pre-gated on live, single, CD19+ B220+, RBD+ cells. (B) Total number of RBD+ B cells at indicated time points. p value shown is from comparison of the number of IgD RBD+ cells, bar height shows the mean, and the error bars the standard deviation. (C) IgD RBD+ B cell subsets were enumerated using the gating strategy as shown in Figure 1E. (D) Day 14 median flow cytometry plot and relative frequency of S1PR2-RFP+ fate-mapped B cells. (E) Median flow cytometry plots of RBD staining and quantification of RBD+ B cells in S1PR2-RFP+ fate-mapped and S1PR2-RFP fate-mapped populations, respectively. (F) Median flow cytometry plots of RBD+ S1PR2-RFP+ fate-mapped B cell subsets. (G) Mean frequency of RBD+ S1PR2-RFP+ fate-mapped B cell subsets. For each time point and condition, n = 5–7, respectively, per group. For (B) and (C), multiple Mann-Whitney tests per row were used, with p values corrected for multiple comparison analysis with the Holm-Šídák method. For (E), a Mann-Whitney test was used. In dot plots, each symbol represents a biological replicate and the bar height the mean. Data are representative of two individual experiments
Figure 7
Figure 7
S1PR2 fate-mapped GC B cells and GC Tfh cells are recalled in boost immunization as GC B cells, GC-derived CD44+ memory B cells and plasma cells, or Tfh and Th1 cells, respectively (A) S1pr2ERT2−creRosa26stop-flox-RFP mice recall experiment overview. (B) Relative frequency of S1PR2-RFP+ fate-mapped mILN B cells at day 49. (C) Relative frequency of S1PR2-RFP+ fate-mapped mILN GC B cells. (D) Relative frequency of GC phenotype within S1PR2-RFP+ fate-mapped mILN B cells. (E) Median flow cytometry plots of RBD+ S1PR2-RFP+ fate-mapped mILN B cell subsets. (F) Relative frequency of RBD+ S1PR2-RFP+ fate-mapped mILN B cell subsets at days 14 and 49, respectively. (G) Relative frequency of S1PR2-RFP+ fate-mapped plasma cells. (H) Relative frequency of S1PR2-RFP+ fate-mapped CD4+ FOXP3 cells. (I) Day 49 median flow cytometry plots of S1PR2-RFP+ fate-mapped mILN FOXP3 CD4+ cell subsets. (J) Relative frequency of S1PR2-RFP+ fate-mapped mILN FOXP3 CD4+ cell subsets. (K) Relative frequency of S1PR2-RFP+ fate-mapped mILN Th1 (TBET+ CXCR3+ CXCR5 PD1 CD44+ CD62L FOXP3 CD4+) cells. For each time point, n = 5. For (C), (D), (H), and (K), the Mann-Whitney test was used. For (G), multiple Mann-Whitney tests per row were used, with p values corrected for multiple comparison analysis with the Holm-Šídák method. In (B)–(D), (G), (H), and (K), each symbol represents a biological replicate and the bar height the mean. In (F) and (J), bar heights represent mean, and error bars represent the standard deviation. Data are representative of two individual experiments.

References

    1. WHO Coronavirus (COVID-19) Dashboard. (2021). https://covid19.who.int/.
    1. AstraZeneca . 2021. Two billion doses of AstraZeneca’s COVID-19 vaccine supplied to countries across the world less than 12 months after first approval.https://www.astrazeneca.com/media-centre/press-releases/2021/two-billion...
    1. Lopez Bernal J., Andrews N., Gower C., Robertson C., Stowe J., Tessier E., Simmons R., Cottrell S., Roberts R., O'Doherty M., et al. Effectiveness of the Pfizer-BioNTech and Oxford-AstraZeneca vaccines on covid-19 related symptoms, hospital admissions, and mortality in older adults in England: test negative case-control study. BMJ. 2021;373:n1088. doi: 10.1136/bmj.n1088. - DOI - PMC - PubMed
    1. Harris R.J., Hall J.A., Zaidi A., Andrews N.J., Dunbar J.K., Dabrera G. Effect of vaccination on household transmission of SARS-CoV-2 in England. N. Engl. J. Med. 2021;385:759–760. doi: 10.1056/NEJMc2107717. - DOI - PMC - PubMed
    1. Voysey M., Clemens S.A.C., Madhi S.A., Weckx L.Y., Folegatti P.M., Aley P.K., Angus B., Baillie V.L., Barnabas S.L., Bhorat Q.E., et al. Safety and efficacy of the ChAdOx1 nCoV-19 vaccine (AZD1222) against SARS-CoV-2: an interim analysis of four randomised controlled trials in Brazil, South Africa, and the UK. Lancet. 2021;397:99–111. doi: 10.1016/S0140-6736(20)32661-1. - DOI - PMC - PubMed

Publication types

Substances