Editorial
. 2023 Mar 1;13(3):724-745.
doi: 10.1158/2159-8290.CD-22-0424.

Mutant NPM1 Hijacks Transcriptional Hubs to Maintain Pathogenic Gene Programs in Acute Myeloid Leukemia

Affiliations
Editorial

Mutant NPM1 Hijacks Transcriptional Hubs to Maintain Pathogenic Gene Programs in Acute Myeloid Leukemia

Xue Qing David Wang et al. Cancer Discov. .

Abstract

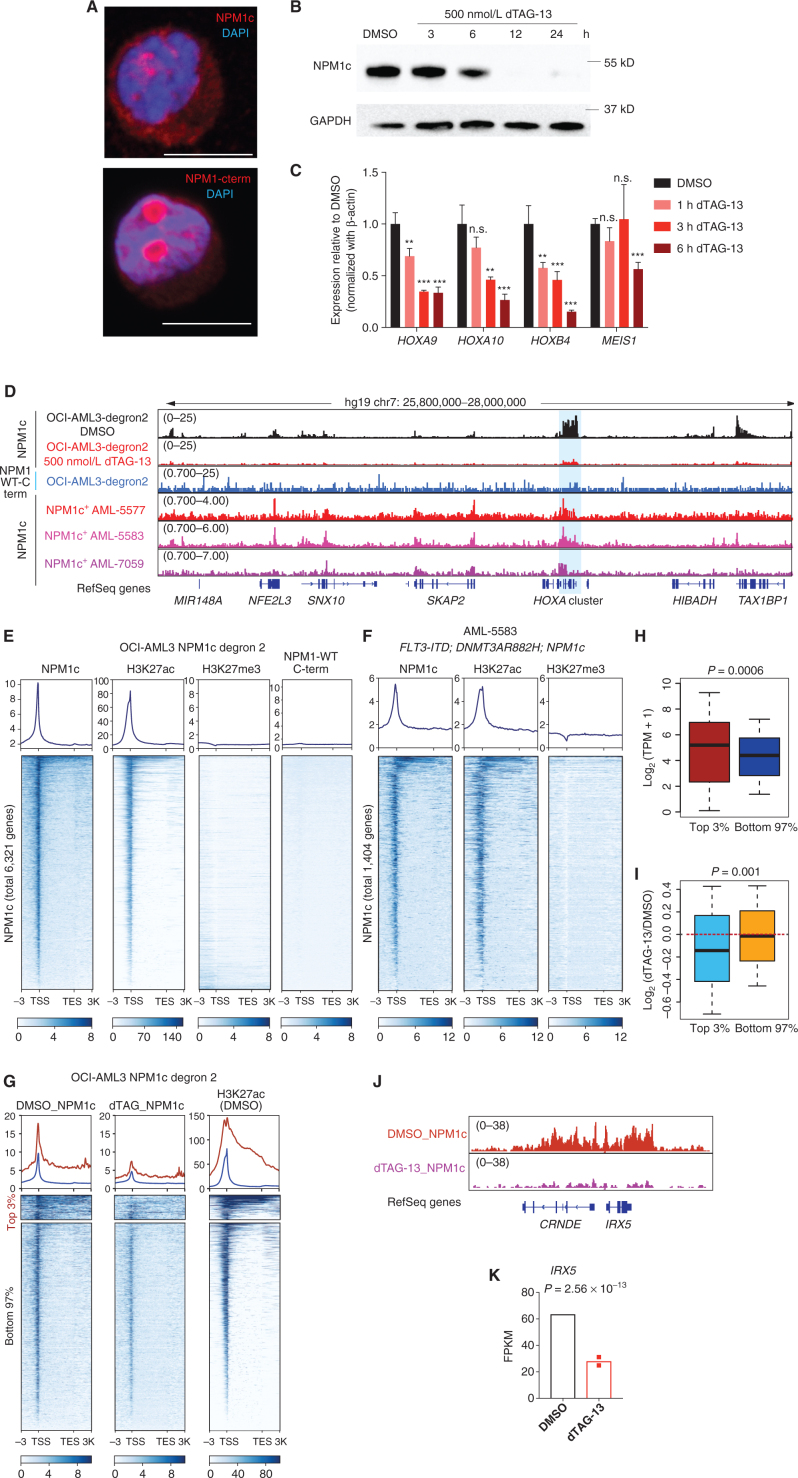
Nucleophosmin (NPM1) is a ubiquitously expressed nucleolar protein with a wide range of biological functions. In 30% of acute myeloid leukemia (AML), the terminal exon of NPM1 is often found mutated, resulting in the addition of a nuclear export signal and a shift of the protein to the cytoplasm (NPM1c). AMLs carrying this mutation have aberrant expression of the HOXA/B genes, whose overexpression leads to leukemogenic transformation. Here, for the first time, we comprehensively prove that NPM1c binds to a subset of active gene promoters in NPM1c AMLs, including well-known leukemia-driving genes-HOXA/B cluster genes and MEIS1. NPM1c sustains the active transcription of key target genes by orchestrating a transcription hub and maintains the active chromatin landscape by inhibiting the activity of histone deacetylases. Together, these findings reveal the neomorphic function of NPM1c as a transcriptional amplifier for leukemic gene expression and open up new paradigms for therapeutic intervention.

Significance: NPM1 mutation is the most common mutation in AML, yet the mechanism of how the mutant protein results in AML remains unclear. Here, for the first time, we prove mutant NPM1 directly binds to active chromatin regions and hijacks the transcription of AML-driving genes. See related article by Uckelmann et al., p. 746. This article is highlighted in the In This Issue feature, p. 517.


Figures

Figure 1. NPM1c binds to active promoter regions genome-wide. A, Immunostaining of NPM1c and NPM1-WT of OCI-AML3 cells. Scale bar = 10 μm. B, Time-dependent degradation of NPM1c–FKBP12 fusion protein with 500 nmol/L dTAG-13 in the OCI-AML3 NPM1c degron 2 cell line. DAPI was used to stain DNA in the nucleus. C, Expression of HOXA9, HOXA10, HOXB4, and MEIS1 after the 500 nmol/L dTAG-13 treatment with indicated time. Mean ± SEM was shown. n = 3. P value was calculated with a pairwise t test (DMSO vs. treatment). N.S: not significant; *, P < 0.05; **, P< 0.01; ***, P < 0.001. D, The IGV view of NPM1c and NPM1-WT CUT&RUN data in OCI-AML3 NPM1c degron 2 cells treated with DMSO or 500 nmol/L dTAG-13 for 24 hours, and three primary NPM1c+ AML blasts of different comutation profiles. The HOXA cluster and the surrounding regions were shown. Reads per genomic bin (10 bp) were used to normalize the aligned reads. The mutation profile of NPM1c+ AML is listed below: AML-5577: IDH1R132H, NPM1W288fs, insertion CCTG. AML-5583: DNMT3AR882H; FLT3-ITD; NPM1W288fs, insertion TCTG. AML-7059: TET2mut; CEBPAmut; NPM1W288fs. E and F, The binding profile of NPM1c, H3K27ac, and H3K27me3 at 6,312 NPM1c binding genes (E, OCI-AML3 NPM1c degron 2 cells) and 1,404 NPM1c genes (F, NPM1c+ AML-5583 blasts). G, The metaplot of NPM1c binding profile of top 3% genes and bottom 97% of NPM1c binding genes in OCI-AML3 NPM1c degron 2 cells under DMSO and 500 nmol/L dTAG-13 treatment. The metaplot of H3K27ac of the top 3% and bottom 97% NPM1c binding genes is also shown. H, Expression of the top 3% and bottom 97% NPM1c target genes. P value is calculated by the Wilcox rank test. Median and 25%, 75% percentile are plotted for the middle line, top, and bottom box line. Whisker indicates the maximum and minimum values in the data. I, Expression fold change of top 3% and bottom 97% NPM1c target genes in 500 nmol/L dTAG-13-treated cells in comparison with DMSO-treated cells. P value is calculated by the Wilcox rank test. Median and 25%, 75% percentile are plotted for the middle line, top, and bottom box line. Whisker indicates the maximum and minimum values in the data. J and K, NPM1c's binding profile at IRX5 (J) locus and expression value (FKPM) of IRX5 (K) with 24 hours of 500 nmol/L dTAG-13 treatment. Mean ± SD was shown. n = 2. P value is calculated by DESeq2.
Figure 1.
NPM1c binds to active promoter regions genome-wide. A, Immunostaining of NPM1c and NPM1-WT (c term) of OCI-AML3 cells. Scale bar = 10 μm. B, Time-dependent degradation of NPM1c–FKBP12 fusion protein with 500 nmol/L dTAG-13 in the OCI-AML3 NPM1c degron 2 cell line. DAPI was used to stain DNA in the nucleus. C, Expression of HOXA9, HOXA10, HOXB4, and MEIS1 after the 500 nmol/L dTAG-13 treatment for the indicated time. Mean ± SEM is shown. n = 3. P value was calculated with a pairwise t test (DMSO vs. treatment). n.s., not significant; **, P< 0.01; ***, P < 0.001. D, The Integrative Genomics Viewer view of NPM1c and NPM1-WT CUT&RUN data in OCI-AML3 NPM1c degron 2 cells treated with DMSO or 500 nmol/L dTAG-13 for 24 hours and three primary NPM1c+ AML blasts of different comutation profiles. The HOXA cluster and the surrounding regions are shown. Reads per genomic bin (10 bp) were used to normalize the aligned reads. The mutation profile of NPM1c+ AML is as follows: AML-5577: IDH1R132H, NPM1W288fs, insertion CCTG. AML-5583: DNMT3AR882H; FLT3-ITD; NPM1W288fs, insertion TCTG. AML-7059: TET2mut; CEBPAmut; NPM1W288fs.E and F, The binding profiles of NPM1c, H3K27ac, and H3K27me3 at 6,312 NPM1c binding genes (E; OCI-AML3 NPM1c degron 2 cells) and 1,404 NPM1c genes (F; NPM1c+ AML-5583 blasts). TES, transcriptional end site. G, The metaplot of NPM1c binding profile of top 3% of genes and bottom 97% of NPM1c binding genes in OCI-AML3 NPM1c degron 2 cells under DMSO and 500 nmol/L dTAG-13 treatment. The metaplot of H3K27ac of the top 3% and bottom 97% NPM1c binding genes is also shown. H, Expression of the top 3% and bottom 97% NPM1c target genes. P value is calculated by the Wilcox rank test. Median, 25th percentile, and 75th percentile are plotted for the middle, top, and bottom box lines. Whisker indicates the maximum and minimum values in the data. TPM, transcripts per kilobase million. I, Expression fold change of top 3% and bottom 97% NPM1c target genes in 500 nmol/L dTAG-13–treated cells in comparison with DMSO-treated cells. P value is calculated by the Wilcox rank test. Median, 25th percentile, and 75th percentile are plotted for the middle, top, and bottom box lines. Whisker indicates the maximum and minimum values in the data. J and K, NPM1c's binding profile at IRX5 locus (J) and expression value (FKPM) of IRX5 (K) with 24 hours of 500 nmol/L dTAG-13 treatment. Mean ± SD is shown. n = 2. P value is calculated by DESeq2. FPKM, fragments per kilobase million.
Figure 2. NPM1c directly modulates the transcription of leukemic genes via chromatin hijacking of RNA Pol2 and other transcriptional regulators. A, The experiment scheme of short time period NPM1c degradation. B–E, Normalized binding profile of NPM1c (B), RNA Pol2 (C), Menin (D), and HA-ENL (E) on 6,312 NPM1c binding genes in OCI-AML3 NPM1c degron 2 cells treated with 500 nmol/L dTAG-13 for the indicated time. F and G, The example IGV view of NPM1c, RNA Pol II, Menin, and HA-ENL enrichment at HOXA cluster (F), MEIS1 (G) locus with 500 nmol/L dTAG-13 treatment of indicated time. H and I, Bru-seq track of HOXA cluster (H) and MEIS1 (I) locus of OCI-AML3 NPM1c degron 2 cells treated with DMSO or 500 nmol/L dTAG-13 for 12 hours. J, The volcano plot shows the differential transcription genes on the gene body Bru-seq reads with the treatment of 12 hours 500 nmol/L dTAG-13 in OCI-AML3 NPM1c degron 2 cells. The horizontal dashed line indicates the cutoff for P = 0.01. The vertical dashed line indicates the 1.5-fold cutoff for fold change in gene expression. K, The LacI-LacO-array system to study the multivalent homotypic/heterotypic interactions between NPM1c and other transcription machinery protein on genomic loci. NPM1c-LacI is labeled with EYFP, NPM1c, or RPB1-CTD is labeled with mCherry. If heterotypic/homotypic interaction exists, both EYFP and mCherry-labeled protein will form puncta at endogenous LacO array. L, Two-color confocal fluorescence images of U2OS LacO-array cell cotransfected with EYFP-LacI with NPM1c-mCherry or RPB1-CTD mCherry (left two columns). And images of cells cotransfected with EYFP-NPM1c-LacI with NPM1c-mCherry or RPB1-CTD mCherry (right two columns). LacO-array locus is circled out and magnified LacO-array locus images are shown at the lower left part of the image. M, Enrichment of mCherry signal quantification at the LacO-array locus in the cells transfected in L. Mean ± S.D is shown. P value is calculated by the Student t test.
Figure 2.
NPM1c directly modulates the transcription of leukemic genes via chromatin hijacking of Pol II and other transcriptional regulators. A, The experiment scheme of short time period NPM1c degradation. B–E, Normalized binding profiles of NPM1c (B), Pol II (C), Menin (D), and HA-ENL (E) on 6,312 NPM1c binding genes in OCI-AML3 NPM1c degron 2 cells treated with 500 nmol/L dTAG-13 for the indicated time. RPKM, reads per kilobase million; TES, transcriptional end site. F and G, The example Integrative Genomics Viewer view of NPM1c, Pol II, Menin, and HA-ENL enrichment at the HOXA cluster (F) and the MEIS1 locus (G) with 500 nmol/L dTAG-13 treatment for the indicated time.H and I, Bru-seq track of the HOXA cluster (H) and MEIS1 locus (I) of OCI-AML3 NPM1c degron 2 cells treated with DMSO or 500 nmol/L dTAG-13 for 12 hours. J, The volcano plot shows the differential transcription genes on the gene body Bru-seq reads with 12-hour treatment of OCI-AML3 NPM1c degron 2 cells with 500 nmol/L dTAG-13. The horizontal dashed line indicates the cutoff for P = 0.01. The vertical dashed line indicates the 1.5-fold cutoff for fold change in gene expression. K, The LacI-LacO array system to study the multivalent homotypic/heterotypic interactions between NPM1c and other transcription machinery protein on genomic loci. NPM1c-LacI is labeled with EYFP, and NPM1c or RPB1-CTD is labeled with mCherry. If heterotypic/homotypic interaction exists, both EYFP- and mCherry-labeled protein will form puncta at endogenous LacO array. NLS, nuclear localization signal. L, Two-color confocal fluorescence images of U2OS LacO array cell cotransfected with EYFP-LacI with NPM1c-mCherry or RPB1-CTD mCherry (left two columns), and images of cells cotransfected with EYFP-NPM1c-LacI with NPM1c-mCherry or RPB1-CTD mCherry (right two columns). The LacO array locus is circled, and magnified LacO array locus images are shown at the lower left part of the image. M, Enrichment of mCherry signal quantification at the LacO array locus in the cells transfected in L. Mean ± SD is shown. P value is calculated by the Student t test.
Figure 3. NPM1c maintains an active chromatin state by antagonizing HDAC activity. A, Experimental scheme of dTAG-13 wash-off experiments. B, The dynamic change of NPM1c-FKBP after the wash-off of dTAG-13 at days 1, 2, and 4 in OCI-AML3 NPM1c degron 2 cells. C, The dTAG-13 triggered continuous differentiation is measured by CD14 and CD11b flow cytometry. Represented flow cytometry plots are displayed. D, The expression of HOXA cluster genes and MEIS1 in the cells 1 day with 500 nmol/L dTAG-13 treatment and 4 days after dTAG-13 wash-off in OCI-AML3 NPM1c degron 2 cells. Mean ± SD was shown. n = 3. Relative expression to β-actin was shown. P value is calculated by two tail Student t test (DMSO vs. 1 day dTAG-13 and DMSO vs. 4 day dTAG-13 wash-off). ***, P <0.001. E, IGV view of NPM1c, H3K27me3, and H3K27ac-binding profiles at HOXA cluster after 1 day of dTAG-13 treatment and 4 days dTAG-13 wash-off in OCI-AML3 NPM1c degron 2 cells. F, Experimental scheme of dTAG-13 and HDAC combination treatment experiments. G, The expression of HOXA cluster genes and MEIS1 in the cells 1 day with dTAG-13, HDAC inhibitor (SAHA), and dTAG-13-SAHA combination in OCI-AML3 NPM1c degron 2 cells. Mean ± SD was shown. n = 3. Relative expression to β-actin was shown. H, Alteration of the dTAG-13 triggered continuous differentiation with the 1day treatment of dTAG-13, HDAC inhibitor (SAHA), and dTAG-13-SAHA combination in OCI-AML3 NPM1c degron 2 cells. Differentiation is measured by flow cytometry of CD14, CD11b. Representative flow-cytometric plot is shown on the left. Quantification of undifferentiated CD11b− CD14− cells was shown on the right. n = 3; mean ± SD is shown. P value is calculated by one-way ANOVA test with the Tukey test on all pairwise comparisons between treatment groups. *, P < 0.05; **, P < 0.01; ***, P <0.001. I, IGV view of H3K27ac enrichment and distribution at HOXA cluster after 1-day treatment of dTAG-13 treatment and 4 days dTAG-13 wash-off in OCI-AML3 NPM1c degron 2 cells. J, Model of NPM1c's regulation of transcription and HDAC antagonism on chromatin for leukemic genes’ expression. NPM1c forms condensate to hijack the active transcription of target genes in AML—HOXA/B cluster genes, MEIS1, and IRX5 (top). With degradation of NPM1c, RNA Pol2 and transcriptional complexes like SEC and MLL–Menin are displaced from NPM1c target genes. HDACs are activated and silence the chromatin state in NPM1c target genes (bottom left). With the wash-off of dTAG-13, continued differentiation is observed in cells after 24-hour pulse dTAG-13 treatment, with the silencing of NPM1c target genes initiated by HDACs (bottom right). Pulse vorinostat and dTAG-13 cotreatment leads to a significant delay of continued differentiation, with partial reversal of chromatin state and gene expression in comparison with dTAG-13 (bottom right).
Figure 3.
NPM1c maintains an active chromatin state by antagonizing HDAC activity. A, Experimental scheme of dTAG-13 wash-off experiments. B, The dynamic change of NPM1c-FKBP after the wash-off of dTAG-13 at days 1, 2, and 4 in OCI-AML3 NPM1c degron 2 cells. C, The dTAG-13–triggered continuous differentiation is measured by CD14 and CD11b flow cytometry. Representative flow cytometry plots are displayed. D, The expression of HOXA cluster genes and MEIS1 in the cells after 1-day treatment with 500 nmol/L dTAG-13 and 4 days after dTAG-13 wash-off in OCI-AML3 NPM1c degron 2 cells. Mean ± SD is shown. n = 3. Relative expression to β-actin is shown. P value is calculated by two-tail Student t test (DMSO vs. 1 day dTAG-13 and DMSO vs. 4 day dTAG-13 wash-off). ***, P < 0.001. E, Integrative Genomics Viewer view of NPM1c, H3K27me3, and H3K27ac binding profiles at the HOXA cluster after 1 day of dTAG-13 treatment and 4 days of dTAG-13 wash-off in OCI-AML3 NPM1c degron 2 cells.F, Experimental scheme of dTAG-13 and HDAC inhibitor combination treatment experiments [dTAG-13, 500 nmol/L; vorinostat (SAHA), 1 μmol/L]. ChIP-seq, chromatin immunoprecipitation sequencing. G, Expression of HOXA genes and MEIS1 in OCI-AML3 NPM1c degron 2 cells following 1-day treatments with DMSO, dTAG-13, SAHA, and dTAG-13 + SAHA. Mean ± SD is shown. n = 3. Relative expression to β-actin is shown. H, Flow cytometry analysis with differentiation markers CD14 (x-axis) and CD11b (y-axis) of OCI-AML3 NPM1c degron 2 cells treated with DMSO, dTAG-13, SAHA, and dTAG-13 + SAHA for 1 day followed by 4 days of wash-off. Representative flow-cytometric plot is shown on the left. Quantification of undifferentiated CD11b CD14 cells is shown on the right. n = 3; mean ± SD is shown. P value is calculated by one-way ANOVA test with the Tukey test on all pairwise comparisons between treatment groups. **, P < 0.01; ***, P < 0.001. I, Integrative Genomics Viewer view of H3K27ac enrichment at the HOXA cluster in OCI-AML3 NPM1c degron 2 cells immediately after 1-day treatment and following 4-day wash-off of treatment with dTAG-13 or dTAG-13 + SAHA. J, Model of NPM1c's regulation of transcription and HDAC antagonism on chromatin for leukemic gene expression. NPM1c forms condensate to hijack the active transcription of target genes in AML—HOXA/B cluster genes, MEIS1, and IRX5 (top). With degradation of NPM1c, Pol II and transcriptional complexes like SEC and MLL–Menin are displaced from NPM1c target genes. HDACs are activated and silence the chromatin state in NPM1c target genes (bottom left). With the wash-off of dTAG-13, continued differentiation is observed in cells after 24-hour pulse dTAG-13 treatment, with the silencing of NPM1c target genes initiated by HDACs (bottom right). Pulse vorinostat and dTAG-13 cotreatment leads to a significant delay of continued differentiation, with partial reversal of chromatin state and gene expression in comparison with dTAG-13 (bottom right). HDACi, HDAC inhibitor.
Figure 4. NPM1c's hijacking of active transcription is cell-type specific and depends on cell-type–specific chromatin state. A, The scheme of CRISPR-Cas9 HDR mediated knock-in of human NPM1ca-eGFP (NPM1c type A) in mouse HOXB8-ER–immortalized cell line. The CRISPR knock-in results in the replacement of exon 12 and 3′UTR of mouse Npm1 genes to human NPM1c exon with eGFP and 3′UTR of mouse Npm1 gene. B, Two-color western blot showing the presence of both NPM1ca-GFP and NPM1-WT in HOXB8 NPM1cA-eGFP cell line clones 4, 12, and 18. C, Confocal image of NPM1ca-eGFP clone 12 on the cytoplasm and nuclear localization of NPM1ca-eGFP. Scale bar in (i), 10 μm. Scale bar in (ii), 5 μm. D, Volcano plot showing the differential expressed genes in NPM1ca-GFP clones vs. parental HOXB8-ER cell lines. The horizontal dashed line indicates the cutoff for a P = 0.01. The vertical dashed line indicates the 1.5-fold cutoff for fold change. E, Table of mean TPM value of HoxA/B cluster genes as well as Irx3, Irx5 in NPM1ca clones (n = 3) and parental cell HOXB8-ER (n = 2) cell lines. F, Heat map of Z-score of differentially expressed hematopoietic transcriptional factors. G, NPM1c, H3K27ac, and H3k27me3 binding profile on genes with NPM1ca binding (n = 4,734) in NPM1ca clone 12 cells. H, IGV view of NPM1c, H3K27ac, and H3K27me3's enrichment and distribution at HoxA cluster of NPM1ca clone 12 and HOXB8-ER parental cell lines. The blue shaded area indicates the HoxA cluster from Hoxa1 to Hottip. I and J, Left; gene-expression alteration of Gata2 (I) and Mycn (J). Right: NPM1ca, H3K27ac, and H3K27me3's enrichment and distribution at Gata2 (I) and Mycn (J) locus in the NPM1ca clone 12 cell and HOXB8-ER parental cell line. The blue shaded area indicates the −77 enhancer of Gata2 previously reported (35–37). Mean ± SD was shown in the TPM plot. n = 3 for NPM1ca group. n = 2 for the WT (HOXB8-ER parental cell line) group. K, Box plot showing the expression level of upregulated and downregulated genes in K. Median and 25%, 75% percentile are plotted for the middle line, top, and bottom box line. Whisker indicates the maximum and minimum value in the data. L, The binding profile of NPM1c, H3K27ac, and H3K27me3 in genes upregulated and downregulated in NPM1ca clones compared with parental HOXB8-ER. The NPM1c profile plots the CUT&RUN data of NPM1c from NPM1ca-GFP clone 12 cells. H3K27ac and H3K27me3 profiles plot the CUT&RUN data from the parental HOXB8-ER cell line. A heat map showing TPM of the corresponding genes in NPM1ca-GFP clones and parental HOXB8-ER cell line is shown on the right. Upregulated genes and downregulated genes are filtered only by P < 0.05. The gene-expression fold change was omitted.
Figure 4.
NPM1c's hijacking of active transcription is cell-type specific and depends on cell type–specific chromatin state. A, The scheme of CRISPR–Cas9 HDR-mediated knockin of human NPM1ca-eGFP (NPM1c type A) in a mouse HOXB8-ER–immortalized cell line. The CRISPR knockin results in the replacement of exon 11 and 3′ UTR of mouse Npm1 genes to human NPM1c exon with eGFP and 3′ UTR of mouse Npm1 gene. ChIP, chromatin immunoprecipitation; sgRNA, single-guide RNA. B, Two-color Western blot showing the presence of both NPM1ca-GFP and NPM1-WT in HOXB8 NPM1cA-eGFP cell line clones 4, 12, and 18. C, Confocal image of NPM1ca-eGFP clone 12 on the cytoplasm and nuclear localization of NPM1ca-eGFP. Scale bar = 10 μm. D, Volcano plot showing the differentially expressed genes in NPM1ca-GFP clones vs. parental HOXB8-ER cell lines. The horizontal dashed line indicates the cutoff for P = 0.01. The vertical dashed line indicates the 1.5-fold cutoff for fold change. E, Table of mean transcripts per kilobase million (TPM) value of HoxA/B cluster genes as well as Irx3 and Irx5 in NPM1ca clones (n = 3) and HOXB8-ER parental cell lines (n = 2). F, Heat map of Z-score of differentially expressed hematopoietic transcriptional factors. G, The NPM1c, H3K27ac, and H3K27me3 binding profiles on genes with NPM1ca binding (n = 4,734) in NPM1ca clone 12 cells. TES, transcriptional end site. H, Integrative Genomics Viewer view of NPM1c, H3K27ac, and H3K27me3 enrichment and distribution at the HoxA cluster of NPM1ca clone 12 and HOXB8-ER parental cell lines. The blue shaded area indicates the HoxA cluster from Hoxa1 to Hottip.I and J, Left, gene expression alteration of Gata2 (I) and Mycn (J). Right, NPM1ca, H3K27ac, and H3K27me3 enrichment and distribution at the Gata2 (I) and Mycn (J) locus in the NPM1ca clone 12 cell and HOXB8-ER parental cell line. The blue shaded area indicates the −77 enhancer of Gata2 previously reported (35–37). Mean ± SD is shown in the TPM plot. n = 3 for NPM1ca group. n = 2 for the WT (HOXB8-ER parental cell line) group. K, Box plots showing the expression level of upregulated and downregulated genes. Median, 25th percentile, and 75th percentile are plotted for the middle, top, and bottom box lines. Whisker indicates the maximum and minimum value in the data. L, The binding profiles of NPM1c, H3K27ac, and H3K27me3 in genes upregulated and downregulated in NPM1ca clones compared with parental HOXB8-ER in K. The NPM1c profile plots the CUT&RUN data of NPM1c from NPM1ca-GFP clone 12 cells. H3K27ac and H3K27me3 profiles plot the CUT&RUN data from the parental HOXB8-ER cell line. A heat map showing TPM of the corresponding genes in NPM1ca-GFP clones and the parental HOXB8-ER cell line is shown on the right. Upregulated genes and downregulated genes are filtered only by P < 0.05. The gene expression fold change was omitted.
Figure 5. XPO1 nuclear export inhibition displaces NPM1c from chromatin. A, The binding profile of NPM1c, XPO1, and H3K27ac at NPM1c-binding genes in OCI-AML3 cells from −3 kb TSS to + 3 kb TES. B, The peak overlap between NPM1c and XPO1 peaks (left) and genes with TSS peak (right) in OCI-AML3 NPM1c degron 2 cells. C, Coimmunoprecipitation of NPM1c and XPO1 in OCI-AML3 cells. D, Confocal immunofluorescence image of colocalization of both NPM1ca-eGFP and XPO1 in NPM1ca-eGFP HOXB8 cells. DAPI was used to stain the DNA of the nucleus. E and F, NPM1c (E) and XPO1 (F) binding profile in 6,312 NPM1c binding genes with the treatment of 500 nmol/L dTAG-13 and 25 nmol/L selinexor for 24 hours in OCI-AML3 NPM1c degron 2 cells. −5 kb TSS to + 5 kb TES. G, IGV view of NPM1c and XPO1 enrichment and distribution at HOXA cluster, MEIS1, HOXB cluster in OCI-AML3 NPM1c degron 2 cells with treatment of 500 nmol/L dTAG-13 and 25 nmol/L selinexor. H, Venn diagram showing the overlap between the downregulated genes in dTAG-13 and selinexor treatment. The representative overlapping genes are listed. P value is calculated by the Fisher exact test for 2 × 2 contingency table. I, The volcano plot shows the differential transcription genes on the gene body Bru-seq reads with the treatment of 12 hours 25 nmol/L selinexor in OCI-AML3 NPM1c degron 2 cells. The horizontal dashed line indicates the cutoff for a P = 0.01. The vertical dashed line indicates the 1.5-fold cutoff for fold change in gene expression. J, The Bru-seq reads of nascent transcription at MEIS1(left) and LHX2(right) locus. K, Two color confocal fluorescence images of U2OS LacO-array cell cotransfected with EYFP-LacI with mCherry-XPO1 (top). And images of cells cotransfected with EYFP-NPM1c-LacI and mCherry-XPO1 (bottom). LacO-array locus is circled out and magnified LacO-array locus images are shown at the lower left part of the image. Nucleus was annotated in bottom images. L, Enrichment of mCherry signal quantification at the LacO-array locus in the cells transfected in K. Mean ± SD is shown. P value is calculated by the Student t test.
Figure 5.
XPO1 nuclear export inhibition displaces NPM1c from chromatin. A, The binding profiles of NPM1c, XPO1, and H3K27ac at NPM1c binding genes in OCI-AML3 cells from −3 kb TSS to +3 kb transcriptional end site (TES). B, The peak overlap between NPM1c and XPO1 peaks (left) and genes with TSS peak (right) in OCI-AML3 NPM1c degron 2 cells. C, Coimmunoprecipitation (IP) of NPM1c and XPO1 in OCI-AML3 cells. D, Confocal immunofluorescence image of colocalization of NPM1ca-eGFP and XPO1 in NPM1ca-eGFP HOXB8 cells. DAPI was used to stain the DNA of the nucleus. Scale bar = 10 μm. E and F, The NPM1c (E) and XPO1 (F) binding profiles in 6,312 NPM1c binding genes with 500 nmol/L dTAG-13 and 25 nmol/L selinexor treatment for 24 hours in OCI-AML3 NPM1c degron 2 cells (−5 kb TSS to + 5 kb TES). G, Integrative Genomics Viewer view of NPM1c and XPO1 enrichment and distribution at the HOXA cluster, MEIS1, and the HOXB cluster in OCI-AML3 NPM1c degron 2 cells with 500 nmol/L dTAG-13 and 25 nmol/L selinexor treatment.H, Venn diagram showing the overlap between the downregulated genes in dTAG-13 and selinexor treatment. The representative overlapping genes are listed. P value is calculated by the Fisher exact test for 2 × 2 contingency table. I, The volcano plot shows the differential transcription genes on the gene body Bru-seq reads with 12 hours of 25 nmol/L selinexor treatment in OCI-AML3 NPM1c degron 2 cells. The horizontal dashed line indicates the cutoff for P = 0.01. The vertical dashed line indicates the 1.5-fold cutoff for fold change in gene expression. J, The Bru-seq reads of nascent transcription at the MEIS1 (left) and LHX2 (right) locus. RPKM, reads per kilobase million. K, Two color confocal fluorescence images of a U2OS LacO array cell cotransfected with EYFP-LacI with mCherry-XPO1 (top), and images of cells cotransfected with EYFP-NPM1c-LacI and mCherry-XPO1 (bottom). The LacO array locus is circled, and magnified LacO array locus images are shown at the lower left part of the image. The nucleus (nuc) is annotated in the bottom images. L, Enrichment of mCherry signal quantification at the LacO array locus in the cells transfected in K. Mean ± SD is shown. P value is calculated by the Student t test.
Figure 6. XPO1 inhibition and synergizes with Menin inhibitor in NPM1c leukemia treatment. A, HOXA9, HOXA10, and HOXB4 relative expression level after the treatment of 50 nmol/L MI-3454, 25 nmol/L eltanexor, and combination of the two in OCI-AML3 cells. n = 3; mean ± SEM is shown. P value is calculated by one-way ANOVA test with Turkey test on all pairwise comparison between treatment groups. N.S: not significant; *, P < 0.05; **, P < 0.01; ***, P < 0.001. B, Differentiation (CD11b flow cytometry) induced by 50 nmol/L MI-3454, 25 nmol/L eltanexor, and combination of the two in OCI-AML3 cells in 7-day treatment. C, In vitro colony-forming assay of NPM1c AML blast with DMSO, 50 nmol/L MI3454, 25 nmol/L eltanexor, and the combination. n = 3, Mean ± SD is shown. P value is calculated by one-way ANOVA test with Turkey test on all pairwise comparison between treatment groups. n = 2 for AML-5317. n = 3 for AML-557. N.S: not significant; *, P < 0.05; **, P < 0.01; ***, P < 0.001. D, Leukemic burden assay scheme with NSGS mouse (top). Leukemia burden after the vehicle, MI-3454, eltanexor, and combination treatment (bottom). Mean ± SD was shown. The number of mice in each group is listed. P value is calculated by t test of hCD45 engraftment at day 84 after transplantation comparing between the combination group and all other groups. E, The normal differentiation process in hematopoiesis. During the normal hematopoiesis process, the HOXA/B cluster and MEIS1 are step-wise silenced through chromatin modification. First, in the HSPCs ready to differentiate, active histone acetylation mark will be removed by HDACs. Then during terminal differentiation, heterochromatin marks like H3K27me3 will accumulate in HOXA/B cluster and MEIS1 to fully silence HOXA/B cluster and MEIS1. This will ensure the proper shutdown of stem cell self-renewal genes and prevent the ectopic expression of the HOXA/B cluster and MEIS1. F, When NPM1c mutation occurs in the leukemia cell-of-origin (likely HSPCs), the NPM1c protein will form multicomponent condensate through multivalent heterotypic interactions. This formation of condensate will lead to transcriptional amplification of the HOXA/B cluster and MEIS1 genes, and prevent the initial step during normal hematopoiesis to silence the gene by HDACs. This transcriptional hijacking by NPM1c will not only lead to the arrest of gene expression at the HSPC stage and will also block the differentiation initiated by HDACs.
Figure 6.
XPO1 inhibition synergizes with Menin inhibitor in NPM1c leukemia treatment. A,HOXA9, HOXA10, and HOXB4 relative expression levels after treatment with 50 nmol/L MI-3454, 25 nmol/L eltanexor, and combination of the two in OCI-AML3 cells. n = 3; mean ± SEM is shown. P value is calculated by one-way ANOVA test with Tukey test on all pairwise comparisons between treatment groups. *, P < 0.05; **, P < 0.01; ***, P < 0.001. B, Differentiation (CD11b flow cytometry) induced by 7-day treatment with 50 nmol/L MI-3454, 25 nmol/L eltanexor, and combination of the two in OCI-AML3 cells. C,In vitro colony-forming assay of NPM1c AML blasts with DMSO, 50 nmol/L MI3454, 25 nmol/L eltanexor, and the combination. n = 3; mean ± SD is shown. P value is calculated by one-way ANOVA test with Tukey test on all pairwise comparison between treatment groups. n = 2 for AML-5317. n = 3 for AML-557. n.s., not significant; *, P < 0.05; **, P < 0.01; ***, P < 0.001. D, Leukemic burden assay scheme with NSGS mice (left). Leukemia burden after vehicle, MI-3454, eltanexor, and combination treatment (right). Mean ± SD is shown. The number of mice in each group is listed. P value is calculated by t test of hCD45 engraftment at day 84 after transplantation comparing between the combination group and all other groups. E, The normal differentiation process in hematopoiesis. During the normal hematopoiesis process, the HOXA/B cluster and MEIS1 are stepwise silenced through chromatin modification. First, in the HSPCs ready to differentiate, active histone acetylation marks will be removed by HDACs. Then during terminal differentiation, heterochromatin marks like H3K27me3 will accumulate in the HOXA/B cluster and MEIS1 to fully silence the HOXA/B cluster and MEIS1. This will ensure the proper shutdown of stem cell self-renewal genes and prevent the ectopic expression of the HOXA/B cluster and MEIS1.F, When NPM1c mutation occurs in the leukemia cell of origin (likely HSPCs), the NPM1c protein will form multicomponent condensate through multivalent heterotypic interactions. This formation of condensate will lead to transcriptional amplification of the HOXA/B cluster and MEIS1 genes and prevent the initial step during normal hematopoiesis to silence the gene by HDACs. This transcriptional hijacking by NPM1c will not only lead to the arrest of gene expression at the HSPC stage but also block the differentiation initiated by HDACs. TF, transcription factor.

Comment in

Comment on

Similar articles

Cited by

References

    1. Brunetti L, Gundry MC, Goodell MA. New insights into the biology of acute myeloid leukemia with mutated NPM1. Int J Hematol 2019;110:150–60. - PubMed
    1. Falini B, Brunetti L, Sportoletti P, Martelli MP. NPM1-mutated acute myeloid leukemia: from bench to bedside. Blood 2020;136:1707–21. - PubMed
    1. Falini B, Nicoletti I, Martelli MF, Mecucci C. Acute myeloid leukemia carrying cytoplasmic/mutated nucleophosmin (NPMc+ AML): biologic and clinical features. Blood 2007;109:874–85. - PubMed
    1. Grisendi S, Mecucci C, Falini B, Pandolfi PP. Nucleophosmin and cancer. Nat Rev Cancer 2006;6:493–505. - PubMed
    1. Scott DD, Oeffinger M. Nucleolin and nucleophosmin: nucleolar proteins with multiple functions in DNA repair. Biochem Cell Biol 2016;94:419–32. - PubMed