Editorial
. 2023 Mar 1;13(3):746-765.
doi: 10.1158/2159-8290.CD-22-0366.

Mutant NPM1 Directly Regulates Oncogenic Transcription in Acute Myeloid Leukemia

Affiliations
Editorial

Mutant NPM1 Directly Regulates Oncogenic Transcription in Acute Myeloid Leukemia

Hannah J Uckelmann et al. Cancer Discov. .

Abstract

The dysregulation of developmental and stem cell-associated genes is a common phenomenon during cancer development. Around half of patients with acute myeloid leukemia (AML) express high levels of HOXA cluster genes and MEIS1. Most of these AML cases harbor an NPM1 mutation (NPM1c), which encodes for an oncoprotein mislocalized from the nucleolus to the cytoplasm. How NPM1c expression in hematopoietic cells leads to its characteristic gene-expression pattern remains unclear. Here, we show that NPM1c directly binds to specific chromatin targets, which are co-occupied by the histone methyltransferase KMT2A (MLL1). Targeted degradation of NPM1c leads to a rapid decrease in gene expression and loss of RNA polymerase II, as well as activating histone modifications at its targets. We demonstrate that NPM1c directly regulates oncogenic gene expression in collaboration with the MLL1 complex and define the mechanism by which MLL1-Menin small-molecule inhibitors produce clinical responses in patients with NPM1-mutated AML.

Significance: We uncovered an important functional role of mutant NPM1 as a crucial direct driver of oncogenic gene expression in AML. NPM1c can bind to chromatin and cooperate with the MLL complex, providing the first functional insight into the mechanism of Menin-MLL inhibition in NPM1c leukemias. See related article by Wang et al., p. 724. This article is highlighted in the In This Issue feature, p. 517.


Figures

Figure 1.
Figure 1.. Identification of NPM1c chromatin targets through targeted degradation.
A, Experimental overview of dTAG system. B, CD11b mean fluorescence intensity after 1 to 7 days of dTAG-13 treatment (500 nM) determined by FACS. Representative experiment of n=3 biological replicates. n=3 technical replicates plotted. C, Percent of Annexin V and DAPI double positive apoptotic cells determined by FACS. Representative experiment of n=3 biological replicates. n=3 technical replicates plotted. D, Representative immunoblot of 40 ug of cytoplasmic and nuclear fractions of OCI-AML3-NPM1c-FKBP12 cells probed for mutant NPM1c, total NPM1, Vinculin, and Histone 3. E, Quantification of NPM1c-Ab and NPM1-Ab bands from n=4 biological replicates of immunoblot of cytoplasmic and nuclear fractions from OCI-AML3-NPM1c-FKBP12 cells. F, Gene tracks of NPM1c-Ab and NPM1-Ab ChIPseq signal following 24 hours of dTAG-13 treatment (500 nM) in OCI-AML3-NPM1c-FKBP12 cells. Representative plot of n=2 biological replicates shown. G, List of NPM1c chromatin targets in OCI-AML3 cells. H, Gene tracks of ChIPseq signal of an NPM1 wildtype control PDX and two NPM1c mutant PDX using NPM1c-Ab and NPM1-Ab. I, Heatmap showing gene expression changes of PDX derived NPM1c targets in NPM1c versus wildtype NPM1 patient samples from the BEAT AML cohort. J, Gene set enrichment analysis showing enrichment of the expression of PDX specific NPM1c target genes (n=54, Supplementary Table S2) in NPM1c compared to NPM1wt patient samples from publicly available gene expression data from the BEAT AML cohort. ns p > 0.5; *p % 0.05; **p % 0.01; ***p % 0.001; and ****p % 0.001 (Mann-Whitney test).
Figure 2.
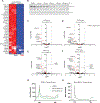
Figure 2.. NPM1c regulates transcription of its chromatin targets.
A, Heatmap of differentially expressed NPM1c target genes at 24 hours post dTAG-13 treatment (500 nM) as measured by RNAseq in OCI-AML3-NPM1c-FKBP12 cells. B, Immunoblot of cell lysate from OCI-AML3-NPM1c-FKBP12 cells treated with dTAG-13 (500 nM) for 15, 30, 60, 120, and 180 min probed with NPM1c-Ab and anti-Vinculin. n=2 technical replicates. C and D, Volcano plot of SLAM-seq data showing −log10 P-values versus log2 fold changes in OCI-AML3-NPM1c-FKBP12 cells 30 minutes (C) or 60 minutes (D) post dTAG-13 treatment (500 nM). n=3 biological replicates. E and F, Volcano plot of PRO-seq data showing −log10 P-values versus log2 fold changes in OCI-AML3-NPM1c-FKBP12 cells 30 minutes (E) or 60 minutes (F) post dTAG-13 treatment (500 nM). n=2 biological replicates. G, Average metagene plots of PRO-seq read density from TSS to TES of NPM1c target genes after dTAG-13 treatment (500 nM). n=2 biological replicates. H, Average metagene plots of PRO-seq read density from TSS to TES of non-NPM1 target genes after dTAG-13 treatment (500 nM). n=2 biological replicates.
Figure 3.
Figure 3.. NPM1c loss induces rapid changes in chromatin occupancy of Pol II and CDK9.
A, Gene tracks of Pol II, CDK9, DOT1L, and H3K27ac ChIPseq signal following 24 hours of DMSO or dTAG-13 treatment (500 nM) in OCI-AML3-NPM1c-FKBP12 cells. Representative plot from n=2 biological replicates shown. B-D, Log2 fold change of RNA Pol II (B), CDK9 (C), and H3K27ac (D) ChIPseq signal versus gene expression (RNAseq) of OCI-AML3-NPM1c-FKBP12 cells treated with dTAG-13 (500 nM) for 24 h. NPM1c targets labeled in red. Representative plot from n=2 biological replicates shown. E, ChIP qPCR of H3K9ac after 24 h of dTAG-13 treatment (500 nM) in OCI-AML3-NPM1c-FKBP12 cells. HOXA9 and Gene desert are shown relative to GAPDH. Data represent the mean and standard deviation of n=3 technical replicates. F, Log2 fold change of DOT1L versus gene expression (RNAseq) of OCI-AML3-NPM1c-FKBP12 cells treated with dTAG-13 (500 nM) for 24 h. NPM1c targets labeled in red. Representative plot from n=2 biological replicates shown. G, ChIP qPCR of H3K27me3 after 24 h of dTAG-13 treatment (500 nM) in OCI-AML3-NPM1c-FKBP12 cells. HOXA10 and Gene desert are shown relative to GAPDH. Data represent the mean and standard deviation of n=3 technical replicates. ns p > 0.5; *p % 0.05; **p % 0.01; ***p % 0.001; and ****p % 0.001 (Mann-Whitney test).
Figure 4.
Figure 4.. NPM1c chromatin binding is mediated by acidic stretch 2.
A, CRISPR domain scanning score of each sgRNA (dots) and smoothened score (line) of NPM1c tiling screen in OCI-AML3-Cas9 single cell clone 1 or MOLM13-Cas9 cells at 14 days of culture. Negative control sgRNAs shown in green, killing control sgRNAs shown in red. CRISPR Screen was performed in two independent single cell OCI-AML3-Cas9 clones, representative plot shown. B, Experimental overview of transient overexpression of different NPM1c mutants in 293T cells. C, Maximum intensity projection images of confocal stacks of 293T cells expressing NPM1wt-GFP, NPM1c-GFP, or NPM1c-ΔAS2-GFP stained with DAPI. Scale bar 10 μm. D, Gene tracks of HA ChIPseq signal of 293T cells overexpressing control MIG, NPM1c, NPM1c-HA, NPM1wt-HA, or NPM1c-ΔAS2-HA. CRM1 ChIPseq signal gene tracks shown from untransfected 293T cells. Representative plot of n=2 biological replicates shown. E, ChIP qPCR of NPM1c-Ab after 24 h of dTAG-13 treatment (500 nM) in OCI-AML3-NPM1c-FKBP12 cells expressing NPM1c or NPM1c-ΔAS2. Data represent the mean and standard deviation of n=3 technical replicates. Representative plot from n=2 biological replicates shown. ns p > 0.5; *p % 0.05; **p % 0.01; ***p % 0.001; and ****p % 0.001 (Mann-Whitney test).
Figure 5.
Figure 5.. CRM1 is important for the genome-wide chromatin recruitment of NPM1c.
A, CRM1 chromatin loading determined by CRM1 ChIPseq in 293T cells. 293T specific NPM1c targets labeled in red. B, CRM1 chromatin loading determined by CRM1 ChIPseq in OCI-AML3 cells. OCI-AML3 specific NPM1c targets labeled in red. Representative plot of n=2 biological replicates shown. Representative plot of n=2 biological replicates shown. C, Log2 fold change of CRM1 ChIPseq signal versus gene expression (RNAseq) of OCI-AML3-NPM1c-FKBP12 cells treated with dTAG-13 (500 nM) for 24 h. NPM1c targets labeled in red. D, Immunoblot showing NPM1c, CRM1, and GAPDH protein levels 24 h post dTAG-13 treatment (500nM) in OCI-AML3-FKBP12 cells. Percentage of normalized band intensities indicated below. n=3 biological replicates. E, Relative gene expression of HOXA9 and MEIS1 in OCI-AML3 cells treated with Selinexor (100 nM) for 6 h. Data represent mean and standard deviation of n=3 biological replicates. F, Gene tracks of CRM1 and NPM1c-Ab ChIPseq signal from OCI-AML3 cells treated with Selinexor treatment (100 nM) for 6 hours. Representative plot of n=2 biological replicates shown. G, Log2 fold change in NPM1c-Ab ChIPseq signal after 24 h dTAG-13 (500 nM) in OCI-AML3-NPM1c-FKBP12 versus 6 h Selinexor treatment OCI-AML3. NPM1c targets labeled in red. Representative plot of n=2 biological replicates shown. H, Immunoblot of co-immunoprecipitation of NPM1c-Ab from the chromatin fraction of OCI-AML3 cells probed for NPM1c, CRM1, and MLL1. Representative immunoblot of n=3 biological replicates shown. ns p > 0.5; *p % 0.05; **p % 0.01; ***p % 0.001; and ****p % 0.001 (Mann-Whitney test).
Figure 6.
Figure 6.. NPM1c chromatin occupancy is dependent on Menin-MLL interaction.
A, MLL1 chromatin loading in OCI-AML3 cells determined by ChIPseq. NPM1c targets labeled in red. Representative plot of n=3 biological replicates shown. B, Gene tracks of NPM1c-Ab, NPM1-Ab, CRM1, Pol II, DOT1L, MLL1, and Menin ChIPseq signal following 4 days of VTP-50469 treatment (330 nM) in OCI-AML3 cells. MLL1 and Menin ChIPseq data from previously published study (GSE129638) were used. C, Log2 fold change of NPM1c occupancy versus MLL1 occupancy determined by ChIPseq after 4 days of VTP-50469 treatment (330 nM) in OCI-AML3 cells. NPM1c targets labeled in red. Representative plot of n=2 biological replicates shown. D, Log2 fold change of NPM1c occupancy determined by ChIPseq versus gene expression (RNAseq) after 4 days of VTP-50469 treatment (330 nM) in OCI-AML3 cells. NPM1c targets labeled in red. Representative plot of n=2 biological replicates shown. E, Volcano plot of PRO-seq data showing −log10 P-values versus log2 fold changes in OCI-AML3-NPM1c-FKBP12 cells 48 hours post VTP-50469 treatment (330 nM). NPM1c targets labeled in red. n=2 biological replicates. F and G, PRO-seq read density at IGF2BP2 locus (F) and HOXA cluster (G) 48 hours post VTP-50469 treatment (330 nM). n=2 biological replicates. H, Representative experiment of n=3 biological replicates of CD11b surface expression of OCI-AML3 cells treated with Selinexor (30 nM), VTP-50469 (10 nM), or both for 3 days. n=3 technical replicates plotted. I, MEIS1 gene expression analysis of OCI-AML3 cells treated with Selinexor (30 nM), VTP-50469 (10 nM), or both for 3 days, normalized to DMSO. Data represent the mean and standard deviation of n=4 biological replicates. ns p > 0.5; *p % 0.05; **p % 0.01; ***p % 0.001; and ****p % 0.001 (Mann-Whitney test).

Comment in

Comment on

References

    1. Döhner H, Weisdorf DJ, Bloomfield CD. Acute Myeloid Leukemia. N Engl J Med. 2015;373:1136–52. - PubMed
    1. Papaemmanuil E, Gerstung M, Bullinger L, Gaidzik VI, Paschka P, Roberts ND, et al. Genomic Classification and Prognosis in Acute Myeloid Leukemia. N Engl J Med. 2016;374:2209–21. - PMC - PubMed
    1. Falini B, Brunetti L, Sportoletti P, Paola Martelli M. NPM1-mutated acute myeloid leukemia: from bench to bedside. Blood. 2020;136:1707–21. - PubMed
    1. Falini B, Mecucci C, Tiacci E, Alcalay M, Rosati R, Pasqualucci L, et al. Cytoplasmic nucleophosmin in acute myelogenous leukemia with a normal karyotype. N Engl J Med. 2005;352:254–66. - PubMed
    1. Gu X, Ebrahem Q, Mahfouz RZ, Hasipek M, Enane F, Radivoyevitch T, et al. Leukemogenic nucleophosmin mutation disrupts the transcription factor hub that regulates granulomonocytic fates. J Clin Invest. 2018;128:4260–79. - PMC - PubMed