. 2022 Dec:66:101648.
doi: 10.1016/j.molmet.2022.101648. Epub 2022 Nov 28.

Low aerobic capacity in McArdle disease: A role for mitochondrial network impairment?

Affiliations

Low aerobic capacity in McArdle disease: A role for mitochondrial network impairment?

M Villarreal-Salazar et al. Mol Metab. 2022 Dec.

Abstract

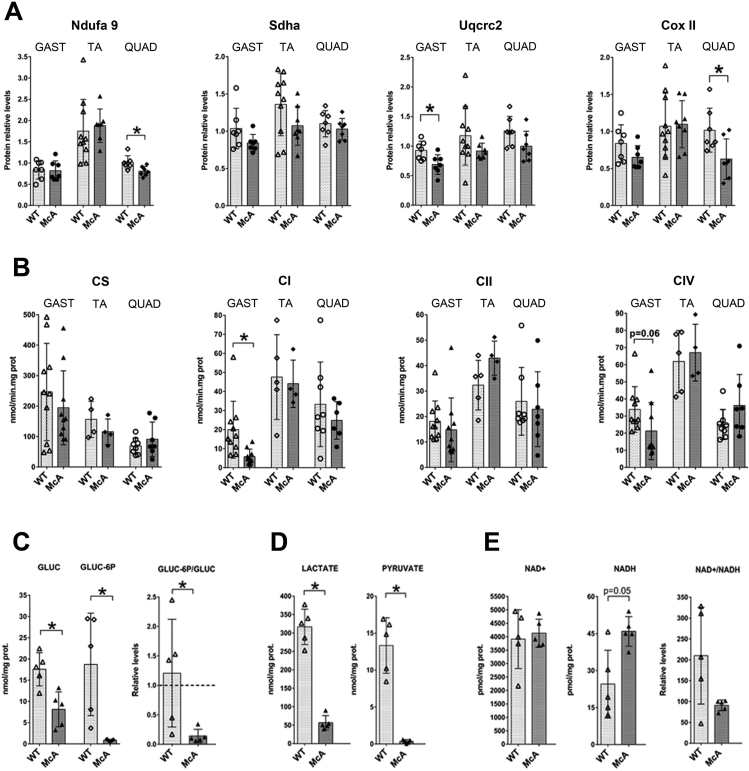
Background: McArdle disease is caused by myophosphorylase deficiency and results in complete inability for muscle glycogen breakdown. A hallmark of this condition is muscle oxidation impairment (e.g., low peak oxygen uptake (VO2peak)), a phenomenon traditionally attributed to reduced glycolytic flux and Krebs cycle anaplerosis. Here we hypothesized an additional role for muscle mitochondrial network alterations associated with massive intracellular glycogen accumulation.

Methods: We analyzed in depth mitochondrial characteristics-content, biogenesis, ultrastructure-and network integrity in skeletal-muscle from McArdle/control mice and two patients. We also determined VO2peak in patients (both sexes, N = 145) and healthy controls (N = 133).

Results: Besides corroborating very poor VO2peak values in patients and impairment in muscle glycolytic flux, we found that, in McArdle muscle: (a) damaged fibers are likely those with a higher mitochondrial and glycogen content, which show major disruption of the three main cytoskeleton components-actin microfilaments, microtubules and intermediate filaments-thereby contributing to mitochondrial network disruption in skeletal muscle fibers; (b) there was an altered subcellular localization of mitochondrial fission/fusion proteins and of the sarcoplasmic reticulum protein calsequestrin-with subsequent alteration in mitochondrial dynamics/function; impairment in mitochondrial content/biogenesis; and (c) several OXPHOS-related complex proteins/activities were also affected.

Conclusions: In McArdle disease, severe muscle oxidative capacity impairment could also be explained by a disruption of the mitochondrial network, at least in those fibers with a higher capacity for glycogen accumulation. Our findings might pave the way for future research addressing the potential involvement of mitochondrial network alterations in the pathophysiology of other glycogenoses.

Keywords: Aerobic capacity; Cytoskeleton and mitochondrial network; Glycogen; McArdle disease; Skeletal muscle.


Figures

Figure 1
Figure 1
Histopathological analysis of the skeletal muscle from the McArdle (p.R50∗/p.R50Pygm) mouse model. (A) Histochemical, immunohistochemical and immunofluorescence analysis of the skeletal muscle from McArdle mice; i) and ii) H&E staining in the quadriceps from wild-type and McArdle mice; iii) and iv) PAS staining in the gastrocnemius from wild-type and McArdle mice; v) PAS-Diastase staining in the gastrocnemius from McArdle mice; vi) Myophosphorylase activity staining in the soleus from wild-type and McArdle mice; vii and viii) SDH and COX activity staining, respectively, in the gastrocnemius from McArdle mice; ix) and x) COXII and VDAC immunofluorescence, respectively, in the quadriceps from McArdle mice; xi) and xii) SDH activity and PAS staining, respectively, in gastrocnemius serial sections from McArdle mice; white asterisks show those fibers with high SDH activity and PAS staining; xiii) immunofluorescence showing type I (green) and IIA (red); xiv) type IIA (red) and IIX (green); and xv) type IIX (green) and IIB (red) muscle fibers in the gastrocnemius from McArdle mice; xvi) immunofluorescence staining for COXII (red) and type I fibers (green) in the gastrocnemius from McArdle mice, with yellow asterisks marking the same fibers with and without type I fiber staining; xvii) immunofluorescence staining for COXII (green) and type IIA fibers (red) in the gastrocnemius from McArdle mice, with yellow asterisks marking the same fibers with and without type IIA fiber staining; xviii) immunofluorescence staining for COXII (green) and type IIB fibers (red) in the gastrocnemius from McArdle mice, with yellow asterisks marking the same fibers with and without type IIB fiber staining; xix) immunofluorescence staining showing type IIA (pink), IIX (green), IIB (orange) muscle fibers, and DAPI (the nuclei, blue) in the tibialis anterior muscle of McArdle mice; and xx) consecutive serial section from (xix) stained with PAS; for xix) and xx) yellow asterisks mark muscle fibers with more intense PAS staining while white asterisks mark muscle fibers presenting less intense PAS staining. All scale bars correspond to 75 μm. (B) Electronic microscopy analysis of the ultrastructure integrity of mitochondria in the skeletal muscle of McArdle mice (TA). Z-line mitochondria are indicated with black arrows, while A-band mitochondria are shown with a yellow arrow. Scale bars correspond to 1 or 2 μm as indicates. Abbreviations; QUAD: quadriceps; GAST: gastrocnemius; SOL: soleus; TA: tibialis anterior; WT: wild-type; McA: McArdle; Gly: glycogen.
Figure 2
Figure 2
Cytoskeleton and mitochondrial network integrity analysis in the skeletal muscle from the McArdle (p.R50∗/p.R50 × Pygm) mouse model. (A) VDAC immunofluorescence analysis of mitochondrial network. Scale bars correspond to 25 μm. (B) Mitochondrial morphology analysis showing different mitochondrial sizes and shapes in McArdle mice; squared regions are magnified and shown in detail. Scale bars correspond to 5 μm. (C) Immunofluorescence analysis of the cytoskeleton and mitochondrial network integrity in the skeletal muscle from wild-type and McArdle mice; wild-type (i-ii) and McArdle mice (iii-iv) immunofluorescence staining of VDAC (green) and α–actinin (red); loss of α–actinin staining is clearly visible in (iii-iv), while a complete disruption of the mitochondrial network and cytoskeleton is shown in the square box in (iv). Wild-type (v-vii) and McArdle mice (viii-ix) immunofluorescence staining of VDAC (green) and α–actin (red); irregular A-band length is visible in (viii), while disrupted actin microfilaments and/or non-polymerized α–actin monomers are shown in (ix). Wild-type (x-xi) and McArdle mice (xii-xiii) immunofluorescence staining of VDAC (green) and β–actin (red); a complete disruption of the mitochondrial network and β–actin cytoskeleton structures is observed in (xii-xiii); the square box region shows isolated mitochondria and actin monomers. Wild-type (xiv-xv) and McArdle mice (xvi-xviii) immunofluorescence staining of VDAC (green) and α-tubulin (red); subsarcolemmal, as well as longitudinal and transversal interaction of microtubules with mitochondria is observed in (xiv-xv), while microtubules surrounding fiber voids and central nucleated fibers, aggregated in thick tubulin bundles or completely disrupted and/or non-polymerized are shown in (xvi-xviii). Wild-type (xix-xx) and McArdle mice (xxi-xxii) immunofluorescence staining of VDAC (red) and βII-tubulin (green); βII-tubulin aggregates in fiber voids (xxi) or surrounding centrally nucleated fibers (xxii) are observed, while irregularly dispersed βII-tubulin staining non co-localizing with mitochondria is observed in the square box (xxi). Wild-type (xxiii-xxiv) and McArdle mice (xxv-xxvi) immunofluorescence staining of VDAC (red) and plectin (green); regions surrounding fiber voids with no plectin staining are shown in (xxv-xxvi); completely disrupted mitochondrial network with the presence of isolated compact mitochondria can be seen in the square box in (xxv). All scale bars correspond to 25 μm. (D) Western blot analysis of cytoskeleton protein levels in the quadriceps from wild-type and McArdle mice (N = 7 (3 male) in both groups). As all the data followed a normal distribution according to the Shapiro–Wilk normally test, the Student's t-test was applied in all cases. Asterisk correspond to p < 0.005 in the statistic test. Abbreviations: VDAC: voltage-dependent anion channel; QUAD: quadriceps; TA: tibialis anterior; WT: wild-type; McA: McArdle; Gapdh: Glyceraldehyde-3-phosphate dehydrogenase; Amido: Amido black staining.
Figure 3
Figure 3
Altered subcellular localization of fission/fussion proteins in the skeletal muscle from the McArdle (p.R50∗/p.R50 × Pygm) mouse model. (A) Immunofluorescence analysis of mitochondrial fission/fusion proteins in the skeletal muscle from McArdle mice. Wild-type (i-ii) and McArdle mice (iii-iv) immunofluorescence staining of VDAC (green) and Drp1 (red); Drp1 is observed in close proximity to mitochondria within the network in (i-ii), while Drp1 staining co-localizes with enlarged and isolated mitochondria in (iii-iv); square boxes show magnification of the Drp1-VDAC staining co-localization, while 3D Surface reconstruction images from the square box regions using the Zen-Blue software are also shown. Wild-type (v-vi) and McArdle mice (vii-ix) immunofluorescence staining of VDAC (red) and Fis1 (green); as with Drp1, Fis1 are found in close proximity of mitochondria within the network in (v-vi), while is found co-localizing with VDAC staining in longitudinal mitochondria aggregates in (vii-ix); square regions show magnification of the VDAC-Fis1 co-localization in the aggregates. Wild-type (x-xi) and McArdle mice (xii-xiv) immunofluorescence staining of VDAC (red) and Mfn2 (green); square boxes in (x-xi) show magnification of Mfn2 staining in close proximity of mitochondria in the Z-disc, while in (xii-xiv) show magnification of Mfn2 staining located in close proximity to fiber damage, central nucleated fibers, and large glycogen depots. Wild-type (xv-xvi) and McArdle mice (xvii-xix) immunofluorescence staining of VDAC (green) and Opa1 (red); in (xv-xvi) square boxes show co-localization of Opa1 in Z-disc mitochondria, while in (xvii-xix) square boxes show Opa1 co-localization with dispersed and isolated mitochondria. Wild-type (xx-xxi) and McArdle mice (xxii-xxiv) immunofluorescence staining of VDAC (green) and calsequestrin (red); enlarged calsequestrin distribution in longitudinal bundles in comparison to wild-type mice is observed in (xxii-xxiv). All scale bars correspond to 25 μm. (B) Western blot analysis of mitochondrial fusion and fission protein levels in the quadriceps from wild-type and McArdle mice (N = 6–7 (3 male) in both groups for the different variables). For Drp1 analysis, the Student's t-test was applied as data followed a normal distribution according to the Shapiro–Wilk normally test, whereas the Mann–Whitney U-test was used for Mid49, Mfn2 and Opa1. Asterisk correspond to p < 0.005 in the statistic test. Abbreviations: Drp1: Dynamin-related protein 1; Fis1: mitochondrial fission 1 protein; Mfn2: Mitofusin 2; Opa 1: optic atrophy protein 1; Calseq: calsequestrin; Mid49: mitochondrial dynamic protein of 49 kDa; QUAD: quadriceps; TA: tibialis anterior; WT: wild-type; McA: McArdle; Gapdh: Glyceraldehyde-3-phosphate dehydrogenase; Amido: Amido black staining.
Figure 4
Figure 4
Analysis of mitochondrial biogenesis and content. (A) Analysis of mitochondrial DNA content (mtDNA) depletion in the tibialis anterior [N = 7 wild-type (71% male) and 5 McArdle mice (40% male)] and quadriceps [N = 10 wild-type (70% male) and 8 McArdle mice (63% male)] and deletions (in quadriceps) using qPCR and long PCR, respectively. (B) Western blot analysis of Tfam protein relative levels in tibialis anterior [N = 10 wild-type (50% male) and 7 McArdle mice (43% male)] and quadriceps [N = 7 wild-type (3 males) and 7 McArdle mice (3 males)]. (C) qPCR analysis of mt–Nd4 and mt-Rnr2 mRNA relative levels in tibialis anterior [N = 5–6 wild-type (3 males) and 5 McArdle mice (3 males)] and quadriceps [N = 5 wild-type (3 males) and 5 McArdle mice (3 males)]. (D) qPCR analysis of Pgc1a, Pgc1b, Ppara, Pparb and Esrra mRNA relative levels in the tibialis anterior [N = 4–5 wild-type (2–3 males) and 4–5 McArdle mice (2–3 males)] and quadriceps [N = 5–6 wild-type (50–60% male) and 4–5 McArdle mice (60–75% male)]. (E, F) Western blot analysis of Ppard, Nrf1, Nrf2, Vdac and CS protein relative levels in tibialis anterior [N = 6–7 wild-type (43–67% male) and 5–7 McArdle mice (29–40% male) and quadriceps (N = 7 (3 male) in both groups for the different proteins). When data followed a normal distribution (i.e. mtDNA quadriceps, Tfam, Ppard, Nrf1, Nrf2 quadriceps, VDAC and CS quadriceps protein levels) the Student's t-test was applied, whereas the non-parametric Mann–Whitney U-test was used for those (mtDNA tibialis anterior, mt–Nd4, mt-Rnr2, Pgc1a, Pgc1b, Ppara, Pparb, Esrra mRNA levels and Nrf2 and CS tibialis anterior protein levels) that were not normally distributed. Asterisks correspond to p < 0.005 in the statistic tests. Abbreviations: QUAD: quadriceps; TA: tibialis anterior; WT: wild-type; McA: McArdle; Tfam: transcription factor A, mitochondrial; mt–Nd4: mitochondrially encoded NADH:Ubiquinone oxidoreductase core subunit 4; mt-Rnr2: mitochondrially encoded 16 S rRNA; Pgc1a and b: PPARG Coactivator 1 alpha and beta; peroxisome proliferator activated receptor alpha and beta; Esrra: estrogen related receptor alpha; Nrf1: nuclear respiratory factor 1; Nrf2: nuclear factor erythroid 2-related factor 2; Vdac: voltage-dependent anion channel; CS: citrate synthase.
Figure 5
Figure 5
Analysis of OXPHOS protein levels and activity. (A) Western blot analysis of Ndufa9 (complex I; CI), Sdha (complex II; CII), Uqcrc2 (complex III; CIII) and CoxII (complex IV; CIV) protein relative levels in the gastrocnemius [N = 7 wild-type (57% male) and 7 McArdle mice (29% male)], tibialis anterior [N = 10 wild-type (50% male) and 8 McArdle mice (25% male)] and quadriceps (N = 7 (3 male) in both groups for the different proteins). (B) Citrate synthase and OXPHOS CI, CII and CIV activities in total tissue homogenates from gastrocnemius [N = 10 wild-type (60% male) and 10 McArdle mice (40% male)], tibialis anterior [N = 5 wild-type (60% male) and 4 McArdle mice (50% male)] and quadriceps [N = 8 wild-type (50% male) and 7 McArdle mice (57% male)]. (C, D and E) Mass spectrometry analysis of glucose, glucose-6-phosphate, lactate, pyruvate, NAD+ and NADH in total quadriceps homogenates from wild-type and McArdle mice. In these experiments, the same number of mice (N = 5) and sex distribution (40% male) was studied in the two groups. When data followed a normal distribution (Ndufa9, Sdha, Uqcrc2, and Cox II protein levels, as well as CS quadriceps activity) a Student's t-test was applied, whereas the non-parametric Mann–Whitney U-test was used when values were not normally distributed (CS activity in gastrocnemius and tibialis anterior, complex I, II and IV activities, as well as glucose, glucose-6-p, lactate, pyruvate, NAD+ and NADH levels in the quadriceps). Asterisks correspond to p < 0.005 in the statistic tests. Abbreviations: GAST: gastrocnemius; QUAD: quadriceps; TA: tibialis anterior; WT: wild-type; McA: McArdle; Ndufa9: NADH: Ubiquinone oxidoreductase subunit A9; Sdha: succinate dehydrogenase complex flavoprotein subunit A; Uqcrc2: ubiquinol-cytochrome c reductase core protein 2; Cox II: cytochrome c oxidase subunit II; CS: citrate synthase; GLUC: glucose (non-phosphorylated); GLUC-6-P: glucose-6-phosphate.
Figure 6
Figure 6
Peak oxygen uptake (VO2peak) and analysis of the cytoskeleton and mitochondrial network integrity in patients with McArdle disease. (A) VO2peak levels of patients with McArdle disease (N = 145) versus control individuals (N = 133). (B) Immunofluorescence analysis of the cytoskeleton and mitochondrial network integrity in quadriceps biopsies from two different McArdle disease patients; VDAC (red) and plectin (green) immunofluorescence staining (i-iv); VDAC (green) and α-actin (red) immunofluorescence staining (v-viii); cell nucleus (blue) are stained with DAPI. Scale bars correspond to 25 μm. (C) Consecutive quadriceps sections staining for fast muscle fibers and SDH activity; i and iii) fast muscle fibers immunohistochemical staining; ii and iv) SDH activity staining; yellow asterisks mark identical muscle fibers in i) and ii), as well as in iii) and iv). (D) Electronic microscopy analysis of mitochondria ultrastructure in quadriceps biopsies from two different McArdle disease patients. Scale bars correspond to 1 or 2 μm as indicated. Abbreviations; QUAD: quadriceps; McA: McArdle; Glcn: glycogen and Mi: mitochondria.
figs1
figs1
figs2
figs2
figs3
figs3

References

    1. Nogales-Gadea G., Pinos T., Andreu A.L., Martin M.A., Arenas J., Lucia A. Next-generation sequencing to estimate the prevalence of a great unknown: McArdle disease. Genet Med. 2015;17(8):679–680. - PubMed
    1. De Castro M., Johnston J., Biesecker L. Determining the prevalence of McArdle disease from gene frequency by analysis of next-generation sequencing data. Genet Med. 2015;17(12):1002–1006. - PMC - PubMed
    1. Munguia-Izquierdo D., Santalla A., Lucia A. Cardiorespiratory fitness, physical activity, and quality of life in patients with McArdle disease. Med Sci Sports Exerc. 2015;47(4):799–808. - PubMed
    1. Mate-Munoz J.L., Moran M., Perez M., Chamorro-Vina C., Gomez-Gallego F., Santiago C., et al. Favorable responses to acute and chronic exercise in McArdle patients. Clin J Sport Med. 2007;17(4):297–303. - PubMed
    1. Ozemek C., Laddu D.R., Lavie C.J., Claeys H., Kaminsky L.A., Ross R., et al. An update on the role of cardiorespiratory fitness, structured exercise and lifestyle physical activity in preventing cardiovascular disease and health risk. Prog Cardiovasc Dis. 2018;61(5–6):484–490. - PubMed

Publication types