. 2022 Dec 1;14(23):9466-9483.
doi: 10.18632/aging.204412. Epub 2022 Dec 1.

Identification of natural products and FDA-approved drugs for targeting cancer stem cell (CSC) propagation

Affiliations

Identification of natural products and FDA-approved drugs for targeting cancer stem cell (CSC) propagation

Gloria Bonuccelli et al. Aging (Albany NY). .

Abstract

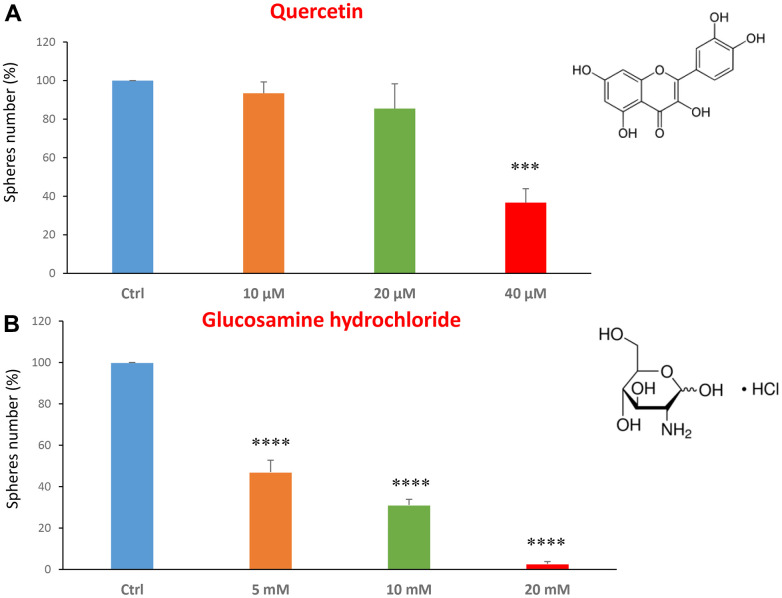
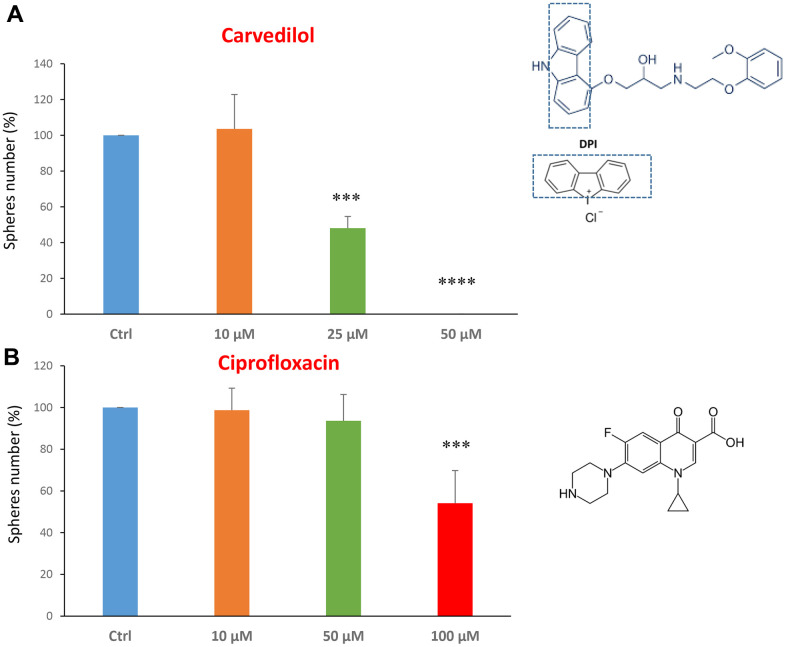
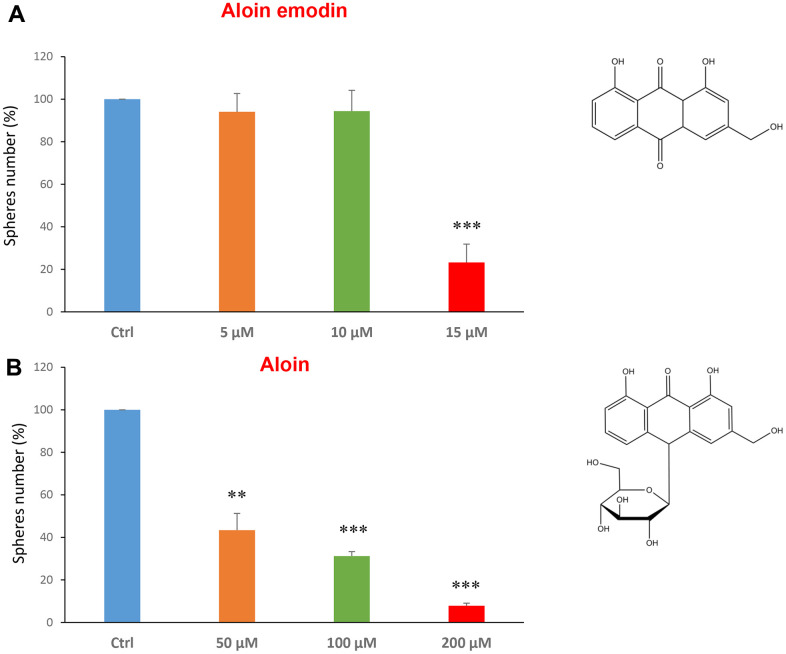
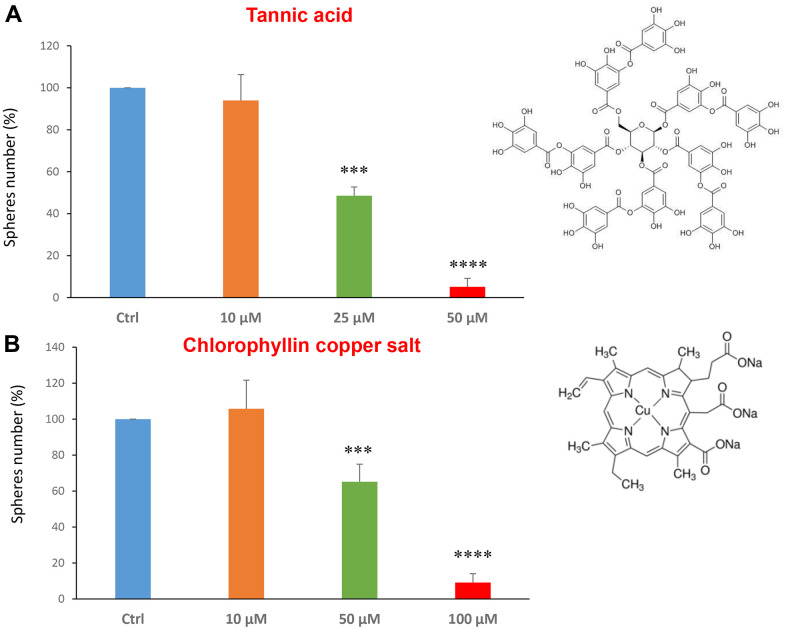
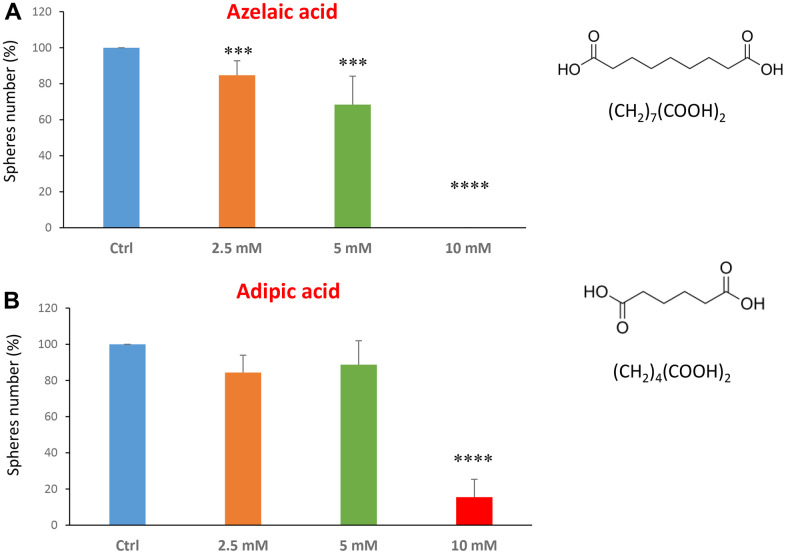
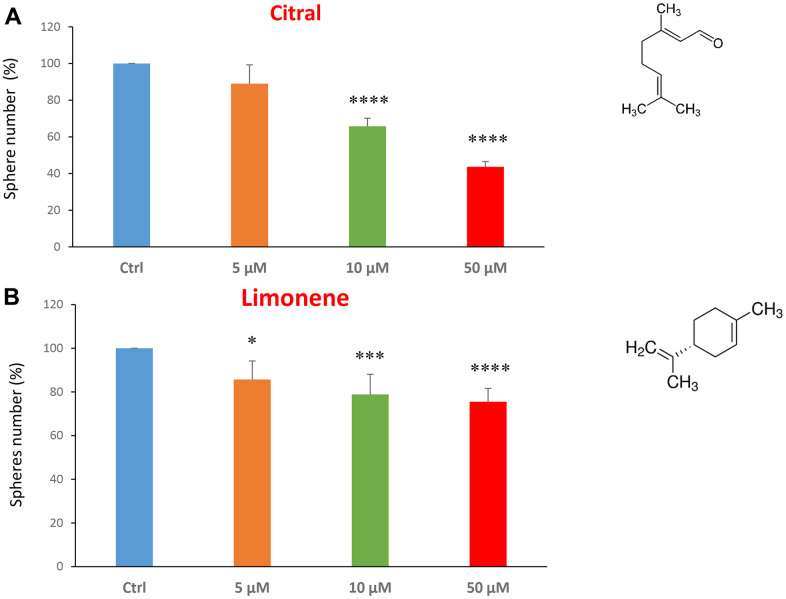
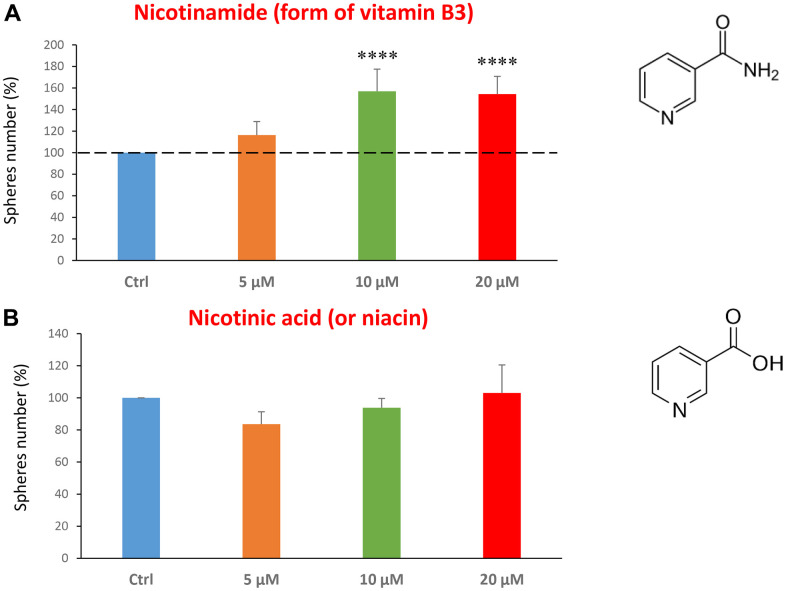
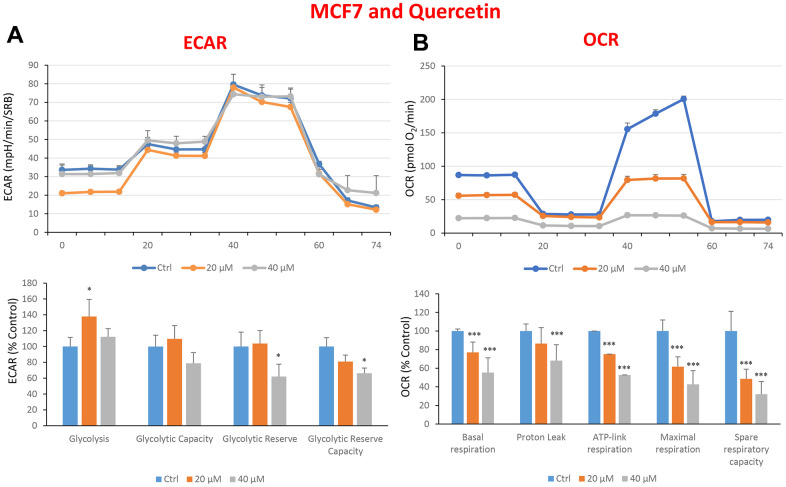
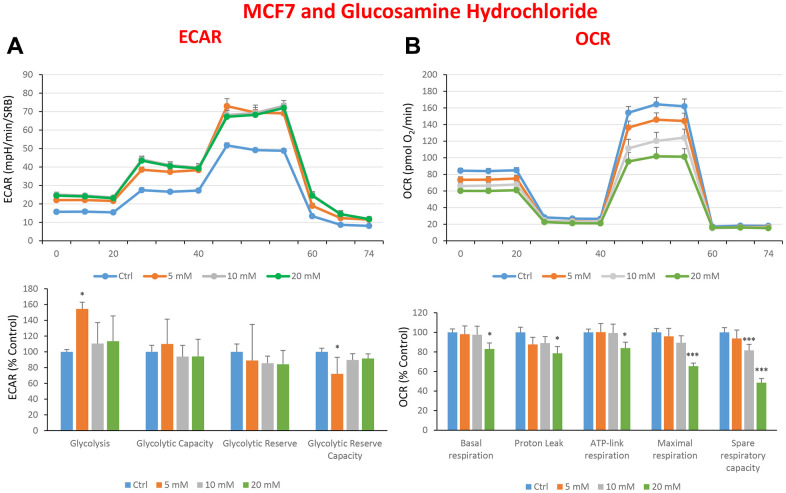
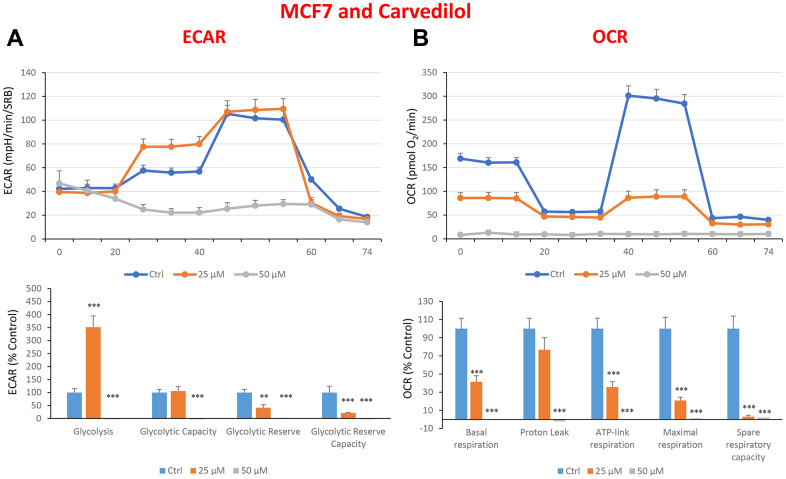
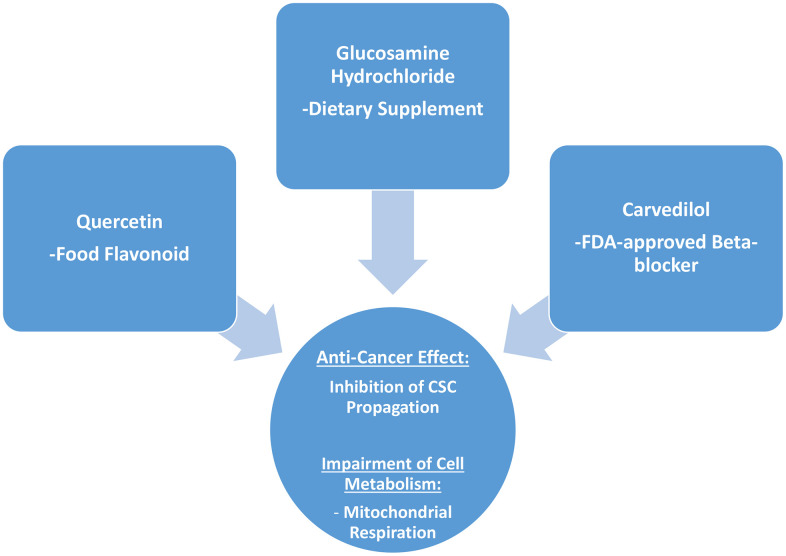
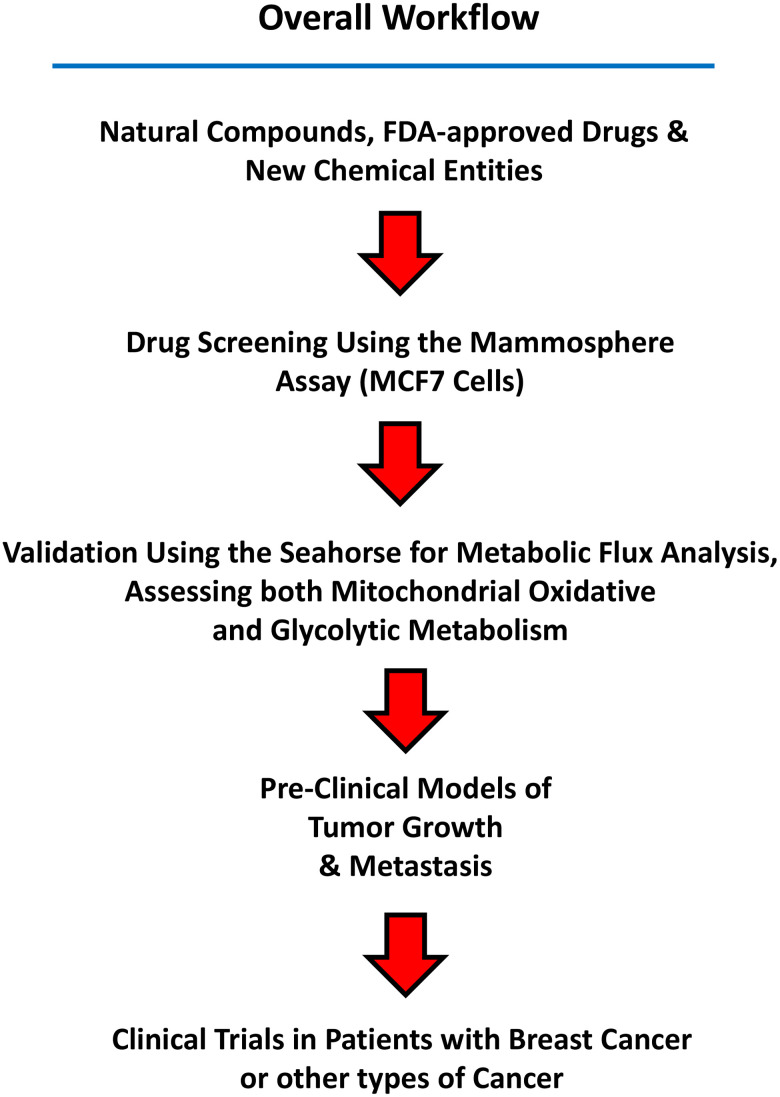
Here, we report the identification of key compounds that effectively inhibit the anchorage-independent growth and propagation of cancer stem cells (CSCs), as determined via screening using MCF7 cells, a human breast adenocarcinoma cell line. More specifically, we employed the mammosphere assay as an experimental format, which involves the generation of 3D spheroid cultures, using low-attachment plates. These positive hit compounds can be divided into 5 categories: 1) dietary supplements (quercetin and glucosamine); 2) FDA-approved drugs (carvedilol and ciprofloxacin); 3) natural products (aloe emodin, aloin, tannic acid, chlorophyllin copper salt, azelaic acid and adipic acid); 4) flavours (citral and limonene); and 5) vitamins (nicotinamide and nicotinic acid). In addition, for the compounds quercetin, glucosamine and carvedilol, we further assessed their metabolic action, using the Seahorse to conduct metabolic flux analysis. Our results indicate that these treatments can affect glycolytic flux and suppress oxidative mitochondrial metabolism (OXPHOS). Therefore, quercetin, glucosamine and carvedilol can reprogram the metabolic phenotype of breast cancer cells. Despite having diverse chemical structures, these compounds all interfere with mitochondrial metabolism. As these compounds halt CSCs propagation, ultimately, they may have therapeutic potential.

Keywords: FDA approved drugs; cancer stem cells; drug screening; mammospheres; natural compounds.


Conflict of interest statement

CONFLICTS OF INTEREST: MPL and FS hold a minority interest in Lunella Biotech, Inc.

Figures

Figure 1
Figure 1
Dietary supplements decrease CSC propagation. The effects of two dietary supplements, quercetin and glucosamine hydrochloride, are shown. (A) Note that quercetin is effective in inhibiting CSC propagation, at a concentration of 40 μM and its IC50 falls in the range of 20 and 40 μM concentration. (B) Note that glucosamine significantly decreases mammosphere number, at concentrations of 5, 10 and 20 mM. Bar graphs are shown as the mean ± SEM; t-test, two-tailed test. ***p < 0.001, ****p < 0.0001. Chemical formulae are indicated.
Figure 2
Figure 2
FDA-approved drugs decrease mammosphere formation. The effects of two FDA-approved drugs, carvedilol and ciprofloxacin, are shown. (A) Note that carvedilol is effective in inhibiting CSC propagation, at a concentration of 25 μM, its IC50, and 50 μM completely inhibits mammosphere formation. (B) Ciprofloxacin significantly decreases mammosphere number, at the concentrations of 100 μM, its IC50. Bar graphs are shown as the mean ± SEM; t-test, two-tailed test. ***p < 0.001, ****p < 0.0001. Chemical formulae are indicated.
Figure 3
Figure 3
Natural products derived from plant aloe latex decrease mammosphere formation. The effects of two natural products, aloe emodin and aloin, are shown. (A) Aloe emodin is a compound, with similar biological characteristics of aloin, but lacking a sugar moiety. Note that aloe emodin is effective in inhibiting CSC propagation, by >75% at a concentration of 15 μM. Its IC50 is between 10-25 μM. (B) Aloin or barbaloin significantly decreases mammosphere number at a concentration of 50 μM, its IC50. At 200 μM, it reduces the sphere formation by > 90%. Bar graphs are shown as the mean ± SEM; t-test, two-tailed test. **p < 0.01, ***p < 0.001. Chemical formulae are indicated.
Figure 4
Figure 4
Natural products, tannic acid and chlorophyllin, were able to decrease mammosphere formation. We tested the effects of more natural compounds, such as tannic acid and chlorophyllin copper salt. (A) Tannic acid is a type of polyphenol. Interestingly, it is effective in inhibiting CSC propagation, at concentrations >10 μM; its IC50 is 25 μM. (B) Chlorophyllin is a derivative of chlorophyll which significantly decreases the mammosphere number starting at a concentration of 50 μM and reduces propagation by > 90% at a concentration of 100 μM. Bar graphs are shown as the mean ± SEM; t-test, two-tailed test. ***p < 0.001, ****p < 0.0001. Chemical formulae are indicated.
Figure 5
Figure 5
Natural products, azelaic and adipic acids, decrease mammosphere formation. Finally, we tested the effects of two more natural compounds, such as azelaic acid and adipic acid. (A) Azelaic acid is a saturated dicarboxylic acid and it is effective in inhibiting CSC propagation, starting at a concentration of 2.5 mM, with complete inhibition at a concentration of 10 mM. (B) Adipic acid is another dicarboxylic acid that significantly blocks CSC propagation, with near complete inhibition at 10 mM, similarly to azelaic acid. Bar graphs are shown as the mean ± SEM; t-test, two-tailed test. ***p < 0.001, ****p < 0.0001. Chemical formulae are indicated.
Figure 6
Figure 6
Flavours, citral and limonene, decrease mammosphere formation. Next, we tested the effects of two flavours, such as citral and limonene. (A) Citral or lemonal is effective in inhibiting CSC propagation, starting at the concentration of 10 μM, with an IC50 near 50 μM. (B) Limonene is a flavouring that significantly decreases the mammosphere formation, but was less effective than the closely related molecule, Citral. Bar graphs are shown as the mean ± SEM; t-test, two-tailed test. *p < 0.05, ***p < 0.001, ****p < 0.0001. Chemical formulae are indicated.
Figure 7
Figure 7
Testing the efficacy of two forms of vitamin B3 on CSC propagation. (A) Nicotinamide, also known as niacinamide, significantly increases CSC propagation by >1.5-fold, at concentrations of 10 and 20 μM. (B) However, Nicotinic acid (or niacin) does not have any effect on mammosphere formation. Bar graphs are shown as the mean ± SEM; t-test, two-tailed test. ****p < 0.0001. Chemical formulae are indicated.
Figure 8
Figure 8
Treatment with quercetin preferentially reduces mitochondrial oxygen consumption rates in MCF7 cells. Cells were seeded and treated with quercetin, as described above. Briefly, cells were seeded at a density of fifteen thousand in a 96-well format. (A) Extracellular consumption rate (ECAR) was assessed by Seahorse metabolic flux analysis. A representative trace is shown in the top panel. Importantly, quercetin treatment only had minor effects on glycolysis. (B) Oxygen consumption rate (OCR) was measured by Seahorse metabolic flux analysis. A representative trace, in the top panel, shows decreased OCR in samples treated with quercetin (20 and 40 μM), versus the vehicle alone control cells. The bar graph (lower panel) shows that quercetin treatment significantly decreases the basal respiration, ATP production, maximal and spare respiration, as compared to the control cells. In panels A and B, experiments were performed three times independently, with six repeats for each replicate. Bar graphs are shown as the mean ± SEM, t-test, two-tailed test. *p < 0.05, ***p < 0.001.
Figure 9
Figure 9
Treatment with glucosamine hydrochloride reduces mitochondrial oxygen consumption rates in MCF7 cells. Cells were seeded and treated with glucosamine, as described above. Briefly, cells were seeded at a density of fifteen thousand in a 96-well format. (A) Extracellular consumption rate (ECAR) was assessed by Seahorse metabolic flux analysis. A representative trace is shown in the top panel. Importantly, glucosamine treatment only had minor effects on glycolysis. (B) Oxygen consumption rate (OCR) was measured by Seahorse metabolic flux analysis. A representative trace, in the top panel, shows decreased OCR in samples treated with glucosamine (20 mM), versus the vehicle alone control cells. The bar graph (lower panel) shows that glucosamine treatment significantly decreases the basal respiration, ATP production, maximal and spare respiration, as compared to the control cells. In panels A and B, experiments were performed three times independently, with six repeats for each replicate. Bar graphs are shown as the mean ± SEM, t-test, two-tailed test. *p < 0.05, ***p < 0.001.
Figure 10
Figure 10
Treatment with carvedilol differentially affects both glycolysis and oxygen consumption rates in MCF7 cells, in a concentration-dependent manner. Cells were seeded and treated with carvedilol, as described above. Briefly, cells were seeded at a density of fifteen thousand in a 96-well format. (A) Extracellular consumption rate (ECAR) was assessed by Seahorse metabolic flux analysis. A representative trace is shown in the top panel. Importantly, carvedilol treatment induced glycolysis by >3.5-fold at 25 μM, but showed dramatic inhibition of glycolysis at 50 μM. (B) Oxygen consumption rate (OCR) was measured by Seahorse metabolic flux analysis. A representative trace, in the top panel, shows progressive decreases in OCR in samples treated with carvedilol (25 and 50 μM), versus the vehicle alone control cells. The bar graph (lower panel) shows that carvedilol treatment significantly decreases the basal respiration, ATP production, maximal and spare respiration, as compared to the control cells. In summary, at 25 μM, carvedilol enhanced glycolysis, but inhibited mitochondrial oxygen consumption. In contrast, at 50 μM, carvedilol inhibited both glycolysis and mitochondrial oxygen consumption. In panels A and B, experiments were performed three times independently, with six repeats for each replicate. Bar graphs are shown as the mean ± SEM, t-test, two-tailed test. *p < 0.05, ***p < 0.001.
Figure 11
Figure 11
Summary: Identification of natural products and FDA-approved drugs for targeting cancer stem cell (CSC) propagation. This scheme summarizes our current results related to quercetin, glucosamine hydrochloride and carvedilol compounds and their effects on i) CSC propagation and ii) energy metabolism in MCF7 cells. Quercetin is flavonoid found in many foods, glucosamine is a dietary supplement, and carvedilol is an FDA-approved beta-blocker. Intriguingly, although these three compounds are so different in their chemical structure, they share the ability to interfere with mitochondrial metabolism and block the propagation of CSCs.
Figure 12
Figure 12
Summary of the Workflow. Candidate natural compounds, FDA-approved drugs, and/or new chemical entities are subjected to drug screening, using the 3D mammosphere assay (MCF7 cells). Positive hits are then validated as metabolic inhibitors, by using the Seahorse, to directly measure oxygen consumption and metabolic flux. Small chemical entities showing anti-mitochondrial activity can then be further validated in pre-clinical models of tumor growth and metastasis. Finally, clinical trials in patients with breast cancer (or other cancer types) can be carried out to validate in vivo that a given compound eradicates CSCs, using CSC-specific markers, such as CD44 and ALDH1 by immuno-histochemistry.

References

    1. Klonisch T, Wiechec E, Hombach-Klonisch S, Ande SR, Wesselborg S, Schulze-Osthoff K, Los M. Cancer stem cell markers in common cancers - therapeutic implications. Trends Mol Med. 2008; 14:450–60. 10.1016/j.molmed.2008.08.003 - DOI - PubMed
    1. Wang QE. DNA damage responses in cancer stem cells: Implications for cancer therapeutic strategies. World J Biol Chem. 2015; 6:57–64. 10.4331/wjbc.v6.i3.57 - DOI - PMC - PubMed
    1. Nunes T, Hamdan D, Leboeuf C, El Bouchtaoui M, Gapihan G, Nguyen TT, Meles S, Angeli E, Ratajczak P, Lu H, Di Benedetto M, Bousquet G, Janin A. Targeting Cancer Stem Cells to Overcome Chemoresistance. Int J Mol Sci. 2018; 19:4036. 10.3390/ijms19124036 - DOI - PMC - PubMed
    1. Peitzsch C, Tyutyunnykova A, Pantel K, Dubrovska A. Cancer stem cells: The root of tumor recurrence and metastases. Semin Cancer Biol. 2017; 44:10–24. 10.1016/j.semcancer.2017.02.011 - DOI - PubMed
    1. Kreso A, Dick JE. Evolution of the cancer stem cell model. Cell Stem Cell. 2014; 14:275–91. 10.1016/j.stem.2014.02.006 - DOI - PubMed

Publication types