. 2022 Dec 1;13(1):7251.
doi: 10.1038/s41467-022-34312-7.

Genomic analysis of sewage from 101 countries reveals global landscape of antimicrobial resistance

Collaborators, Affiliations

Genomic analysis of sewage from 101 countries reveals global landscape of antimicrobial resistance

Patrick Munk et al. Nat Commun. .

Erratum in

Abstract

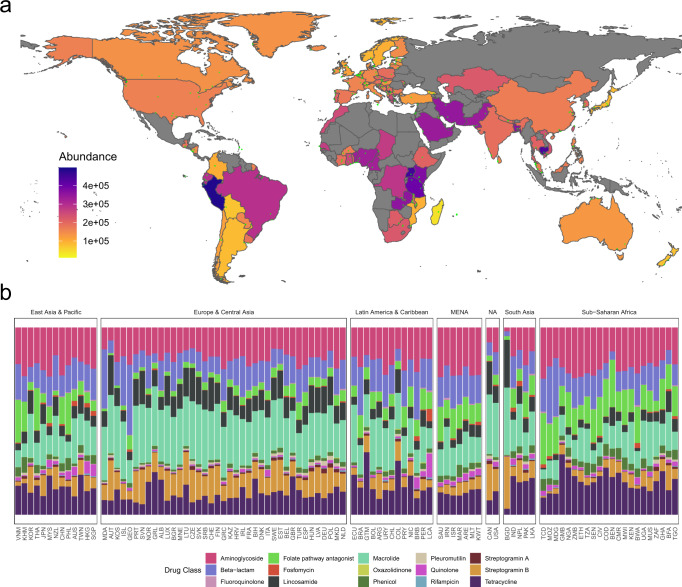
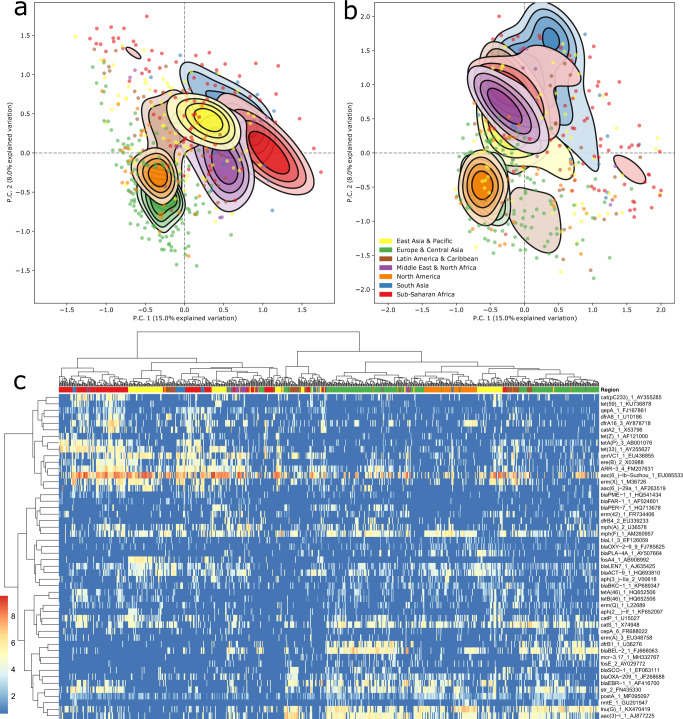
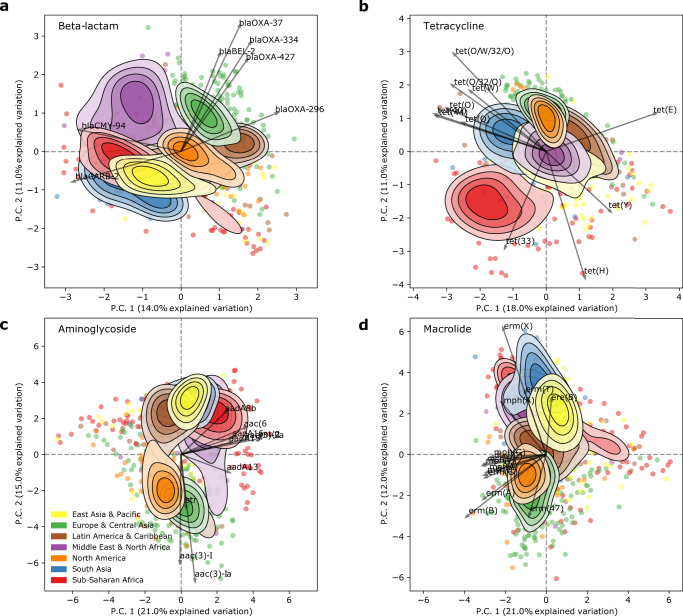
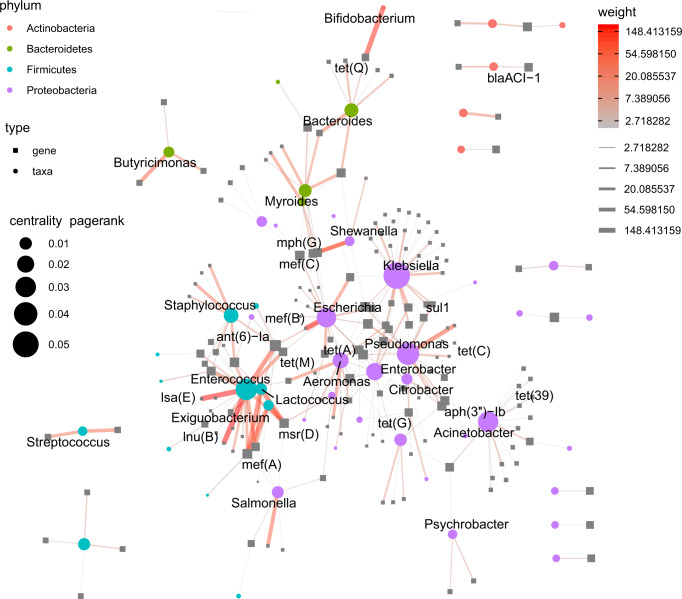
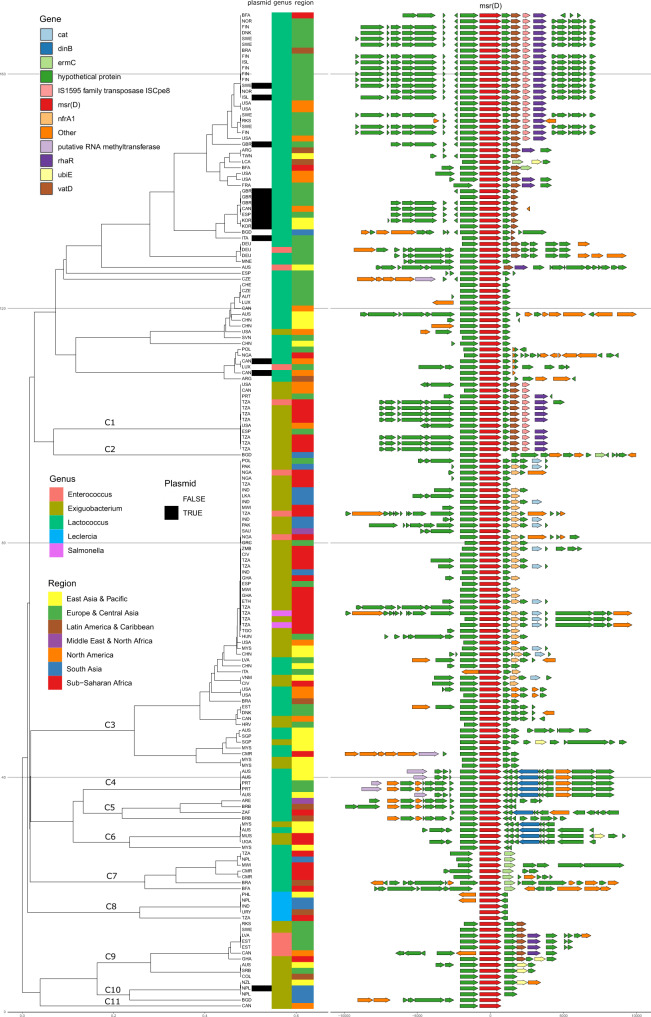
Antimicrobial resistance (AMR) is a major threat to global health. Understanding the emergence, evolution, and transmission of individual antibiotic resistance genes (ARGs) is essential to develop sustainable strategies combatting this threat. Here, we use metagenomic sequencing to analyse ARGs in 757 sewage samples from 243 cities in 101 countries, collected from 2016 to 2019. We find regional patterns in resistomes, and these differ between subsets corresponding to drug classes and are partly driven by taxonomic variation. The genetic environments of 49 common ARGs are highly diverse, with most common ARGs carried by multiple distinct genomic contexts globally and sometimes on plasmids. Analysis of flanking sequence revealed ARG-specific patterns of dispersal limitation and global transmission. Our data furthermore suggest certain geographies are more prone to transmission events and should receive additional attention.


Conflict of interest statement

The authors declare no competing interests.

Figures

Fig. 1
Fig. 1. The global resistome based on sewage-based monitoring.
a Choropleth of the world coloured by the country-wise average total AMR load (see methods). Small green dots show unique sampling sites contributing to the average. Some areas are disputed, and we realize that exact border placement is difficult due to geopolitical issues. b Stacked bar chart of relative abundances per drug class per country. Each panel represent countries in a World Bank region and is ordered by the Shannon diversity of class-level AMR.
Fig. 2
Fig. 2. World regional effects of both bacteriomes and resistomes.
a Resistance gene (90% homology grouping) PCA clustering. b Bacterial genus PCA clustering. The principal components in both panels are calculated from centered log-ratio (CLR) transformed size-adjusted counts. The contours show the group-wise sample density and are truncated at 50% of the peak value. Samples outside this range are drawn as individual points. c Clustered resistome heatmap showing the additive log ratio (ALR) abundance of the 50 most variable ARGs in the dataset. Hierarchical clustering of sample columns is based on all ARGs, not just the visualized ones. The darkest blue indicates no assigned reads in sample-ARG combination.
Fig. 3
Fig. 3. Resistome clustering differs by drug class.
PCA of the resistome were carried out individually on subsets of ARGs providing resistance to different drug classes. The contours are defined in Fig. 2. Arrows show the ARGs with the highest variance in each drug class. a Beta-lactam. b Tetracycline. c Aminoglycoside. d Macrolide. Plots for the remaining drug classes are shown in Supplementary Fig. 8.
Fig. 4
Fig. 4. Gene-sharing network between bacterial genera.
Edges link ARGs to the genera which their contigs were taxonomically assigned to. Only flanked, non-plasmidic contigs were used. The backbone algorithm was used to compute the graph layout. Color and thickness of edges denote the number of observed taxa-gene co-occurrences. Nodes are ARGs and genera which are visualized as grey boxes and colored circles respectively. Node size denote the centrality of the individual nodes to the overall network. Smaller subgraphs were manually moved for space efficiency, so relative distances between those mean nothing.
Fig. 5
Fig. 5. ARG Flanks show diverse genomic contexts.
Flanking sequence for msr(D) variants in the sewage were used to calculate a kmer distance UPGMA tree. The tree shows contig-level annotation: plasmid annotation status, predicted genera and World Bank region. For ARG synteny analyses, all variants of the ARG were oriented and centered, with up- and down-stream predicted features drawn in. A subset of clusters is labelled to allow referencing. All common ARGs are clustered like this according to flank and gene (Supplementary Data 3 and 4) and so is the subset with 5Kb flanks (Supplementary Data 5 and 6).

References

    1. Ferguson, N. M. et al. Impact of non-pharmaceutical interventions (NPIs) to reduce COVID- 19 mortality and healthcare demand. (2020). - PMC - PubMed
    1. Cantelli G, et al. The European Bioinformatics Institute: empowering cooperation in response to a global health crisis. Nucleic Acids Res. 2021;49:D29–D37. doi: 10.1093/nar/gkaa1077. - DOI - PMC - PubMed
    1. VEO. VEO report on mutations and variation in publicly shared SARS- CoV-2 raw sequencing data. https://www.veo-europe.eu/-/media/Sites/veo-europe/Library/VEO-COVID-19-... 874735, (2021).
    1. Volz, E. et al. Assessing transmissibility of SARS-CoV-2 lineage B.1.1.7 in England. Nature593, 266–269 (2021). - PubMed
    1. O’Neill, J. Tackling drug-resistant infections globally: final report and recommendations. Rev. Antimicrob. Resist. 84 (2016) 10.1016/j.jpha.2015.11.005.

Publication types