. 2022 Dec 1;13(1):7417.
doi: 10.1038/s41467-022-35178-5.

Strong pathogen competition in neonatal gut colonisation

Affiliations

Strong pathogen competition in neonatal gut colonisation

Tommi Mäklin et al. Nat Commun. .

Abstract

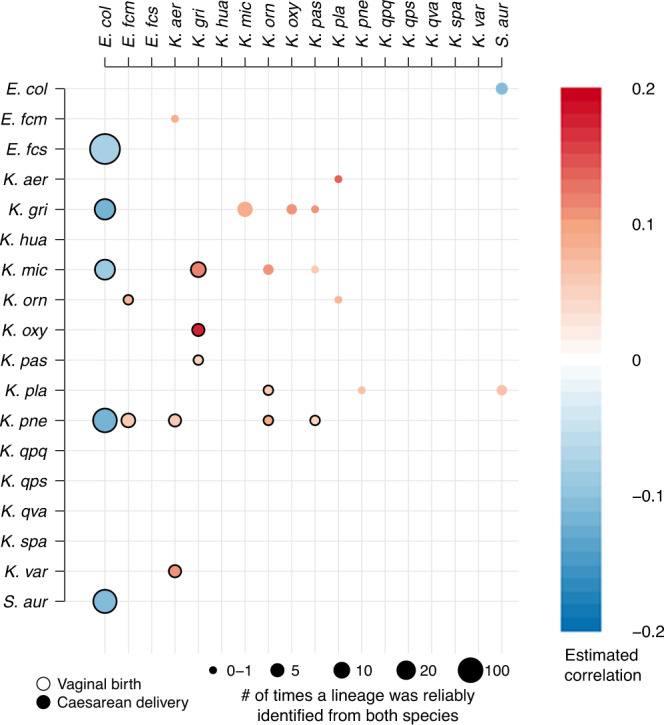
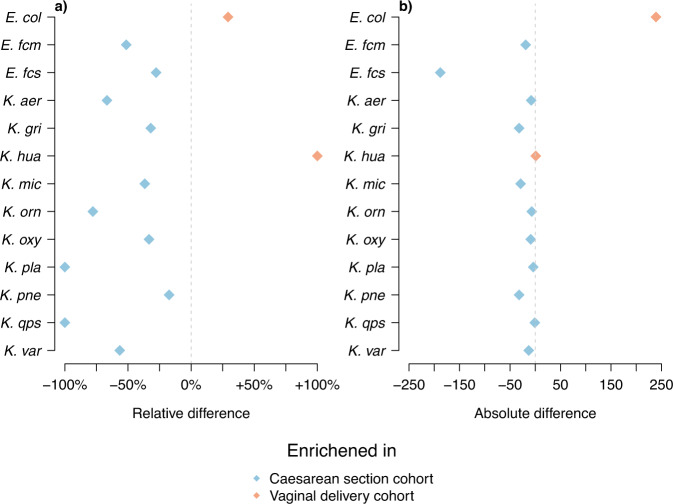
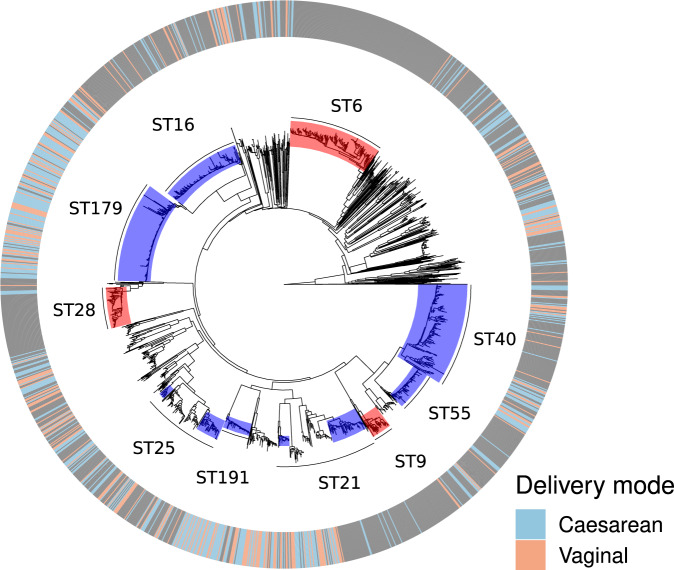
Opportunistic bacterial pathogen species and their strains that colonise the human gut are generally understood to compete against both each other and the commensal species colonising this ecosystem. Currently we are lacking a population-wide quantification of strain-level colonisation dynamics and the relationship of colonisation potential to prevalence in disease, and how ecological factors might be modulating these. Here, using a combination of latest high-resolution metagenomics and strain-level genomic epidemiology methods we performed a characterisation of the competition and colonisation dynamics for a longitudinal cohort of neonatal gut microbiomes. We found strong inter- and intra-species competition dynamics in the gut colonisation process, but also a number of synergistic relationships among several species belonging to genus Klebsiella, which includes the prominent human pathogen Klebsiella pneumoniae. No evidence of preferential colonisation by hospital-adapted pathogen lineages in either vaginal or caesarean section birth groups was detected. Our analysis further enabled unbiased assessment of strain-level colonisation potential of extra-intestinal pathogenic Escherichia coli (ExPEC) in comparison with their propensity to cause bloodstream infections. Our study highlights the importance of systematic surveillance of bacterial gut pathogens, not only from disease but also from carriage state, to better inform therapies and preventive medicine in the future.


Conflict of interest statement

The authors declare no competing interests.

Figures

Fig. 1
Fig. 1. Correlations between the identified priority pathogens.
The figure shows only the statistically significant (p < 0.05, two-tailed permutation test) positive and negative correlations for the focus pathogen species. Correlations shown with a black border around the circle are for the vaginal delivery cohort (below diagonal), and correlations without a border for the caesarean section delivery cohort (above diagonal). Darker shades of red and blue represent stronger positive and negative correlation, while areas of the circles are proportional to the number of samples where the correlated pair was reliably identified. The correlation values were estimated from the relative abundance estimates. The exact p-values are available in the GitHub repository containing the plotting scripts used.
Fig. 2
Fig. 2. Differences in pathogen loads between cohorts.
The figure shows differences in the number of reliably identified pathogens in each cohort. a The relative differences between the cohorts, and b the absolute differences. Pathogens which are more common in the vaginally delivered cohort are coloured in orange and those more common in the caesarean section cohort are coloured in blue.
Fig. 3
Fig. 3. UpSet plot showing coexistence of E. coli lineages with Klebsiella species.
The plot displays the number of times the E. coli lineages and various Klebsiella species were found either alone (single dots) or together in a sample (connected dots), and at least five times. Data are shown in (a) for the vaginal delivery cohort, and in (b) for the caesarean section delivery cohort. Set size (bottom-left subpanels) refers to the number of times a taxonomic unit was found in total, while intersection size (top subpanels) refers to the number of times a taxonomic unit was found alone or coexisting with other unit(s).
Fig. 4
Fig. 4. Summary figure of E. coli gut colonisation.
The plot displays the numbers of E. coli lineages found at each of the five major sampling points (4, 7, and 21 days after birth, in the infancy period, and from the mothers in the maternity unit). The flows indicate the (possible) numbers of lineages that were transmitted between the sampling points, with the colours corresponding to the first time point the transmitted lineages were detected in. Flows that skip a sampling point (such as from 4 days to 21 days) indicate that a lineage returned to detectable levels after the skipped sampling point. a Displays the vaginal delivery cohort, and b the caesarean section cohort.
Fig. 5
Fig. 5. Event matrix displaying colonisation identities with respect to E. coli lineages between subsequent time points.
The figure shows events corresponding to either transition from one E. coli lineage (rows) to another E. coli lineage (columns) or persistence of the same lineage (diagonal). a Events for the vaginal delivery cohort with samples from the infancy period excluded, and b Events for the caesarean section delivery cohort with infancy period excluded. Darker shades of purple denote more common events, the count of which is also indicated by the number contained within the shaded boxes. Lineages shown were observed at least twice across the whole set of samples.
Fig. 6
Fig. 6. Odds ratios for relative E. coli invasiveness.
The odds ratios (OR) for invasiveness are displayed with the 95% confidence interval centred on the OR. The confidence intervals with a statistically significant (p < 0.05, two-tailed Pearson’s chi-squared test with Benjamini-Hochberg adjustment for multiple testing) lower bounds greater than 1 correspond to more invasive lineages (coloured red; OR statistically significantly higher than 1), and confidence intervals with a statistically significant upper bound <1 to more commensal lineages (coloured light blue; OR statistically significantly <1). Lineages with a confidence interval that contains the value 1, or are not statistically significantly different from 1, are labelled as intermediate (coloured grey). The confidence intervals are shown in (a) for both the top 10 most frequent lineages in Norwegian (NORM) bloodstream infections (STs 10, 12, 14, 59, 69, 73, 95, 127, 131, and 141) and all additional lineages, where the OR was estimated to differ from 1 (significantly or not). b The confidence intervals estimated for both ST131 as a whole and additionally for its established sublineages (ST131 A, B, C1, and C2). For both ST131 and the subclades, the estimates are reported using either the BSAC (UK) collection, the NORM (Norway) collection, or combined collections for comparison. The exact p-values and the sample sizes are available in the Source Data file for this figure.
Fig. 7
Fig. 7. Embedding of the neonatal cohorts within a general E. faecalis species-wide collection.
Outer metadata blocks depict the delivery mode of the cohorts (caesarean, light blue; vaginal, orange), aligned against the neighbour-joining (NJ) phylogeny from the core distances. Ten largest sequence types in the combined collections are highlighted within the branches, and the sequence types previously defined as hospital-adapted are coloured in red.
Fig. 8
Fig. 8. Event matrix displaying colonisation identities with respect to E. faecalis lineages between subsequent time points.
The figure shows events corresponding to either transition from one E. faecalis lineage (rows) to another E. faecalis lineage (columns) or persistence of the same lineage (diagonal). a Events for the vaginal delivery cohort with samples from the infancy period excluded, and b Events for the caesarean section delivery cohort with infancy period excluded. Darker shades of purple denote more common events. Lineages shown were visited at least twice across the whole set of samples.

References

    1. Tenaillon O, Skurnik D, Picard B, Denamur E. The population genetics of commensal Escherichia coli. Nat. Rev. Microbiol. 2010;8:207–217. doi: 10.1038/nrmicro2298. - DOI - PubMed
    1. Ørskov F, et al. Special Escherichia coli serotypes among enterotoxigenic strains from diarrhoea in adults and children. Med. Microbiol. Immunol. 1976;162:73–80. doi: 10.1007/BF02121318. - DOI - PubMed
    1. Caugant DA, Levin BR, Selander RK. Genetic diversity and temporal variation in the E. coli population of a human host. Genetics. 1981;98:467–490. doi: 10.1093/genetics/98.3.467. - DOI - PMC - PubMed
    1. Caugant DA, Levin BR, Selander RK. Distribution of multilocus genotypes of Escherichia coli within and between host families. J. Hyg. 1984;92:377–384. doi: 10.1017/S0022172400064597. - DOI - PMC - PubMed
    1. Ortiz A, Vega NM, Ratzke C, Gore J. Interspecies bacterial competition regulates community assembly in the C. elegans intestine. ISME J. 2021;15:2131–2145. doi: 10.1038/s41396-021-00910-4. - DOI - PMC - PubMed

Publication types