. 2022 Dec 1;13(1):7416.
doi: 10.1038/s41467-022-35197-2.

An integrated resource for functional and structural connectivity of the marmoset brain

Affiliations

An integrated resource for functional and structural connectivity of the marmoset brain

Xiaoguang Tian et al. Nat Commun. .

Abstract

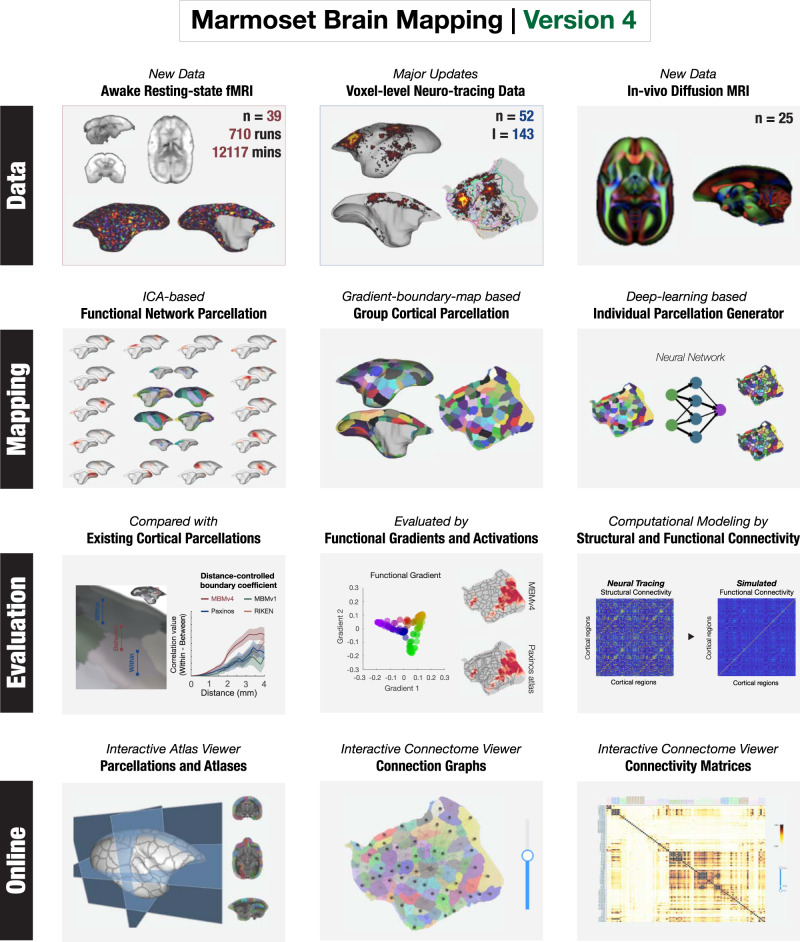
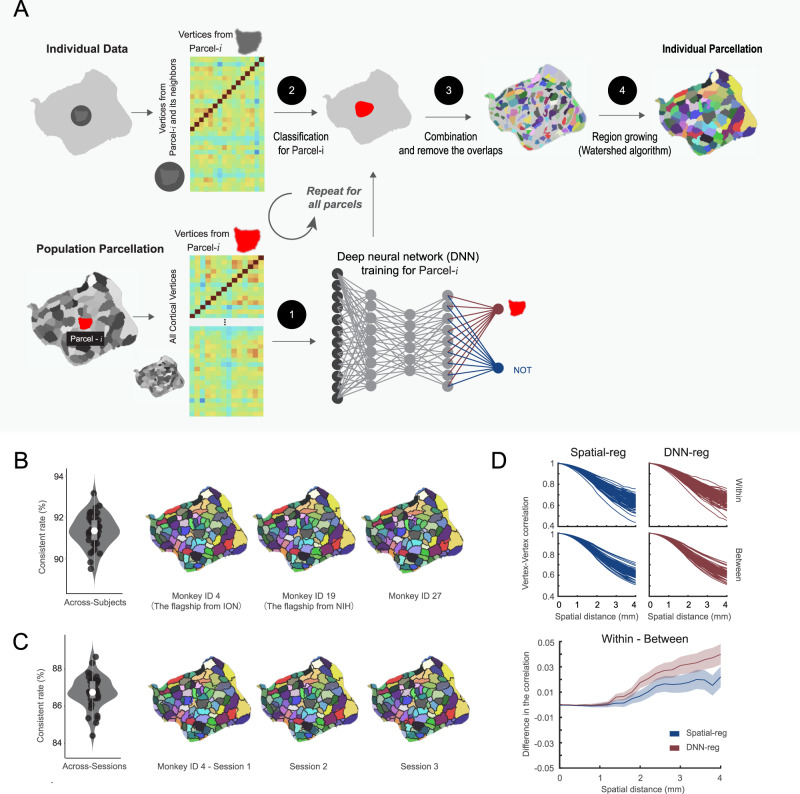
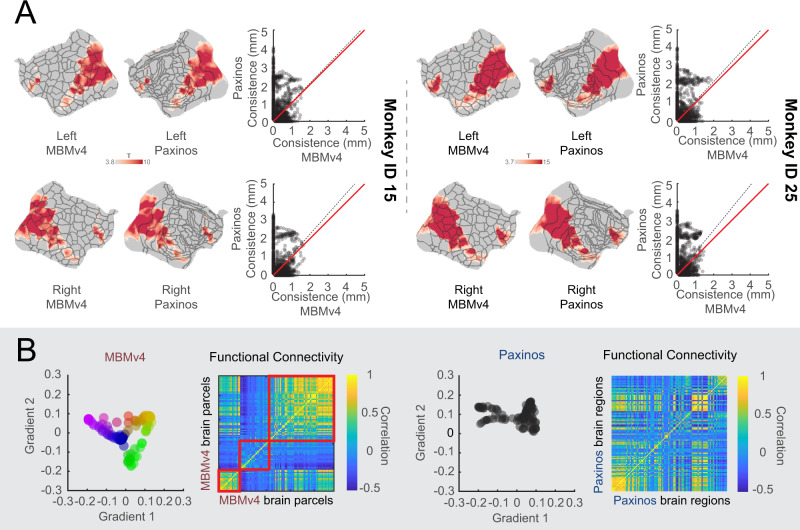
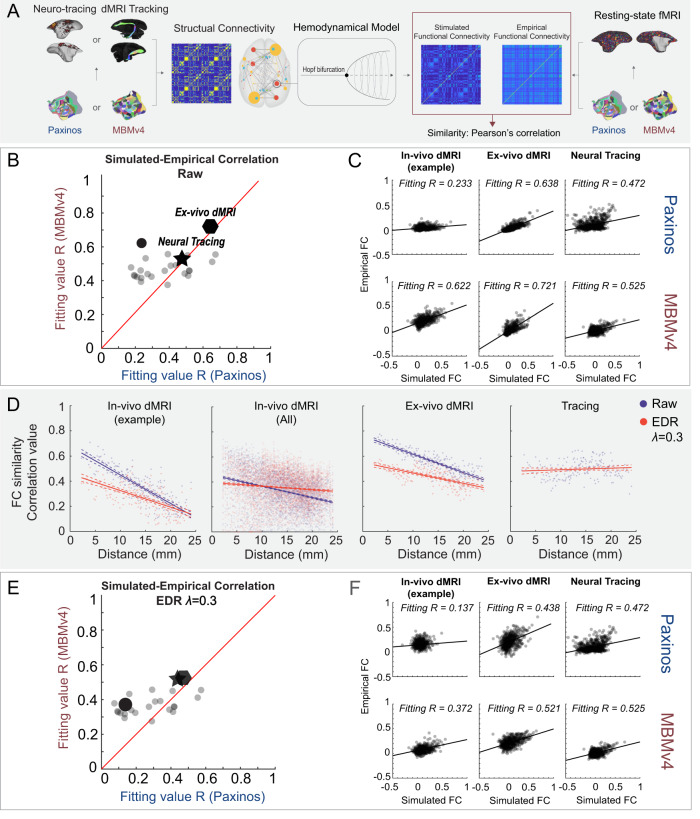
Comprehensive integration of structural and functional connectivity data is required to model brain functions accurately. While resources for studying the structural connectivity of non-human primate brains already exist, their integration with functional connectivity data has remained unavailable. Here we present a comprehensive resource that integrates the most extensive awake marmoset resting-state fMRI data available to date (39 marmoset monkeys, 710 runs, 12117 mins) with previously published cellular-level neuronal tracing data (52 marmoset monkeys, 143 injections) and multi-resolution diffusion MRI datasets. The combination of these data allowed us to (1) map the fine-detailed functional brain networks and cortical parcellations, (2) develop a deep-learning-based parcellation generator that preserves the topographical organization of functional connectivity and reflects individual variabilities, and (3) investigate the structural basis underlying functional connectivity by computational modeling. This resource will enable modeling structure-function relationships and facilitate future comparative and translational studies of primate brains.


Conflict of interest statement

The authors declare no competing interests.

Figures

Fig. 1
Fig. 1. Outline of Marmoset Brain Mapping resource.
The resource provides the awake test-retest resting-state fMRI data, in vivo diffusion MRI data from the same marmoset cohorts, and the neuronal tracing data mapped onto the same MRI space at the voxel/vertex level. In addition to the datasets, it also supports the study of whole-brain functional networks and computational modelings, as well as functional connectivity-based parcellation of the cortex (Marmoset Brain Mapping Atlas Version 4) using a deep neural network for accurate individual mapping. As a comprehensive multimodal resource for marmoset brain research, we also provide an online platform to explore the relationship between structural and functional connectivity. This functionality is embodied in online interactive viewers.
Fig. 2
Fig. 2. Functional cortical networks and their parcellation maps.
The identified networks include: A the ventral somatomotor, B the dorsal somatomotor, C the premotor, D the frontal pole, E the orbital frontal cortex, F the parahippocampus, and temporal pole, GH the auditory and salience-related network, IJ two transmodal networks, including a putative frontoparietal network and the default-mode-network, and KO visual-related networks from the primary visual cortex to higher-order functional regions. These networks were combined to form two network-parcellation maps (PQ), which are dominated by the networks with short-range connectivity (PQ, top rows) and with long-range connectivity (PQ, bottom rows), respectively.
Fig. 3
Fig. 3. The functional connectivity boundary maps.
A The population-based boundary maps from the ION, the NIH, and the combined datasets. These maps are highly consistent, with an average Dice coefficient of 0.7. B Boundary maps in the left hemisphere from four exemplar marmosets (two from the NIH cohort and two from the ION, including the flagship marmosets). C, D The heatmap of the average Dice’s coefficients for both hemispheres between individuals and its distribution histogram. E The average Dice’s coefficients change for both hemispheres with the number of runs in the same individuals.
Fig. 4
Fig. 4. Marmoset Brain Mapping Atlas Version 4 (MBMv4).
A The processing procedure includes generating the population functional connectivity boundary maps, defining the local minima for seeding, and generating parcels by the “watershed” algorithm. B The resulting 96 functional connectivity parcels per hemisphere are overlaid on the white matter surface and flat map of MBMv3. C Distance-controlled boundary coefficient (DCBC) evaluation metric. All pairs of voxels/vertices were categorized into “within” or “between” parcels (left panel) according to different brain parcellations (MBMv1, MBMv4, Paxinos, and RIKEN atlases, right panel), and the DCBC metric was calculated by the differences (within-between) in functional connectivity as the function of distance on the surface (0–4 mm in steps of 0.5 mm). Data are presented in mean ± s.e.m.
Fig. 5
Fig. 5. Mapping individual functional connectivity parcellation.
A An overview of individual Mapping based on the deep neural network approach. B MBMv4 Mapping of each individual. Left panel: the concordance between the population MBMv4 and individual parcellations (N = 78, all hemispheres from 39 subjects). Data are presented by the violin and the box plots (the 25th percentile: 0.9068; the 75 percentile: 0.92448), in which the white point represents the average value 0.915 (the maximum value: 0.931; minimum 0.900); Right panel: three examples of individual parcellations. The underlay (color-coded) presents the population MBMv4, and the overlay (black border) shows the individual parcellations. C Mapping of MBMv4 per session. Left panel: The concordance between every individual parcellation and the corresponding parcellation using one session data (N = 78, all hemispheres from 39 subjects). Data are presented by the violin and the box plots (the 25th percentile 0.865; the 75 percentile 0.877), in which the white point represents the average value 0.874 (the maximum: 0.878; the minimum 0.859); Right panel: representative parcellations of three sessions from one marmoset. The color-coded underlay represents individual parcellation, while the black border overlay shows the session-based parcellation. D The distance-controlled boundary coefficient (DCBC) for the individual parcellation generated by the spatial registration (Spatial-reg, blue) and the deep neural network (DNN-reg, red). Top panel: the functional connectivity for all pairs of vertices within the same parcel and between parcels for DNN-reg and Spatial-reg, respectively. Bottom panel: the comparison of DNN-reg and Spatial-reg by DCBC. Data are presented in mean ± s.e.m.
Fig. 6
Fig. 6. MBMv4 matches functional boundaries and preserves the topographical organization of the functional connectivity.
A The visual activation maps from two monkeys are overlaid on the parcel boundaries from individual MBMv4 parcellation and Paxinos atlas (Left panel: monkey ID 15; Right panel: monkey ID 25). The scatter plots compare the boundary matching of the MBMv4 and the Paxinos atlas with the activation maps, measured by the shortest distance from every voxel in the borders of the activation maps to the parcel borders of the MBMv4 or the Paxinos atlas. The dashed black line represents the diagonal line, and the red line represents the linear fitting line. B The scatter plots in the left panel are the first two axes of gradients (the color scale of dots represents the scores of the first axis for every gradient), decomposed by the functional connectivities of the MBMv4 and the Paxinos atlas (the spectrum colors denote the gradient position in this 2D space). The heat maps of functional connectivity sorted by the scores of the first axis (gradient 1) are shown in the right panel.
Fig. 7
Fig. 7. A computational framework links the structural-functional connectivity according to different parcellations.
A Application of whole-brain modeling, including an estimation of structural connectivity from neuronal tracing, diffusion MRI (in vivo or ex vivo) according to the Paxinos atlas or MBMv4, simulation of functional connectivity from structural connectivity by the Hopf bifurcation hemodynamic functions, and a similarity measure with empirical connectivity from resting-state fMRI. B Model fitting comparison in different spatial scales using the Paxinos versus the MBMv4 atlases. Individual examples using in vivo diffusion MRI (round dots; an example animal marked in black dot), ex vivo diffusion MRI (polygon), and neuronal tracing (star) show higher fitting values for MBMv4 versus the Paxinos atlas. C Examples of correlations between the simulated and empirical functional connectivity from B; solid black lines represent marginal regression lines. D Model fitting comparisons with (red) and without (blue) an exponential distance rule (EDR) correction. From left to right, the plots present the simulation results obtained with in vivo diffusion MRI from the example animal (the linear regression values R = 0.689, p = 9.27e-50 for the blue line; R = 0.413, p = 1.28e-23 for the red); in vivo diffusion MRI from all animals (R = 0.11, p = 6.05e-114 for the blue; R = 0.011, p = 4.17e-13 for the red); the ex vivo diffusion MRI (R = 0.7, p = 2.69e-51 for the blue; R = 0.395, p = 2.19e-22 for the red); and the neuronal-tracing dataset (R = 0.009, p = 0.02). The line plots are presented as mean values ± 95% C.I. Dashed lines represent the 95% confidence interval. E Model fitting comparison with EDR correction between the Paxinos atlas and MBMv4 in different spatial scales. F Examples of correlation between the simulated and empirical functional connectivity from E.

References

    1. Buffalo E. A., Movshon J. A., Wurtz R. H. From basic brain research to treating human brain disorders. Proc. Natl Acad. Sci. USA116, 26167–26172 (2019). - PMC - PubMed
    1. Thiebaut de Schotten M, Croxson PL, Mars RB. Large-scale comparative neuroimaging: where are we and what do we need? Cortex. 2019;118:188–202. doi: 10.1016/j.cortex.2018.11.028. - DOI - PMC - PubMed
    1. Buckner RL, Margulies DS. Macroscale cortical organization and a default-like apex transmodal network in the marmoset monkey. Nat. Commun. 2019;10:1976. doi: 10.1038/s41467-019-09812-8. - DOI - PMC - PubMed
    1. Smith SM, et al. Resting-state fMRI in the Human Connectome Project. Neuroimage. 2013;80:144–168. doi: 10.1016/j.neuroimage.2013.05.039. - DOI - PMC - PubMed
    1. Milham MP, et al. An open resource for non-human primate imaging. Neuron. 2018;100:61–74 e62. doi: 10.1016/j.neuron.2018.08.039. - DOI - PMC - PubMed

Publication types