. 2022 Dec 1;13(1):7419.
doi: 10.1038/s41467-022-35094-8.

A unified computational framework for single-cell data integration with optimal transport

Affiliations

A unified computational framework for single-cell data integration with optimal transport

Kai Cao et al. Nat Commun. .

Abstract

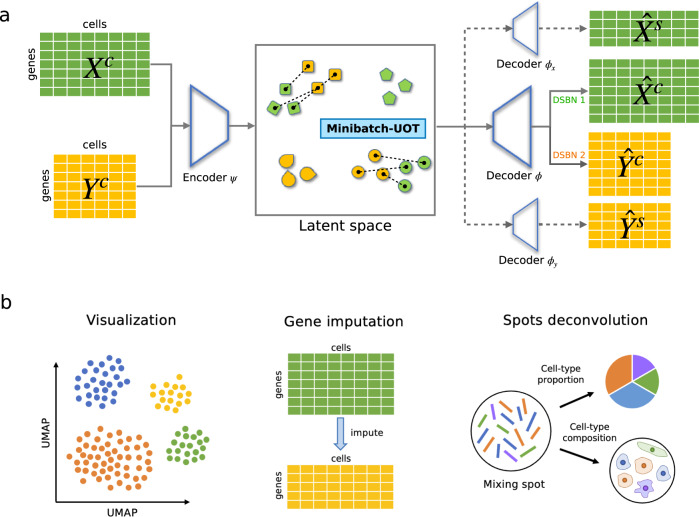
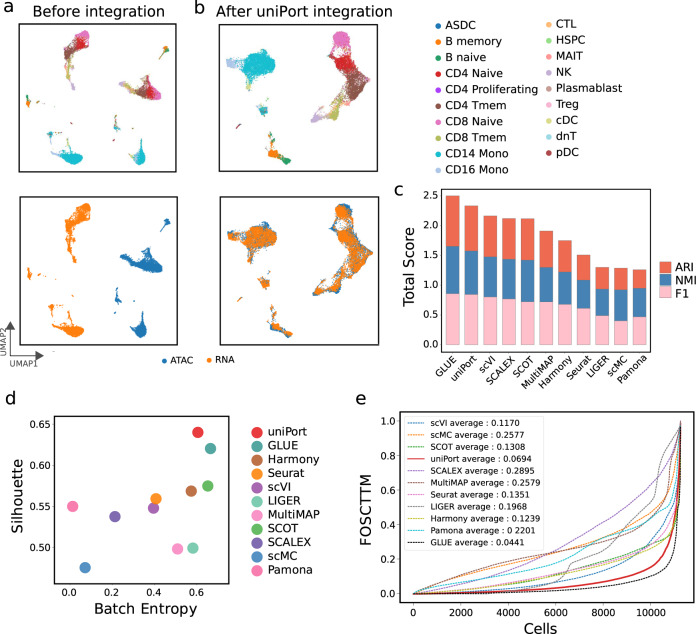
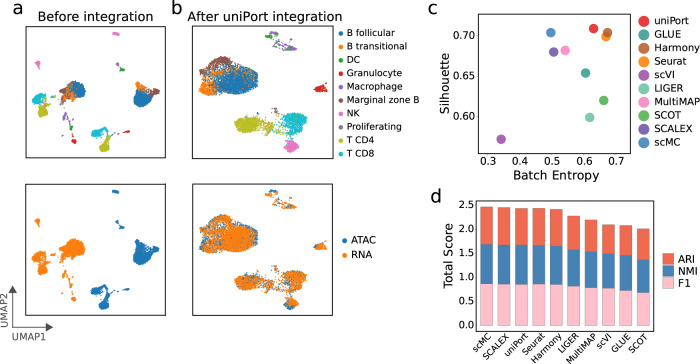
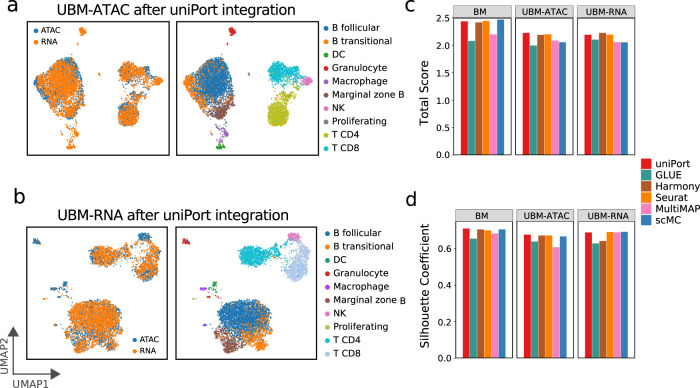
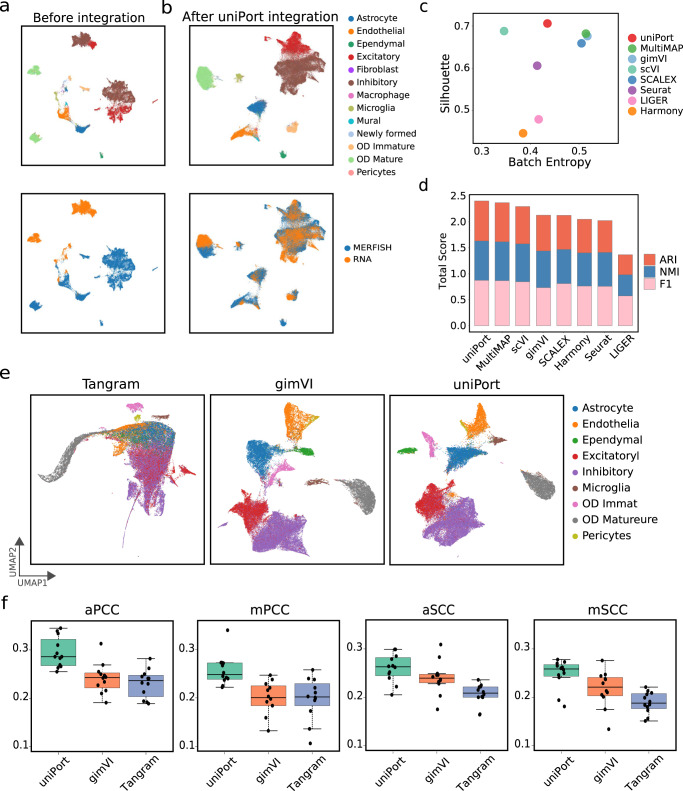
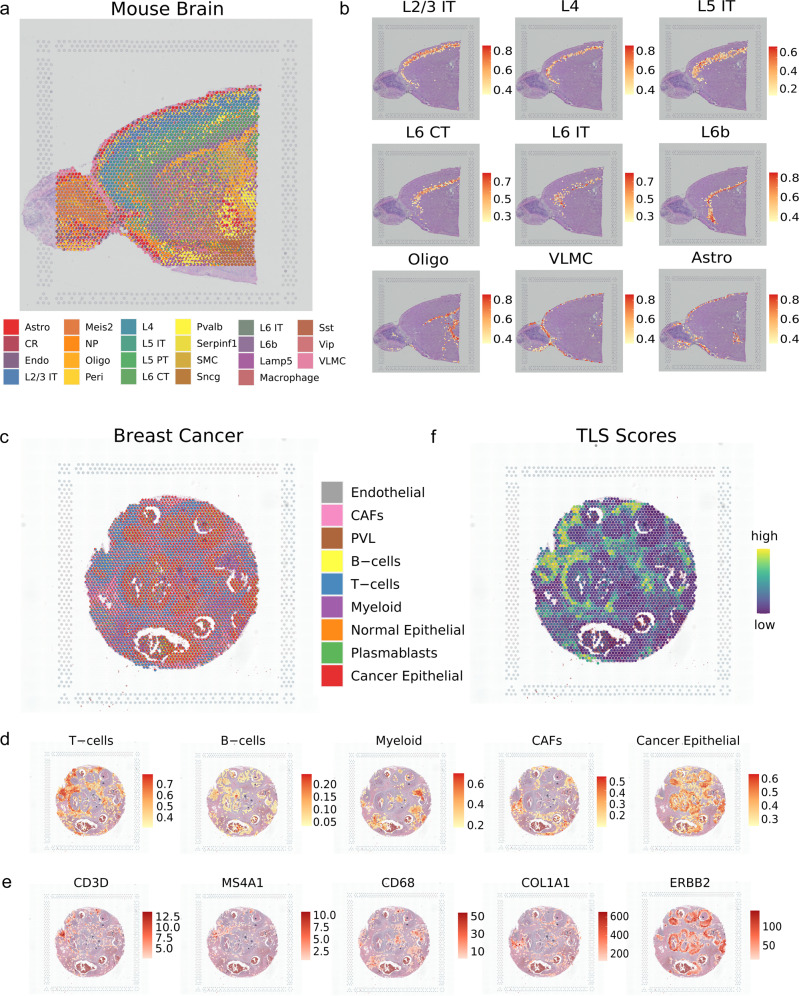
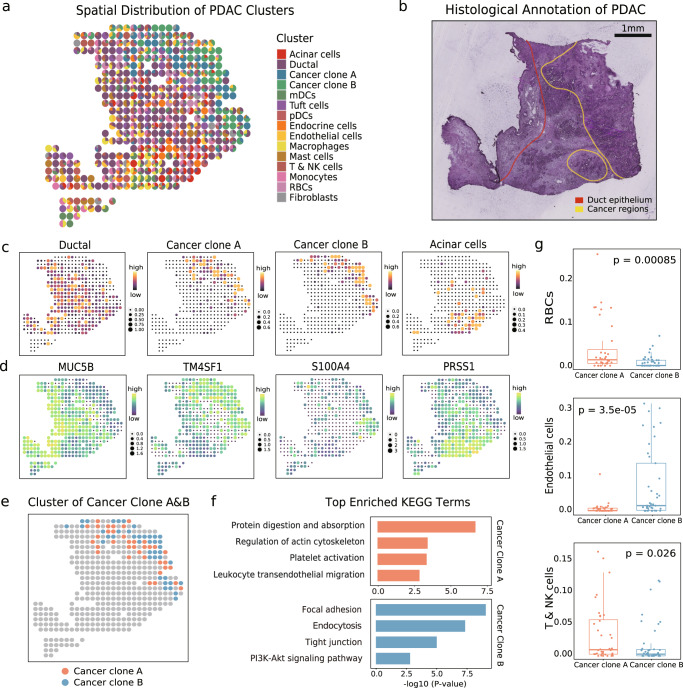
Single-cell data integration can provide a comprehensive molecular view of cells. However, how to integrate heterogeneous single-cell multi-omics as well as spatially resolved transcriptomic data remains a major challenge. Here we introduce uniPort, a unified single-cell data integration framework that combines a coupled variational autoencoder (coupled-VAE) and minibatch unbalanced optimal transport (Minibatch-UOT). It leverages both highly variable common and dataset-specific genes for integration to handle the heterogeneity across datasets, and it is scalable to large-scale datasets. uniPort jointly embeds heterogeneous single-cell multi-omics datasets into a shared latent space. It can further construct a reference atlas for gene imputation across datasets. Meanwhile, uniPort provides a flexible label transfer framework to deconvolute heterogeneous spatial transcriptomic data using an optimal transport plan, instead of embedding latent space. We demonstrate the capability of uniPort by applying it to integrate a variety of datasets, including single-cell transcriptomics, chromatin accessibility, and spatially resolved transcriptomic data.


Conflict of interest statement

The authors declare no competing interests.

Figures

Fig. 1
Fig. 1. Overview of uniPort algorithm.
uniPort integrates single-cell data by combining a coupled-VAE and Minibatch-UOT. uniPort takes as input a highly variable common gene set of single-cell datasets across different modalities or technologies. a uniPort projects input datasets into a cell-embedding latent space through a shared probabilistic encoder. Then uniPort minimizes a Minibatch-UOT loss between cell embeddings across different datasets. Finally, uniPort reconstructs two terms. The first consists of input datasets by a decoder with different DSBN layers. The second consists of highly variable gene sets corresponding to each dataset by dataset-specific decoders. b uniPort outputs a shared latent space and an optimal transport plan that can be used for downstream analysis, such as visualization, gene imputation and spots deconvolution.
Fig. 2
Fig. 2. uniPort integrates paired scATAC and scRNA of the PBMC data from 10× Genomics.
a UMAP visualization of PBMC data before integration colored by omics and cell annotations. b UMAP visualization of PBMC data after uniPort integration. c Comparison of total scores of ARI, NMI and F1 of different methods. d Comparison of Batch Entropy scores and Silhouette coefficients of different methods. e Comparison of average FOSCTTM of different methods.
Fig. 3
Fig. 3. uniPort integrates unpaired scATAC and scRNA of the mouse spleen data.
a UMAP visualization of mouse spleen data before integration colored by omics and cell annotations. b UMAP visualization of mouse spleen data after uniPort integration. c Comparison of Batch Entropy scores and Silhouette coefficients of different methods. d Comparison of total scores of ARI, NMI and F1 of different methods.
Fig. 4
Fig. 4. uniPort integrates the cell-type unbalanced mouse spleen data.
a UMAP visualization of the case of “UBM-ATAC” after uniPort integration colored by omics and cell annotations. b UMAP visualization of the case of “UBM-RNA” after uniPort integration. c Comparison of total scores of ARI, NMI and F1 of different methods in the three cases. d Comparison of Batch Entropy scores and Silhouette coefficients of different methods in the three cases.
Fig. 5
Fig. 5. uniPort imputes MERFISH genes through scRNA data.
a UMAP visualization of MERFISH and scRNA data before integration. b UMAP visualization of MERFISH and scRNA data after uniPort integration. c Comparison of Batch Entropy scores and Silhouette coefficients of different methods. d Comparison of total scores of ARI, NMI and F1 of different methods. e UMAP visualization of imputed MERFISH genes of Tangram, gimVI and uniPort. f Boxplots of average and median Pearson correlation coefficients (aPCC and mPCC) (n = 12, no statistical method was used to predetermine sample size), and average and median Spearman correlation coefficients (aSCC and mSCC) (n = 12) between real and imputed MERFISH genes. In the boxplots, the center line, box limits and whiskers denote the median, upper and lower quartiles and 1.5× interquartile range, respectively.
Fig. 6
Fig. 6. uniPort identifies iconic structures in spatial transcriptomic data (10× Visium).
a Results of mapping spatial data to single-cell data using the optimal transport plan. Spatial scatter pie plot displays the well-structured cluster composition in adult mouse brain anterior slice. b Lists of canonical cerebral cortical neuron types with scaled proportion. c Spatial deconvolution result of the HER2-positive breast cancer. d Proportion of typical clusters in tumor microenvironment. e Expression of marker genes corresponding to clusters in d. f Tertiary Lymphoid Structure (TLS) scores inferred from summing the proportion of T cells and B cells together with their colocalization.
Fig. 7
Fig. 7. uniPort identifies distinct cancer subtypes in microarray-based spatial data.
a Spatial deconvolution result of pancreatic ductal adenocarcinoma (PDAC). b Three manually segmented annotation of PDAC tumor cryosection on one ST slide. The red line circles the ductal epithelium region (left), and the yellow line circles the cancer region (right). c Proportion and distribution of typical clusters in PDAC. d Expression of marker genes corresponding to clusters in c. e Distribution of cancer clone subtypes. f Top enriched KEGG terms of distinct cancer subtypes. g Boxplots of significant differences of cluster composition between the cancer clone A (n = 36) and cancer clone B (n = 41) regions (two-sided t-test). In the boxplots, the center line, box limits and whiskers denote the median, upper and lower quartiles and 1.5 × interquartile range, respectively.

References

    1. Efremova M, Teichmann SA. Computational methods for single-cell omics across modalities. Nat. Methods. 2020;17:14–17. doi: 10.1038/s41592-019-0692-4. - DOI - PubMed
    1. Argelaguet R, Cuomo AS, Stegle O, Marioni JC. Computational principles and challenges in single-cell data integration. Nat. Biotechnol. 2020;39:1202–1215. doi: 10.1038/s41587-021-00895-7. - DOI - PubMed
    1. Chen X, et al. Cell type annotation of single-cell chromatin accessibility data via supervised bayesian embedding. Nat. Mach. Intelligence. 2022;4:116–126. doi: 10.1038/s42256-021-00432-w. - DOI
    1. Argelaguet R, et al. MOFA+: a statistical framework for comprehensive integration of multi-modal single-cell data. Genome Biol. 2020;21:111. doi: 10.1186/s13059-020-02015-1. - DOI - PMC - PubMed
    1. Liu L, et al. Deconvolution of single-cell multi-omics layers reveals regulatory heterogeneity. Nat. Commun. 2019;10:470. doi: 10.1038/s41467-018-08205-7. - DOI - PMC - PubMed

Publication types