. 2022 Dec 1;12(1):20787.
doi: 10.1038/s41598-022-24946-4.

Honey bee colony loss linked to parasites, pesticides and extreme weather across the United States

Affiliations

Honey bee colony loss linked to parasites, pesticides and extreme weather across the United States

Luca Insolia et al. Sci Rep. .

Erratum in

Abstract

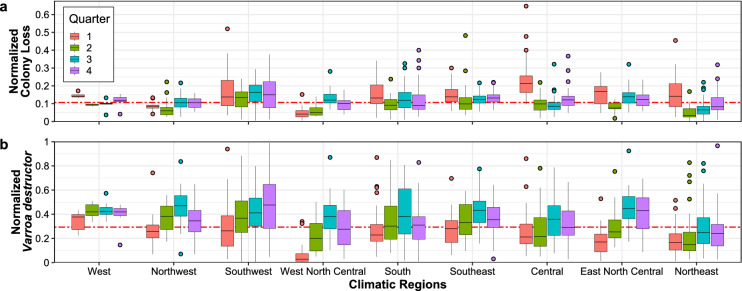
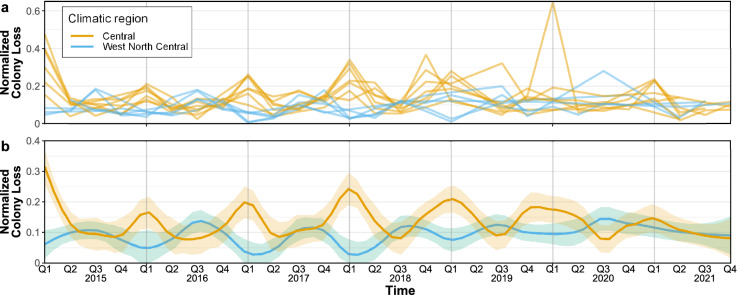
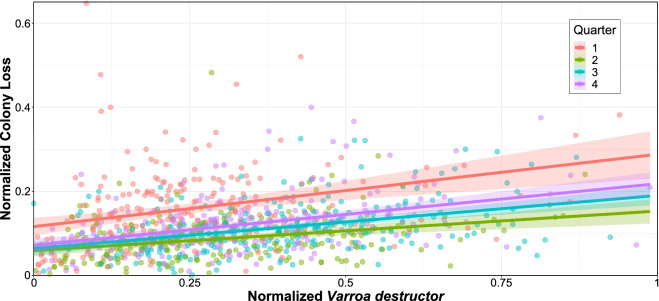
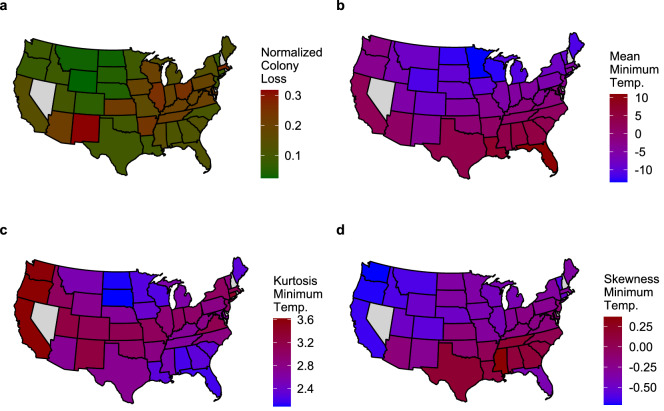
Honey bee (Apis mellifera) colony loss is a widespread phenomenon with important economic and biological implications, whose drivers are still an open matter of investigation. We contribute to this line of research through a large-scale, multi-variable study combining multiple publicly accessible data sources. Specifically, we analyzed quarterly data covering the contiguous United States for the years 2015-2021, and combined open data on honey bee colony status and stressors, weather data, and land use. The different spatio-temporal resolutions of these data are addressed through an up-scaling approach that generates additional statistical features which capture more complex distributional characteristics and significantly improve modeling performance. Treating this expanded feature set with state-of-the-art feature selection methods, we obtained findings that, nation-wide, are in line with the current knowledge on the aggravating roles of Varroa destructor and pesticides in colony loss. Moreover, we found that extreme temperature and precipitation events, even when controlling for other factors, significantly impact colony loss. Overall, our results reveal the complexity of biotic and abiotic factors affecting managed honey bee colonies across the United States.


Conflict of interest statement

The authors declare no competing interests.

Figures

Figure 1
Figure 1
Contiguous United States climatic regions identified by the National Climate Data Center. Climatic regions are presented in different colors for visualization purposes; more detail on the states belonging to each region is provided in Supplementary Fig. S1. The map has been generated by the authors in ArcGIS Pro 2.8.3.
Figure 2
Figure 2
Empirical distribution of honey bee (Apis mellifera) colony loss (a) and Varroa destructor presence (b) across quarters (the first one being January-March) and climatic regions; red dashed lines indicate the overall medians. (a) Box plots of normalized colony loss (number of lost colonies over the maximum number of colonies) for each quarter of 2015–2021 and each climatic region. At the contiguous United States level, this follows a stable pattern across the years, with higher and more variable losses during the first quarter (see Supplementary Figs. S2-S6), but some regions do depart from this pattern (e.g., West North Central). (b) Box plots of normalized V. destructor presence (number of colonies affected by V. destructor over the maximum number of colonies) for each quarter of 2015–2021 and each climatic region. The maximum number of colonies is defined as the number of colonies at the beginning of a quarter, plus all colonies moved into that region during the same quarter.
Figure 3
Figure 3
Comparison of normalized honey bee (Apis mellifera) colony loss (number of lost colonies over the maximum number of colonies) between Central and West North Central climatic regions for each quarter of 2015–2021 (the first quarter being January-March). (a) Trajectory of each state belonging to Central (yellow) and West North Central (blue) climatic regions. (b) Smoothed conditional means for each of the two sets of curves based on a locally weighted running line smoother where the width of the sliding window is equal to 0.2 and corresponding standard error bands are based on a 0.95 confidence level.
Figure 4
Figure 4
Scatter plot of normalized honey bee (Apis mellifera) colony loss (number of lost colonies over the maximum number of colonies) against normalized Varroa destructor presence (number of colonies affected by V. destructor over the maximum number of colonies) for each state and each quarter of 2015–2021 (the first quarter being January-March). Points are color-coded by quarter, and ordinary least squares fits (with corresponding standard error bands based on a 0.95 confidence level) computed by quarter are superimposed to visualize the positive association.
Figure 5
Figure 5
Spatial representation (by state) of median values for four different indices regarding colony loss and minimum temperature in the first quarter (January-March) of seven consecutive years (2015–2021) for each state. (a) Normalized honey bee (Apis mellifera) colony loss. (b) Mean of minimum temperatures. (c) Kurtosis of minimum temperatures (how “extreme” the minimum temperatures were). (d) Skewness of minimum temperatures (whether they tended to concentrate in their lower or upper range). In each panel, the color attributed to a state represents the median of seven index values (first quarter of seven years). North Dakota shows a relatively low normalized colony loss (panel (a)), one of the lowest mean minimum temperature (panel (b)), and one of the lowest minimum temperature kurtosis (panel (c)). This suggests that consistently low minimum temperatures during the first quarter (low mean and low kurtosis) may be associated with lower colony loss in that state. The map has been generated by the authors in R 3.6.2.

References

    1. Becher MA, Osborne JL, Thorbek P, Kennedy PJ, Grimm V. Towards a systems approach for understanding honeybee decline: A stocktaking and synthesis of existing models. J. Appl. Ecol. 2013;50:868–880. doi: 10.1111/1365-2664.12112. - DOI - PMC - PubMed
    1. Pettis JS, Delaplane KS. Coordinated responses to honey bee decline in the USA. Apidologie. 2010;41:256–263. doi: 10.1051/apido/2010013. - DOI
    1. Potts SG, et al. Declines of managed honey bees and beekeepers in Europe. J. Apic. Res. 2010;49:15–22. doi: 10.3896/IBRA.1.49.1.02. - DOI
    1. Oldroyd BP, Nanork P. Conservation of asian honey bees. Apidologie. 2009;40:296–312. doi: 10.1051/apido/2009021. - DOI
    1. Ellis JD, Evans JD, Pettis J. Colony losses, managed colony population decline, and Colony Collapse Disorder in the United States. J. Apic. Res. 2010;49:134–136. doi: 10.3896/IBRA.1.49.1.30. - DOI

Publication types