. 2022 Dec;23(12):1687-1702.
doi: 10.1038/s41590-022-01354-4. Epub 2022 Dec 1.

Parenteral BCG vaccine induces lung-resident memory macrophages and trained immunity via the gut-lung axis

Affiliations

Parenteral BCG vaccine induces lung-resident memory macrophages and trained immunity via the gut-lung axis

Mangalakumari Jeyanathan et al. Nat Immunol. 2022 Dec.

Erratum in

Abstract

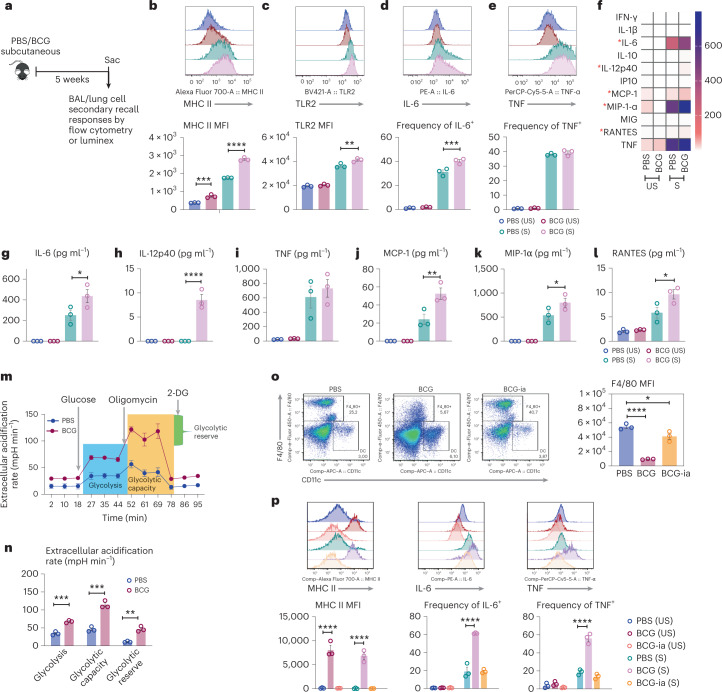
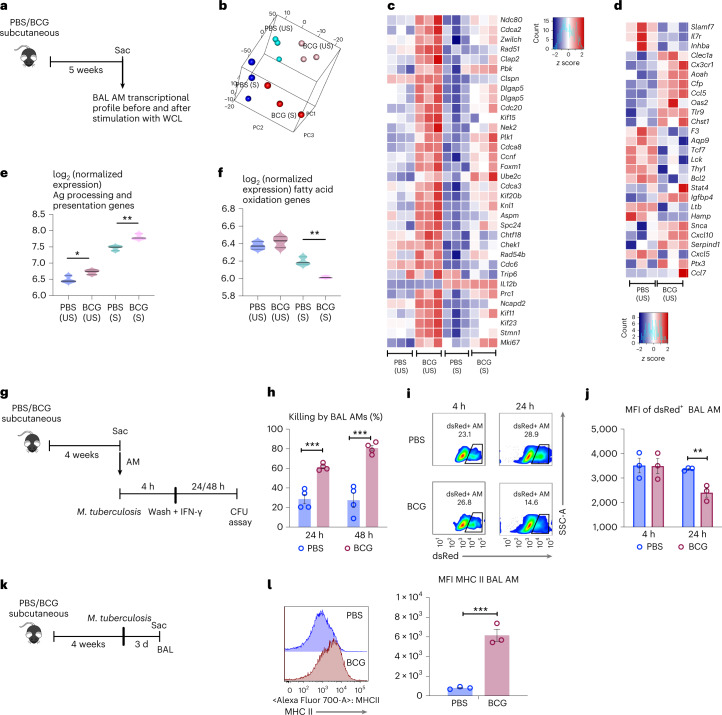
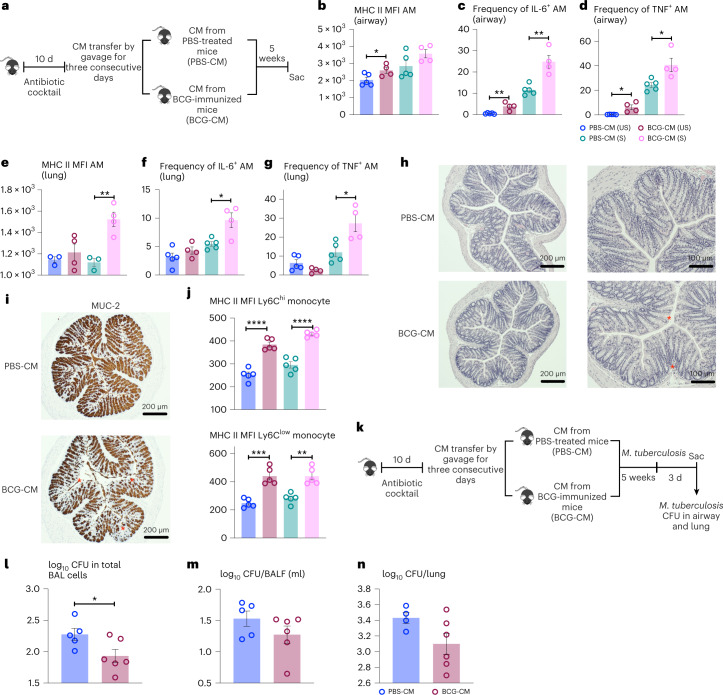
Aside from centrally induced trained immunity in the bone marrow (BM) and peripheral blood by parenteral vaccination or infection, evidence indicates that mucosal-resident innate immune memory can develop via a local inflammatory pathway following mucosal exposure. However, whether mucosal-resident innate memory results from integrating distally generated immunological signals following parenteral vaccination/infection is unclear. Here we show that subcutaneous Bacillus Calmette-Guérin (BCG) vaccination can induce memory alveolar macrophages (AMs) and trained immunity in the lung. Although parenteral BCG vaccination trains BM progenitors and circulating monocytes, induction of memory AMs is independent of circulating monocytes. Rather, parenteral BCG vaccination, via mycobacterial dissemination, causes a time-dependent alteration in the intestinal microbiome, barrier function and microbial metabolites, and subsequent changes in circulating and lung metabolites, leading to the induction of memory macrophages and trained immunity in the lung. These data identify an intestinal microbiota-mediated pathway for innate immune memory development at distal mucosal tissues and have implications for the development of next-generation vaccine strategies against respiratory pathogens.


Conflict of interest statement

The authors declare no competing interests.

Figures

Fig. 1
Fig. 1. Subcutaneous BCG vaccine induces memory AM in distal respiratory mucosa.
a, Experimental schema. b,c, Histograms of surface expression of MHC II (**P = 0.0027, ****P < 0.0001) (b) or TLR2 (**P = 0.0050) (c) on airway-resident AM. d,e, Histograms and frequencies of IL-6- (***P = 0.0007) (d) or TNF-producing airway AM (e). f, Heatmap of cytokine/chemokine protein levels (geometric means) in supernatants of airway AM cultured with (S) or without (US) stimulation. Red asterisks denote significantly increased cytokine/chemokine production upon stimulation by airway AM of BCG hosts. gl, Concentrations of IL-6 (*P = 0.0230) (g), IL-12p40 (****P < 0.0001) (h), TNF (i) and MCP-1 (**P = 0.0031) (j), MIP-1α (*P = 0.0408) (k) and RANTES (*P = 0.0137) (l) in supernatants of airway AM cultured with and without stimulation. m, Real-time ECAR in airway AM at 8 weeks post-BCG immunization. 2-DG: 2-deoxy-glucose. n, Glycolysis (***P = 0.0006), glycolytic capacity (***P = 0.0007) and glycolytic reserve (**P = 0.0013) in airway AM at 8 weeks post-BCG immunization. o, Dotplots of frequencies of cells gated out of total live peritoneal cells expressing F4/80 surface marker and the median fluorescent intensity (MFI) of F4/80 expression by PM at 5 weeks post-BCG vaccination (*P = 0.0231, ****P = <0001). p, Histograms of and the MFI of MHC II and frequencies of IL-6- or TNF-producing PM at 5 weeks postvaccination with viable BCG or inactivated BCG (BCG-ia) or PBS with (S) or without (US) stimulation (****P = <0.0001). Data in b, d and e are representative of three independent experiments. Data in f, gl and op are representative of two independent experiments. Data in bar graphs are presented as mean ± s.e.m. and represent individual data points of biologically independent samples, n = 3 mice per group. One-way ANOVA was used for multiple comparison testing with Bonferroni’s test for data in bl, two-tailed t-test for data in n and one-way ANOVA followed by Dunnett’s multiple comparison test for data in o and p.
Fig. 2
Fig. 2. BCG vaccine-induced memory AM transcriptional and antimicrobial responses.
a, Experimental schema. b, PCA of gene expression in airway AM. n = 3 mice per group. c, Heatmap of DEG involved in cell cycle in airway AM from PBS and BCG hosts with (S) and without (US) stimulation. d, Heatmap of DEG related to immune processes in airway AM comparing PBS and BCG groups with (S) and without (US) stimulation. e,f, Signature scores of genes involved in Ag processing and presentation (*P = 0.0260; **P = 0.0054) (e) and fatty acid oxidation (**P = 0.0076) (f) in airway AM. Horizontal lines in violin plots denote medians and dotted lines denote lower and upper quartiles. g, Experimental schema of ex vivo phagocytosis/killing of M. tuberculosis by airway AM. h, Percent of killing of phagocytosed M. tuberculosis bacilli by airway AM assessed at 24 (***P = 0.0005) and 48 h (***P = 0.0006). Each point represents biologically independent samples (n = 4 mice in PBS group; n = 3 mice in BCG group). Representative of two independent experiments. i, Representative flow cytometric plots of frequencies of dsRed+ airway AM at 4 h (phagocytosis) and 24 h (killing) postinfection with BCG-dsRed. j, MFI of dsRed signal within airway AM at 4 h and 24 h (**P = 0.0072) postinfection with BCG-dsRed. Each point represents biologically independent samples (n = 3 mice per group). k, Experimental schema. l, Histograms and MFI of MHC II expression (***P = 0.0010) on airway AM before M. tuberculosis infection. Each point represents biologically independent samples (n = 3 mice per group). Data in bar graphs are presented as mean ± s.e.m. Adjusted P values are presented for violin plots and obtained using limma package and BH correction (Methods) (e,f). Statistical analysis was determined for data in h, j, and l by a two-tailed t-test, comparing BCG (US) with PBS (US) and BCG (S) with PBS (S).
Fig. 3
Fig. 3. Memory AMs confer trained immunity to pulmonary TB early in infection.
a, Experimental schema. b, Lung tissues CFU at 7 and 14 d post-M. tuberculosis infection (dpi) (*P = 0.0342; **P = 0.0047). Biologically independent samples pooled from two independent experiments for 7 dpi (n = 8 mice in PBS group; n = 9 mice in BCG group) and for 14 dpi (n = 4 mice in PBS group; n = 5 mice in BCG group). c, Experimental schema. d,e, Intracellular (BAL cells) M. tuberculosis CFU in the airway at 3 dpi (n = 5 mice per group; *P = 0.0208) and 7 dpi (n = 4 mice in PBS group; n = 5 mice in BCG group; *P = 0.0476) (d), and extracellular (BALF) M. tuberculosis CFU bacilli in the airway at 3 dpi (n = 5 mice in PBS group; n = 4 mice in BCG group; *P = 0.0152) and 7 dpi (n = 5 mice per group) (e). f, Experimental schema. g, Representative dotplots of airway CD4 T cells positive for activation marker CD44 and Ag85B tetramer at 3, 7 and 14 dpi. h,i, Total numbers of CD4+CD44+ (*P = 0.0490; **P = 0.0016) (h) and CD4+tet+ T cells (***P = 0.0003) (i) in the airway at 3 (n = 3 mice per group), 7 (n = 4 mice per group) and 14 (n = 4 mice per group) dpi. j, Total numbers of CD4+CD44+ T cells in LPT at 0, 3 (*P = 0.0162), 7 (**P = 0.0082) and 14 (*P = 0.0260) dpi. n = 3 mice in PBS group and n = 4 mice in BCG group for all time points. k,l, Representative dotplots (k) and total numbers of CD4+tet+ T cells in LPT postinfection (***P = 0.0002) (l). n = 3 mice per group for all time points. m, Experimental schema. n, Lung M. tuberculosis CFU at 7 dpi (*P = 0.0438; **P = 0.0013; ****P ≤ 0.0001). Biologically independent samples were pooled from three independent experiments. n = 11 mice in PBS group, 14 mice in BCG group and 10 in BCG ∆T cells group. o, Experimental schema. p,q, Numbers of intracellular (BAL cells) M. tuberculosis CFU in the airway (*P = 0.0404) (p) and lung tissue (*P = 0.0308) (q) at 3 dpi, n = 4 mice per group per tissue. The horizontal line in scatterplots denotes the mean with s.e.m. error bars. Data in bar graphs are presented as mean ± s.e.m. Statistical analysis was determined by two-tailed t-test for b, d, e, hj, l, p and q comparing BCG with PBS groups, and data in n were analyzed by one-way ANOVA, followed by Fisher’s least significant difference (LSD) test.
Fig. 4
Fig. 4. Induction of memory AMs is independent of trained circulating monocytes and T cell-derived signals.
a, Experimental schema. b, Representative dotplots of myeloid (MMP3) and lymphoid (MMP4) progenitors and frequencies of MMP3 out of total multipotent progenitors in the BM (*P = 0.0120) (n = 3 mice in PBS group, n = 4 mice in BCG group). c,d, MFI of MHC II on circulating Ly6Chigh (*P = 0.0228) (c) and Ly6Clow (P = 0.0510) (d) monocytes with (S) and without (US) stimulation (n = 3 mice per group per cell type). e, Frequencies of Ly6Clow TNF+ monocytes with (S) and without (US) stimulation (*P = 0.0157) (n = 3 mice per group). f, Heatmap of cytokine/chemokine protein levels (geometric means) in the plasma from whole blood culture samples with (S) and without (US) stimulation. Red asterisks denote significant differences upon stimulation of airway AM of BCG hosts. g,h, Representative dotplots of SiglecF+Ly6C airway AM (g) and lung tissue (h). MDM and IM in lung tissue were identified as SiglecFLy6C+ and SiglecFLy6C, respectively. The total numbers of macrophage subsets in airway and lung tissue are presented in the bar graph. Representative of two independent experiments (n = 3 mice per group per tissue). i, MFI of MHC II on airway AM from BCG-vaccinated or PBS-treated CCR2KO mice with (S) and without (US) stimulation and cytokine/chemokine levels in culture supernatant of airway AM with stimulation (S) (*P = 0.0280 for TNF; *P = 0.0335 for IL-6; *P = 0.0239 for IL-10). n = 3 mice in PBS group, n = 4 mice in BCG group. j, MFI of MHC II on lung tissue AM from BCG-vaccinated or PBS-treated CCR2KO mice with (S) and without (US) stimulation (US: *P = 0.0238; S: *P = 0.0246) and frequencies of lung tissue AM producing IL-6 (US: *P = 0.0284; S: *P = 0.0297) and TNF with and without stimulation. k, Experimental schema. l, Representative histograms of PKH-labeled AM in the airway of BCG-vaccinated or PBS-treated WT and CCR2KO animals, compared to naïve mouse AM without PKH-labeling (no PKH). n = 3 mice per group. m,n, Signature scores for embryonic origin (AM) (m) and circulating monocyte genes (n) in airway AM in PBS and BCG-vaccinated hosts. Horizontal lines in violin plots denote medians and dotted lines denote lower and upper quartiles. o, Experimental schema. p, Heatmap of cytokine/chemokine protein levels (geometric means) in culture supernatants of AM with stimulation, comparing PBS, BCG-vaccinated and BCG/T cell depletion (dep) groups. Red asterisks denote significant differences upon stimulation of airway AM of BCG hosts. q,r, MFI of MHC II on airway AM (**P = 0.0066; ****P ≤ 0.0001) (q) and frequencies of IL-6-producing airway AM (*P = 0.0159; ***P = 0.0003; ****P ≤ 0.0001) (r) with (S) and without (US) stimulation, comparing PBS, BCG-vaccinated and BCG/IFN-γ-depleted (anti-IFNγ) groups. n = 3 mice per group. Data in bar graphs are presented as mean ± s.e.m. Statistical analysis was determined by two-tailed t-test for be, i, and j, comparing BCG with PBS. Data in q and r were analyzed by one-way ANOVA, followed by multiple comparisons with Bonferroni’s test.
Fig. 5
Fig. 5. Alterations in intestinal microbiota and microbial metabolites after BCG vaccination.
a,b, Alpha diversity comparison between 5-week PBS and BCG-vaccinated groups based on OTU richness using Chao1 diversity measure (t-test) (P = 0.0540) (a) and beta diversity comparison using PCoA ordination method and Jenson–Shannon divergence distance method (PERMANOVA) (P < 0.0040) (b) in cecum microbiota. n = 6 mice in PBS group, n = 5 mice in BCG group. c,d, Pie charts for relative abundance profile of top eight bacterial families (c) and bar graph comparing frequencies of top four abundant bacterial families in CM (P = 0.0505) (d). n = 6 mice in PBS group, n = 5 mice in BCG group. e,f, Representative micrographs of H&E-stained colon sections (n = 6 mice in PBS group, n = 5 mice in BCG group). Sloughed epithelium (a), inflammatory infiltrates in submucosal areas and lymphoid aggregates (b) in the colon of 5-week BCG hosts are marked. g, Histologic scoring of architectural changes, epithelium alterations and inflammatory infiltrates of the colon at indicated time points post-BCG. n = 5/2, 6/5, and 4/8 weeks. h, Immunohistochemical staining of ZO-1 protein in colonic epithelium. Red asterisk identifies irregular/disrupted distribution of ZO-1 in the colonic epithelium of 5-week BCG hosts. n = 6 mice in PBS group, n = 5 mice in BCG group. i, Comparison of intestinal permeability measured as an optical density of orally delivered FITC-dextran translocated into the circulation (*P = 0.0012). n = 4 mice in PBS group, n = 3 mice in BCG group. j, PLS-DA analysis on metabolic profiles in the cecal tissue samples of 5-week PBS and BCG hosts. n = 16 mice per group. k, Comparison of deoxycarnitine levels (relative peak area per gram wet weight) in cecal tissue samples of 5-week PBS and BCG hosts (*P = 0.0312). n = 16 mice per group. l, PLS-DA analysis on metabolic profiles in the serum samples of 5-week PBS and BCG hosts. n = 13 mice in PBS group, n = 14 mice in BCG group. m, Proportions of butyrate SCFA were calculated out of total concentration (mM g−1) of SCFAs in cecal tissue samples of 5-week PBS and BCG hosts (P = 0.0512). n = 16 mice per group. n, Comparison of PLS-DA analysis on metabolic profiles in the lung tissue samples from PBS, 2-week and 5-week BCG hosts. n = 10 mice per group. o,p, Comparison of carnitine products, butyryl carnitine (***P = 0.0007) (o) and hexanoyl carnitine (*P = 0.0268) (p; relative peak area per gram wet weight) in lung tissue samples of PBS, 2-/5-week BCG hosts. n = 10 mice per group per time. q, Comparison of colon length between 2-week PBS and BCG hosts (**P = 0.0025). n = 4 mice in PBS group, n = 5 mice in BCG group. r, Numbers of BCG CFU in the MLN, cell-free PW in peritoneal cell fraction (PCL) of 2-week BCG hosts. n = 4 mice per group. Data in ad are representative of two independent experiments. Data in jm are from two pooled experiments (n = 16 mice per group). Horizontal lines in box plots denote medians and the length of the box denotes lower and upper quartiles, and the whiskers denote minimum and maximum values. Data in bar graphs are presented as mean ± s.e.m. Numeric numbers on pie charts represent median frequencies. Statistical analysis was determined by two-tailed t-test for data in d, i, k, m and q, comparing BCG with PBS. Data in o and p are analyzed by one-way ANOVA, followed by multiple comparisons with Bonferroni’s test.
Fig. 6
Fig. 6. Transplantation of BCG vaccine-conditioned intestinal microbiota induces memory AMs and trained immunity.
a, Experimental schema. b,c,d, Trained innate immune characteristics by airway AM from BCG-CM group: MFI of MHC II (*P = 0.0477) on airway AM (b), frequencies of IL-6 (**P = 0.0046; **P = 0.0025) (c) and TNF (*P = 0.0109, *P = 0.0192) (d) producing airway AM with (S) and without (US) stimulation. n = 5 mice in PBS-CM group, n = 4 mice in BCG-CM group. e,f,g, Trained innate immune characteristics by lung tissue AM from BCG-CM group: MFI of MHC II (**P = 0.0052) on lung AM (e), frequencies of IL-6 (P = *0.0122) (f) and TNF (*P = 0.0144) (g), producing lung AM with (S) and without (US) stimulation. Representative of two independent experiments. n = 5 in PBS-CM group, n = 4 mice in BCG-CM group. h, Representative micrographs of H&E-stained colon sections (n = 5 mice in PBS-CM group, n = 4 mice in BCG-CM group) showing epithelium hyperplasia, reduced goblet cells and mild epithelium disruption in the colon of BCG-CM mice. Red asterisks identify epithelium disruption and hyperplasia. i, Representative micrographs of colon sections (n = 5 mice in PBS-CM group, n = 4 mice in BCG-CM group) immunohistochemically stained for MUC2 protein. Red asterisks identify significantly reduced MUC2 staining in the colonic epithelium of BCG-CM mice compared to PBS-CM mice. j, MFI of MHC II on circulating Ly6Chi (****P < 0.0001) and Ly6Clow (***P = 0.0002, **P = 0.0011) monocytes from BCG-CM mice with and without stimulation, compared to those from PBS-CM mice. n = 5 mice per group. k, Experimental schema. l,m,n, Numbers of intracellular (BAL cells) (*P = 0.0431) (l) and extracellular (BALF) (m) M. tuberculosis CFU in the airway (n = 5 in PBS-CM group, n = 6 mice in BCG-CM group) and those in lung tissue (n) (n = 4 mice in PBS-CM group, n = 6 mice in BCG-CM group) of BCG-CM mice, compared to PBS-CM mice, at 3 d postinfection. Data in bar graphs are presented as mean ± s.e.m. Statistical analysis was determined by two-tailed t-test for all data in bg, j and l, comparing PBS-CM (US) versus BCG-CM (US) and PBS-CM (S) versus BCG-CM (S).
Fig. 7
Fig. 7. Circulating microbial metabolites in BCG-vaccinated hosts leads to innate immune training of AMs.
a, Experimental schema of in vitro innate training of AM. b, Representative bright-field microscopic images of AM after training with BCG-S or treatment with control serum or after restimulation. Representative of two independent experiments (n = 4 wells per condition). ce, Increased median fluorescence intensity (MFI) of MHC II (*P = 0.0132 and *P = 0.0182) (c) and frequencies of IL-6 (*P = 0.0362) (d), but not TNF (e), producing AM trained with BCG-S and upon re-stimulation after 24-h or 3-d resting. Each data point represents n = 3 wells per PBS serum and n = 4 wells per BCG serum. f,g, Cytokine/chemokine protein contents in culture supernatants of AM trained with BCG-S and upon restimulation after 3-d resting. Each data point represents n = 4 wells per condition. TNF, **P = 0.0047; KC, *P = 0.0491. hj, Inhibition of innate immune training of AM by BCG-S upon histone methylation and acetylation blockade with methyltransferase inhibitor MTA or acetyltransferase inhibitor EGCG. Data shown are IL-1β (***P = 0.0008) (h), IL-6 (***P = 0.001) (i) and TNF (****P < 0.0001) (j) protein contents produced by AM upon restimulation. Each data point represents n = 4 wells per condition. Data in bar graphs are presented as mean ± s.e.m. Statistical analysis was determined by two-tailed t-test for data in ce, comparing PBS serum (US) versus BCG serum (US) and PBS serum (S) versus BCG serum (S) within each time point poststimulation for data in f and g, comparing PBS serum (S) versus BCG serum (S) for hj, comparing to BCG-S.
Fig. 8
Fig. 8. Water supplemented with microbial metabolites in BCG-vaccinated hosts leads to innate immune training in AMs in naive mice.
a, Experimental schema of in vivo continuous supplementation of circulating SCFAs butyrate and l-carnitine via (DW + M) given to naïve mice for 3 weeks. Mice were then placed on regular DW for 1 week. The control animals were on regular DW. b,c, IL-6 (*P = 0.0071) (b) and MIP-1α (*P = 0.0381) (c) protein production by airway AM isolated from animals on DW + M or DW, with (S) or without (US) re-stimulation. n = 3 mice per group. d, PCA of gene expression in airway AM from metabolite-supplemented (DW + M) and control (DW) hosts with (S) or without (US) stimulation. n = 3 mice per group. e, Signature scores of genes involved in Ag processing and presentation in airway AM comparing control (DW) with metabolite-supplemented (DW + M) animals with (S) and without (US) stimulation (P = 4.34 × 10−6). Horizontal lines in violin plots denote medians and dotted lines denote lower and upper quartiles. f, Numbers of M. tuberculosis CFU in the lung tissue of naive animals given metabolite-supplemented water (DW + M) compared to BCG-vaccinated (DW + M versus BCG, *P = 0.0203) (BCG versus PBS *P = 0.0115) n = 3 mice in PBS group, n = 4 mice in BCG group, 4/DW + M. gj, Comparing MFI of MHC II expression in airway AM from WT (**P = 0078 and *P = 0.0118) (g), TLR2KO (**P = 0.0043) (h), TLR4KO (i) and NOD2-KO (**P = 0.0062) (j) mice trained ex vivo with BCG-conditioned or control serum and upon restimulation after 3-d resting. Data in bar graphs are presented as mean ± s.e.m. Statistical analysis was done by two-tailed t-test for data in b, c and f. Adjusted P values are presented for violin plots (e) and obtained using limma package and BH correction (Methods). Statistical analysis was determined by two-tailed t-test for data in gj, comparing PBS serum (US) versus BCG serum (US) and PBS serum (S) versus BCG serum (S).
Extended Data Fig. 1
Extended Data Fig. 1. Characterization of innate memory phenotype of alveolar macrophages following s.c. BCG vaccination.
(a) MFI of MHC II expression on lung tissue AM with (S) or without (US) stimulation (**p = 0.0012, ***p = 0.0004). (b & c) Frequencies of IL-6- and TNF-producing lung tissue AM with (S) or without (US) stimulation. (d) Real-time oxygen consumption rate (OCR) in airway AM at 8-wks post-BCG vaccination. (e) Experimental schema. (f & g) Histograms of incorporation of BrdU by airway AM and frequencies of BrdU-incorporated airway AM (*p = 0.0475) (f) & measure of MFI of MHCII on BrdU + (*p = 0.0430) and BrdU- (p = 0.0519) airway AM (g). n = 3 mice/group. (h) Experimental schema. (i, j & k) Measure of MFI of MHCII on airway and lung tissue AM (*p = 0.0365) (i), frequencies of IL-6- (j) and TNF- (k) producing airway and lung tissue AM (*p = 0.0249). n = 3 mice/group/airway, 4 mice/group/lung tissue. (l) Real-time extracellular acidification rate (ECAR) in airway AM and glycolysis, glycolytic capacity and glycolytic reserve in airway AM (****p = 4 mice/group. (m) Measure of MFI of MHCII expression on airway AM (*p = 0.0497) and frequencies of IL-6- (**p = 0.0082) and TNF-producing airway AM at 5-wks post-vaccination with viable BCG or inactivated BCG (BCG-ia) or PBS with (S) or without (US) re-stimulation. n = 3 mice/group. Data in a-c are representative of two independent experiments (n = 3 mice/group). Data in bar graphs are presented as mean ± SEM. One-way ANOVA was used for multiple comparison followed by Bonferroni’s test for data in a-c and i-k, two-tailed t test for data in f, g & l and one-way ANOVA, followed by Dunnett’s multiple comparison test for data in m.
Extended Data Fig. 2
Extended Data Fig. 2. Transcriptional signatures of memory alveolar macrophages induced by s.c. BCG vaccination and respiratory mucosal viral-vectored vaccine.
(a) Heatmap of genes differentially expressed in airway AM by at least one of the comparisons. The difference was called when an absolute fold change was at least 1.5. Data are average levels of expression for each gene in each group. (b) Volcano plot for the comparison of airway AM from BCG-vaccinated vs. PBS animals without stimulation (US), with a threshold of absolute fold change set at 1.5. (c) Volcano plot for the comparison of airway AM from BCG-vaccinated vs. PBS animals with M.tb WCL stimulation (S), with a threshold of absolute fold change set at 1.5. (d) Pathways of the genes significantly up-regulated in un-stimulated (US) airway AM from BCG-vaccinated animals compared to those from PBS-treated animals. (e & f) Comparison of signature scores of the genes involved in glycolysis (e) and mTOR (f) in airway AM of BCG-vaccinated animals with those from control PBS animals, with (S) or without (US) stimulation. (g) Volcano plot for the comparison of airway AM from intranasal adenoviral-vectored vaccine (Ad)-immunized vs. PBS control animals without stimulation (US) with a threshold of absolute fold change set at 1.5. (h) Comparison of signature scores of the genes involved in Ag processing/presentation (****p = 6.15×10⁻⁷), fatty acid oxidation (*p = 1.6×10⁻²), glycolysis and mTOR pathway in airway AM of intranasal adenoviral-vectored vaccine (Ad)- immunized animals with those from PBS control animals without (US) stimulation. Horizontal lines in violin plots denote medians and dotted lines denote lower and upper quartiles. Data in a-g are from experiments with 3 samples/group/condition. Vertical lines in volcano plots (b, c & g) denote the threshold of absolute fold change 1.5 and the horizontal line denotes adjusted p value set at 0.05. Significant genes are marked in colors with up-regulated ones in red and down-regulated ones in blue. Adjusted p values are presented for violin plots (h) and obtained using limma package and BH correction (see Methods).
Extended Data Fig. 3
Extended Data Fig. 3. Characterization of antigen presentation and anti-microbial capabilities of memory alveolar macrophages.
(a) Experimental schema. b, Experimental schema. (b) Representative histograms of proliferating Ag85B-specific CD4 T cells in response to Ag85 -loaded airway AM from BCG-vaccinated or PBS-treated animals, calibrated as the extent of CFSE label dilution. (c) Frequencies of Ag85B+ CD4 T cells in each generation (G) of proliferation. p = 0.0517 for G0, *p = 0.0232 for G1. n = 3 mice/group. (d) Percent of phagocytosed bacteria killed at 24 (****p (***p = 0.0006) post-M.tb infection by lung tissue CD11C+CD11b+ antigen-presenting cells (APC) from BCG-vaccinated or PBS-treated animals. n = 4 mice/group. (e) Representative flowplots and frequencies of necrotic and apoptotic BCG-dsRed-infected airway AM of BCG-vaccinated and PBS-treated animals at 24 hrs post-infection. n = 3 mice/group. Data in bar graphs are presented as mean ± SEM. Statistical analysis was determined for data in c & d by two-tailed t test.
Extended Data Fig. 4
Extended Data Fig. 4. Kinetics of CD4 T cell responses in the lung tissue following pulmonary M.tb infection.
(a) Representative dotplots of lung mononuclear cells immunostained for surface markers CD4 and CD44 and gated to distinguish bona fide lung parenchymal T cells (LPT) from lung intravascular cells (LV) using CD45.2 antibody administered intravenously 3-5 min before sacrificing 5-wk PBS-treated or BCG-vaccinated mice. Data is from one experiment. (b) Mice were s.c. BCG-vaccinated or PBS-treated for 5-weeks. Airway AM harvested by bronchoalveolar lavage from PBS-treated (PBS-AM) and BCG-vaccinated (BCG-AM) were then adoptively transferred to naïve mice and challenged with M.tb. M.tb CFU in the lung at 3 days post-infection (n = 4 mice per group) were assessed. Data is from one experiment.
Extended Data Fig. 5
Extended Data Fig. 5. Immune characterization of circulating monocytes.
(a) Gating strategy used for identification of circulating monocytes in the peripheral blood. Live CD45+ cells were gated to remove CD3+ T cells (CD3-) and CD11b+Ly6G+ neutrophils (neutrophil-). The remaining cell population was gated to identify classical CD11b+Ly6Chigh and nonclassical CD11b+Ly6Clow circulating monocytes. (b) Representative histograms (n = 3 mice/group) comparing levels of MHCII expression on Ly6Chigh and Ly6Clowmonocytes in the peripheral blood of BCG-vaccinated and PBS-treated hosts cultured with (S) and without stimulation (US). (c & d) Frequencies of IL-6-producing Ly6Chigh and Ly6Clow monocytes and frequencies of TNF-producing Ly6Chigh monocytes with (S) and without (US) stimulation. n = 3 mice/group. (e) IL-6 (*p = 0.015), IL-1β (***p = 0.0007), TNF, IL12p40 (*p = 0.0173), IP10 (*p = 0.0229), MIP-1-α (*p = 0.0407) and RANTES (**p = 0.0024) protein contents in the plasma (pg/ml) of BCG-vaccinated or PBS control animal-derived whole blood samples cultured with (S) and without (US) stimulation. n = 3 mice/group. Data are presented as mean ± SEM, representative of two independent experiments. Statistical analysis was determined by two-tailed t test for data in e.
Extended Data Fig. 6
Extended Data Fig. 6. Macrophage subsets in the lung, ex vivo M.tb killing by alveolar macrophages from CCR2KO mice, and role of IFN-γ in induction of memory alveolar macrophages.
(a & b) Representative dotplots of SiglecF+Ly6C alveolar macrophages (AM) gated on CD64+CD24 macrophages in the airway and lung tissue at 2-wk post-PBS treatment or BCG vaccination, & Monocyte-derived (MDM) and interstitial (IM) macrophages in lung tissue were identified as SiglecFLy6C+ and SiglecFLy6C, respectively. Total numbers of different macrophage subsets in the airway and lung tissues are presented in the bar graphs. (c) Mycobacterial killing capacity of airway AM from 5-wk BCGvaccinated or PBS-treated CCR2KO animals was assessed by ex vivo killing assay. Total numbers of intracellular M.tb CFU were assessed at 24 hr after ex vivo infection. Each point represents biologically independent samples (*p = 0.0351). n = 3 wells/PBS; n = 4 wells/BCG. Data are presented as mean ± SEM. (d) Frequencies of TNF-producing airway AM (unstimulated-US vs stimulated -S) from PBS control, BCG-vaccinated or BCG-vaccinated/IFNγ-depleted animals (*p = 0.0031). n = 3 mice/group. Data are presented as mean ± SEM. and data in d are analyzed by one-way ANOVA for multiple comparison followed by Bonferroni’s test. Statistical analysis for data in c was determined by two-tailed t test.
Extended Data Fig. 7
Extended Data Fig. 7. Altered gut microbiome, histomorphology and epithelium junction protein distribution following BCG vaccination.
(a) Different gross appearance of the cecum from control PBS-treated and BCG-vaccinated animals. Representative of three independent experiments. n = 5 mice/group (b) Relative abundance profiles of top 9 bacterial phyla based on OTU data in 5-wk BCG-vaccinated (n = 5) and PBS control (n = 6) animals. Representative of two independent experiments. (c) Alpha diversity comparison based on operational taxonomic unit (OTU) richness in cecum microbiota using Chao1 diversity measure (t-test) between 2-wk BCG-vaccinated (n = 5) and control PBS (n = 4) animals. Horizontal lines in box plot denote medians and the length of the box denotes lower and upper quartile, and the whiskers denote minimum and maximum values. (d) Relative abundance profiles of top 8 bacterial phyla based on OTU data in 2-wk BCG-vaccinated and control PBS animals. n = 4 mice/PBS, 5/BCG. (e) Beta diversity comparison of cecal microbial communities in 2-wk BCG-vaccinated and PBS animals using PCoA ordination method and Jenson-Shannon divergence distance method (PERMANOVA). (f) Bar graph comparing frequencies of top 4 abundant bacterial families in cecal microbiota of 2-wk BCG-vaccinated hosts with those in PBS control hosts. (g) Histologic scoring of architectural changes, epithelium alterations and inflammatory infiltrates of the colon from 5-wk BCG-vaccinated and PBS control animals. Representative of two independent experiments. n = 6 mice/group. (h) Histologic comparison of colon tissues from 2-wk, 5-wk, 8-wk BCG-vaccinated and PBS control hosts. Representative of n = 5 mice/2wk, 6 mice/5wk, 4 mice/8wk post-BCG. (i) Immunohistochemical staining of gut epithelium junction occludin protein in 5-wk BCG-vaccinated and PBS control animals. Representative of n = 6 mice/PBS, 5 mice/BCG. Data in bar graphs are presented as mean ± SEM.
Extended Data Fig. 8
Extended Data Fig. 8. Altered microbial metabolic profile in gut, serum and lung, and undetectable LPS in serum following BCG vaccination.
(a) Comparison of creatinine levels in cecal tissue samples of 5-wk BCG-vaccinated and PBS animals. *p = 0.0330 (b) PLS-DA analysis on metabolic profiles in the colon tissue samples of 5-wk BCG-vaccinated and PBS animals. (c) Comparison of lactic acid levels in colon tissue samples of 5-wk BCG-vaccinated and PBS animals. *p = 0.0122 (d) Importance of the serum metabolites to the whole model identified by variable importance in projection (VIP) analysis. Colored boxes on the right denote comparative levels of serum metabolite between 5-wk BCG-vaccinated and PBS control serum samples. (e) Pathway analysis of serum metabolites of 5-wk BCG-vaccinated and PBS control animals with VIP score greater than 1.5 analyzed by Metaboanalyst 5.0, “pathway analysis-targeted” using Mus musculus (KEGG) pathway library. Three pathways were identified as significant involving identified serum metabolites with VIP score greater than 1.5. (f) Proportions of acetate and propionate SCFAs calculated out of total concentration (mM/g) of SCFAs in cecal tissue samples of 5-wk BCG-vaccinated and PBS animals. *p = 0.0234 (g) LPS levels in the serum of 3-wk and 5-wk BCG-vaccinated and PBS control animals. n = 5 mice/group. (h) Lung tissue metabolites in 2-wk and 5-wk BCG vaccinated animals and PBS control animals (n = 10 mice/group) identified by variable importance in projection (VIP) analysis. Colored boxes on the right denote comparative levels of metabolite between BCG-vaccinated and control samples. Data in a-f is from two pooled experiments (n = 16 mice/group). Horizontal lines in box plots denote medians and the length of the box denotes lower and upper quartile, and the whiskers denote minimum and maximum values. Statistical analysis was determined by two-tailed t test for data in a, c & f.
Extended Data Fig. 9
Extended Data Fig. 9. Innate immune training of alveolar macrophages by circulating microbial metabolites in BCG-vaccinated animals.
(a) Representative bright-field microscopic images of AM after training with BCG-conditioned or control serum and resting before re-stimulation. The arrow points to the clusters and increased size and spreading of AM resulting from BCG-conditioned serum-mediated training and cell division. (b) Heatmap of cytokine/chemokine protein levels (geometric mean) in the culture supernatant of unstimulated (US) or re-stimulated (S) airway AM from animals on DW or DW + M. Asterisks denote significantly increased cytokine/chemokine production upon stimulation by airway AM of DW + M hosts. (c) Representative dotplots showing reduced classical CD11b+Ly6Chigh monocytes in the circulation of animals on DW + M compared to those on DW. (d) MFI of Ly6C or MHCII expression on circulating monocytes of DW vs. DW + M animals (*p = 0.0314, ***p = 0.0007). Data are presented as mean ± SEM. n = 4 mice/DW, 3 mice/DW + M. (e) Heatmap of cytokine/chemokine protein levels (geometric mean) in the plasma of unstimulated (US) and stimulated (S) whole blood cultures of DW and DW + M animals. n = 4 mice/DW, 3 mice/DW + M. (f) Representative micrographs of H&E-stained colonic tissue sections from animals on DW and DW + M. (g) Volcano plot for the comparison of expression of select genes in airway AM from animals on DW + M vs. those on DW without stimulation (US), with a threshold of absolute fold change set at 1.5. (h) Volcano plot for the comparison of expression of select genes in airway AM from animals on DW-M vs. those on DW after stimulation (S), with a threshold of absolute fold change set at 1.5. (i-k) Comparison of signature scores of the genes involved in fatty acid oxidation (*p = 0.0209), glycolysis and mTOR (*p = 0.0209) in airway AM of animals on DW + M or DW, with (S) or without (US) stimulation. n = 3 mice/group. Horizontal lines in violin plots denote medians and dotted lines denote lower and upper quartiles. Data in a-c are representative of two independent experiments (n = 4 wells/condition). Vertical lines in volcano plots (g & h) denote the threshold of absolute fold change 1.5 and the horizontal line denotes adjusted p value set at 0.05. Significant genes are marked in colors with up-regulated ones in red and down-regulated ones in blue. Statistical analysis was determined by two-tailed t test for data in d. Adjusted p values are presented for violin plots (i & k) and obtained using limma package and BH correction (see Methods).
Extended Data Fig. 10
Extended Data Fig. 10. Illustration of the major findings from the current study in the context of what has previously been observed in the relevant field.
Recent evidence indicates that parenteral/systemic exposure to vaccine or microbe may lead to centrally induced innate immune memory and trained immunity (TII) via imprinting the myeloid progenitors in the bone marrow and subsequent releasing into the blood stream of trained monocytes. On the other hand, respiratory mucosal exposure to vaccine or microbe may induce mucosal tissue-resident memory macrophages and TII in the lung. There is also evidence that respiratory infection may cause gut microbiota dysbiosis. However, it has remained unclear whether parenteral vaccination could lead to gut dysbiosis and altered gut barrier function and metabolome, thus going on to induce mucosal-tissue resident memory macrophages and TII in a distal mucosal organ, the lung. Indeed, our current study finds that following s.c. BCG vaccination, initially BCG bacilli spread to the gut-associated tissues and lead to a time-dependent remarkable changes in gut microbiota and barrier permeability, and metabolomic changes not only in the gut but also in the serum and lung tissue. Thus, such a widespread immunological alert across a number of tissue sites threaded through a microbial metabolomic pathway ultimately results in a time-dependent induction of trained tissue-resident macrophages and innate immunity in the lung.

Comment in

References

    1. Bekkering S, Domínguez-Andrés J, Joosten LAB, Riksen NP, Netea MG. Trained immunity: reprogramming innate immunity in health and disease. Annu. Rev. Immunol. 2021;39:667–693. doi: 10.1146/annurev-immunol-102119-073855. - DOI - PubMed
    1. Netea MG, et al. Defining trained immunity and its role in health and disease. Nat. Rev. Immunol. 2020;20:375–388. doi: 10.1038/s41577-020-0285-6. - DOI - PMC - PubMed
    1. Xing Z, et al. Innate immune memory of tissue‐resident macrophages and trained innate immunity: re‐vamping vaccine concept and strategies. J. Leukoc. Biol. 2020;108:825–834. doi: 10.1002/JLB.4MR0220-446R. - DOI - PubMed
    1. Benn CS, Netea MG, Selin LK, Aaby P. A small jab—a big effect: nonspecific immunomodulation by vaccines. Trends Immunol. 2013;34:431–439. doi: 10.1016/j.it.2013.04.004. - DOI - PubMed
    1. Giamarellos-Bourboulis EJ, et al. Activate: randomized clinical trial of BCG vaccination against infection in the elderly. Cell. 2020;183:315–323. doi: 10.1016/j.cell.2020.08.051. - DOI - PMC - PubMed

Publication types

Grants and funding