Clinical Trial
. 2022 Dec;28(12):2633-2645.
doi: 10.1038/s41591-022-02059-9. Epub 2022 Dec 1.

Angiopoietin-like 3-derivative LNA043 for cartilage regeneration in osteoarthritis: a randomized phase 1 trial

Affiliations
Clinical Trial

Angiopoietin-like 3-derivative LNA043 for cartilage regeneration in osteoarthritis: a randomized phase 1 trial

Nicole Gerwin et al. Nat Med. 2022 Dec.

Abstract

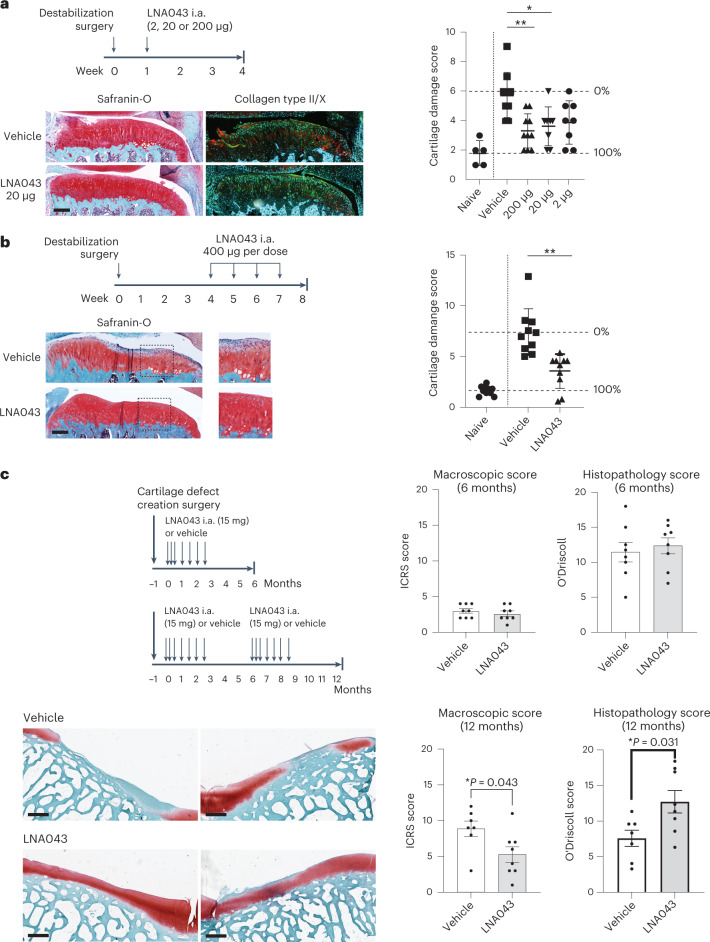
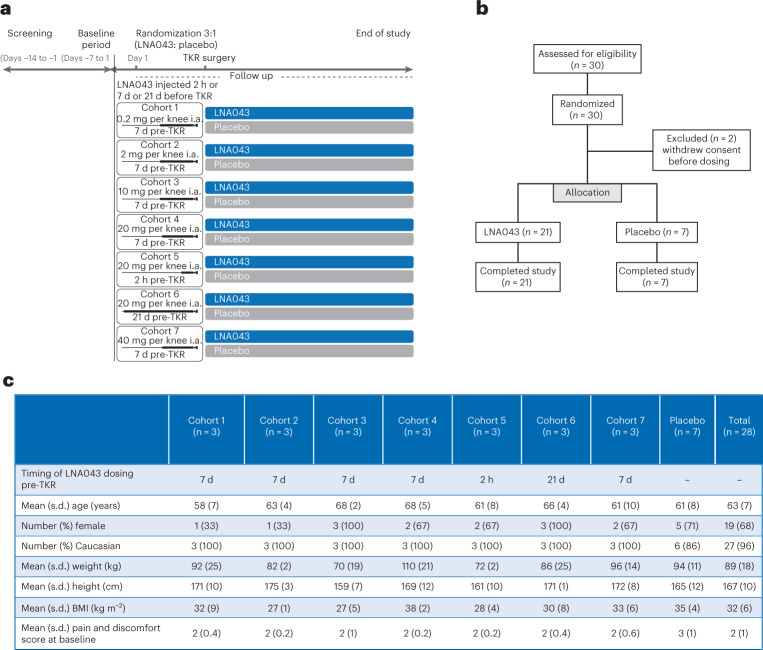
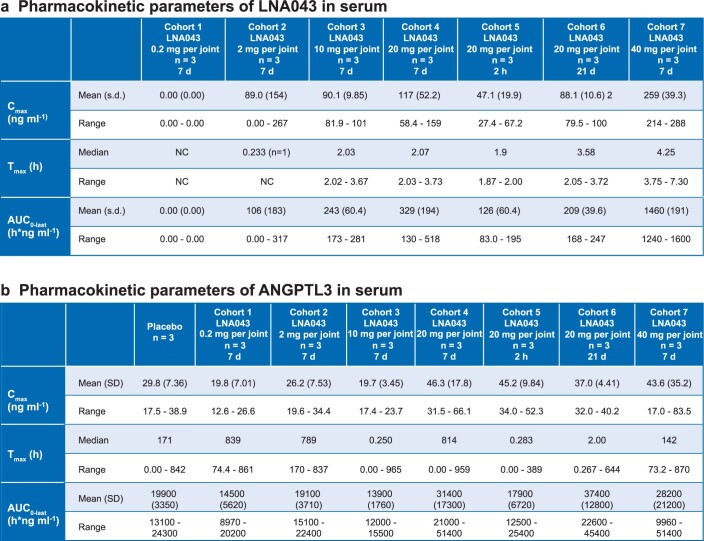
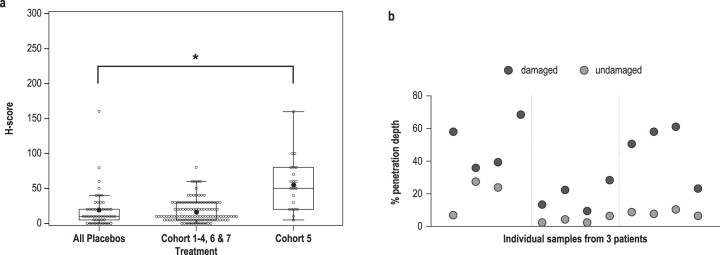
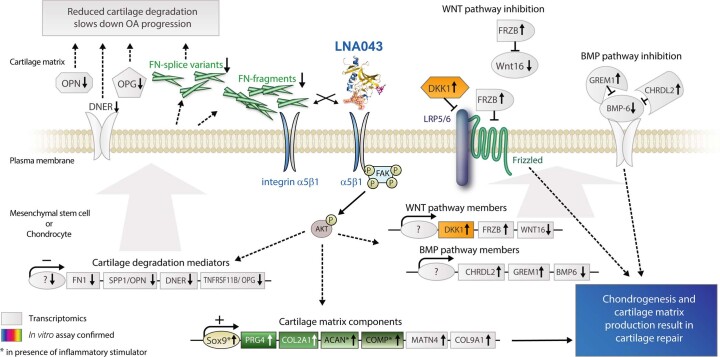
Osteoarthritis (OA) is a common, debilitating, chronic disease with no disease-modifying drug approved to date. We discovered LNA043-a derivative of angiopoietin-like 3 (ANGPTL3)-as a potent chondrogenesis inducer using a phenotypic screen with human mesenchymal stem cells. We show that LNA043 promotes chondrogenesis and cartilage matrix synthesis in vitro and regenerates hyaline articular cartilage in preclinical OA and cartilage injury models in vivo. LNA043 exerts at least part of these effects through binding to the fibronectin receptor, integrin α5β1 on mesenchymal stem cells and chondrocytes. In a first-in-human (phase 1), randomized, double-blinded, placebo-controlled, single ascending dose, single-center trial ( NCT02491281 ; sponsored by Novartis Pharmaceuticals), 28 patients with knee OA were injected intra-articularly with LNA043 or placebo (3:1 ratio) either 2 h, 7 d or 21 d before total knee replacement. LNA043 met its primary safety endpoint and showed short serum pharmacokinetics, cartilage penetration and a lack of immunogenicity (secondary endpoints). Post-hoc transcriptomics profiling of cartilage revealed that a single LNA043 injection reverses the OA transcriptome signature over at least 21 d, inducing the expression of hyaline cartilage matrix components and anabolic signaling pathways, while suppressing mediators of OA progression. LNA043 is a novel disease-modifying OA drug candidate that is currently in a phase 2b trial ( NCT04864392 ) in patients with knee OA.


Conflict of interest statement

N.G., C.S., C.H., M.F., J.E., Y.Z., J.S., S.W., Y.L., C.J., N.L., M.B., G.G., T.P., I.V., I.K., S.G., A.S., D.L., M.S., S.B., R.R. and M.K. are employees and shareholders of Novartis. F.P. is an employee of Novartis. S.C. is a current employee of IQVIA and was an employee of Novartis Healthcare. K.J. is a current employee of Calibr and was an employee of the Novartis Institutes for BioMedical Research. K.A.W. is a current employee and equity owner in Ultivue and a former employee and stockholder in Leica Biosystems/Danaher and the Novartis Institutes for BioMedical Research. J. Goldhahn was an employee of the Novartis Institutes for BioMedical Research and has no other competing interests. J.P. and J. Gimbel declare no competing interests.

Figures

Fig. 1
Fig. 1. LNA043 induces chondrogenesis and DKK1, PRG4 and collagen type II secretion, but not angiogenesis.
a, Left, PRG4 production by 3D hMSCs. PRG4 IHC staining after 28 d of LNA043 treatment. Green, PRG4; blue, DAPI. Comparable effects of LNA043 were detected in hMSCs from four (out of four) donors. Scale bar, 100 μm. Right, PRG4 secretion, as determined by ELISA, generated from one donor in quadruplicate (one representative experiment shown out of eight). b, DKK1 secretion by 3D hMSCs. The accumulation of DKK1 between days 8 and 11, 15 and 18 and 22 and 25 was quantified by ELISA (one representative experiment shown out of three; n = 3 biological replicates). Comparable effects of LNA043 were detected in hMSCs from two (out of four) donors. c, Osteogenic and adipogenic marker expression in 3D hMSCs. ALPL (left) and LEP expression (middle) were determined by quantitative reverse transcription PCR (one representative experiment shown out of six; n = 3 biological replicates). Right, LEP secretion as determined by ELISA (one representative experiment shown out of four; n = 6 biological replicates) following 28 d of LNA043 treatment. Comparable LNA043 effects on ALPL, LEP and LEP levels were detected in hMSCs from four (out of four) donors. d, DKK1 secretion by C-28/I2 cells, as determined by ELISA, following 24 h culture with LNA043 (one representative experiment shown out of >10; n = 3 biological replicates). e, DKK1 secretion by C-28/I2 cells, as determined by ELISA, following 24 h culture in the presence of LNA043 (23 μM = ~600 μg ml−1), ANGPTL3, ANGPTL2 or ANGPTL4 one representative experiment shown out of two; n = 2–3 biological replicates). Single, double and triple crosses represent the first signs of toxicity, few intact cells remaining and many particles or cell debris present, respectively. The toxicity scores are based on cell morphology (bright-field microscopy). f, PRG4 (left) and collagen type II increase (right) in the supernatants of human OA cartilage explants, as determined by ELISA (n = 15; from two donors). One half of each explant was cultured with LNA043, while the other half was cultured with vehicle for 24 h. g, LNA043 (left), unlike ANGPTL3 (right), does not induce angiogenesis. The cumulative sprout length (CSL) was measured in HUVEC spheroids incubated with LNA043, ANGPTL3, VEGF-A (25 ng ml−1) or bFGF (25 ng ml−1) for 24 h. The data are representative of three independent experiments. Each individual data point per experiment represents the mean CSL of ten randomly selected spheroids and is expressed as a percentage of basal control. In ag, the values represent means ± s.d. Statistical significance was determined by one-way ANOVA (a, b, d, e and g), one-way ANOVA performed on each day separately (c) or two-tailed paired t-test (f). P values are provided in Extended Data Table 1 (*P < 0.05; **P < 0.01; ***P < 0.001; ****P < 0.0001).
Fig. 2
Fig. 2. Integrin α5β1 is required for LNA043-induced DKK1 secretion by C-28/I2 chondrocytes and binds LNA043.
a, LNA043-induced DKK1 secretion is integrin α5-dependent. Integrins α5 and αv were knocked down in C-28/I2 cells by siRNA (siITGA5 and siITGAV, respectively; siITGA5+V for both combined). Left, DKK1 secretion induced by LNA043 (200 μg ml−1), as analyzed by ELISA. The data represent means ± s.e.m. of 3–8 independent experiments (from left to right, ***P = 0.0003, *P = 0.0391, *P = 0.0178 and ****P ≤ 0.0001). Statistical significance was determined by one-way ANOVA with mixed-effect analysis and Šídák’s multiple comparison test. Middle, efficiency of the knockdown, as monitored by immunoblotting. GAPDH was used as a loading control. Right, quantification of the immune bands, as determined by densitometry. The data are presented as a percentage decrease ± s.e.m. versus control siRNA (siCtrl) and represent six independent experiments (****P ≤ 0.0001). Statistical significance was determined by one-way ANOVA with Tukey’s multiple comparison test. b, LNA043 interacts with α5β1 integrin in vitro, as shown by co-IP experimentation. Recombinant human α5β1 integrin (rhα5β1) or recombinant human αvβ3 integrin (rhαvβ3) were incubated with LNA043 for 1 h at 37 °C. Immunoprecipitation was performed using a monoclonal antibody to α5β1 (anti-α5β1) or αvβ3 integrin (anti-αvβ3) followed by western blot analysis (right) with monoclonal antibodies to the α5 (left) or αv (middle) integrin subunit or ANGPTL3, which recognize LNA043 (right). One representative experiment is shown out of two to four independent experiments. c, SPR single-cycle binding studies. LNA043 (top left and top right), FN1 (bottom left) or VTN (bottom right) were immobilized on a CM5 sensor. Integrins α5β1 (left) or αvβ3 (right) served as analytes (0.6–10 µM). The sensorgrams were fitted with a 1:1 binding fit. One representative experiment is shown out of three independent experiments with comparable results. RU, resonance units. Source data
Fig. 3
Fig. 3. LNA043 treatment regenerates cartilage in rat OA and minipig cartilage injury models.
a, Short-term rat OA model. Top left, schematic of the experimental design. i.a., intra-articular. Bottom left, representative images of knee joint sections from rats treated with vehicle or 20 μg LNA043 and stained with Safranin-O (red) or combined collagen type II (green) and X (red) IHC and counterstained with DAPI at 4 weeks post-RMT surgery. Scale bar, 200 μm. Right, cartilage damage, as determined by modified OARSI scoring (Supplementary Table 4) for naive (no surgery; n = 5), vehicle-treated (n = 9) and LNA043-treated rats (for 2 μg, n = 8; for 20 μg, n = 8; for 200 μg, n = 10). The data represent means ± s.d. Each data point represents the results from an individual rat. The percentage cartilage repair in LNA043-treated rats was calculated as the improvement in the score in vehicle-treated (0%) compared with naive rats (100%). Statistical significance was determined by Kruskal–Wallis non-parametric test with Dunn’s multiple comparison (*P = 0.279; **P = 0.0041). b, Therapeutic rat OA model. Top left, schematic of the experimental design. Bottom left, representative images of knee joint sections from rats treated with four weekly injections of vehicle or 400 μg LNA043 and stained with Safranin-O (red) 8 weeks post-meniscal tear surgery. Scale bar, 200 μm. The images to the right are magnifications of the sections highlighted by a dashed box to the left. Right, cartilage damage, as determined by modified OARSI scoring for naive, vehicle-treated and LNA043-treated rats (n = 10 per group). Data analysis and representation as in a (**P ≤ 0.0027). For a and b, the maximum cartilage damage score was 16. c, Minipig cartilage injury model. Top left, schematic of the experimental design. Bottom left, representative images of cartilage defect sites in trochlea stained with Safranin-O (red) at 12 months after two cycles of seven weekly/biweekly intra-articular injections of vehicle or 15 mg LNA043. The left and right images show the results from two different pigs. Scale bars, 700 μm. Right, cartilage quality was assessed macroscopically by the ICRS cartilage damage score (top and bottom left; Supplementary Table 5; 0 = normal; 20 = maximum damage), and cartilage repair was quantified in histopathology sections using a modified O’Driscoll cartilage repair score (top and bottom right; Supplementary Table 6; 21 = maximum repair), for vehicle-treated (n = 8) and LNA043-treated minipigs (n = 8) at 6 months (top) and vehicle-treated (n = 7) and LNA043-treated minipigs (n = 8) at 12 months (bottom). The data represent means ± s.e.m. Statistical significance was determined by two-tailed non-parametric Mann–Whitney U-test.
Fig. 4
Fig. 4. LNA043 FIH study design and baseline data.
a, CLNA043X2101 study design summarizing the study periods and treatment arms. The end of study visit was at day 36 for cohorts 1–4 and 7, at day 29 for cohort 5 and at day 50 for cohort 6. b, CONSORT diagram showing the flow of patients at each stage of the FIH trial. c, Baseline data and demographics. BMI, body mass index.
Fig. 5
Fig. 5. LNA043 is safe in the FIH study.
a, Table summarizing the adverse events (AEs) that occurred at least twice, reported per treatment arm and not showing clear trends in safety. b, Table reporting all of the serious adverse events (SAEs), also not showing safety trends, and with none of them suspected to be related to LNA043. Cohorts 1 and 4–6 are not included as there were no SAEs in these cohorts; however, the final column includes these participants in the total.
Fig. 6
Fig. 6. LNA043 penetrates damaged cartilage and reverts the OA transcriptional signature in FIH study patients.
a, Representative images of LNA043 detection by IHC in TKR cartilage from patients with OA in the FIH trial 2 h post-LNA043 injection (left) or after placebo treatment (right). LNA043 (brown stain) showed deeper penetration into damaged (red bracket) than intact cartilage (green bracket). Cartilage from placebo-injected patients showed no LNA043-specific staining. Unspecific staining was seen in all specimens at the tidemark (arrows). The arrowheads indicate the superficial tear characteristic of damaged cartilage. These images are representative of 21 (LNA043 injection) and 49 (placebo treatment) IHC-stained cartilage samples. Scale bar, 600 μm. b, Transcriptomics study design. Damaged and undamaged articular cartilage samples were profiled from patients with OA injected with placebo (n = 7) or 20 mg LNA043 at 2 h, 7 d or 21 d (n = 3 each) before TKR. c, Left, heatmap showing the expression changes expressed as log2[fold change] (log2[FC]) of the 28 genes statistically significantly regulated by LNA043. OA damage refers to damaged versus undamaged cartilage in the placebo group; 2 h, 7 d and 21 d refer to damaged cartilage with LNA043 compared with placebo treatment. Numbers below the heatmap indicate the number of significantly regulated genes for each timepoint comparison. The 23 genes at the top are upregulated by LNA043, and the 5 genes at the bottom are downregulated by LNA043. Right, temporal expression profiles of three genes significantly and consistently downregulated by LNA043, expressed as log2[counts per million reads] (log2[CPM]). Statistical significance was determined by limma moderated t-test (defined as a Benjamini–Hochberg adjusted P value of ≤0.05 versus placebo; *PFN1 = 8.40 × 10−5 (2 h); *PFN11.57 × 10−9 (21 d); *PSPP1/OPN = 1.09 × 10−4; *PDNER = 0.012145). The data are presented as means ± s.d. d, Significant concordance between curated public OA disease signatures and FIH-derived OA signatures. LNA043 gene signatures inversely correlate with OA disease signatures. These were generated from the SkeletalVis repository and from published transcriptomics studies. Enrichment is expressed as the negative log10 of the false discovery rate [FDR] from GSEA. The signs indicate the direction of enrichment. Blue color intensity indicates enrichment in downregulated genes, and red color enrichment in upregulated genes. EGFR1, epidermal growth factor receptor 1. e, Reversal of OA-associated transcriptome changes in the FIH study by LNA043. Left, heatmaps of expression changes (log2[FC]) for genes regulated with a nominal limma moderated t-test P ≤ 0.05. Below the heatmaps are boxplots summarizing the log2[FC] for all genes in the heatmap per group. Central lines and box edges represent median values and upper and lower quartiles, respectively, and the whiskers represent 1.5× the interquartile range. The numbers of genes counter-regulated by LNA043 are shown in the bar plots below the boxplots. Right, temporal transcriptional response to LNA043 for OA-relevant pathway genes (expressed as the mean log2[CPM] ± s.d.). Statistical significance was defined as in c.
Extended Data Fig. 1
Extended Data Fig. 1. Viability of C-28/I2 cells upon LNA043 treatment and absence of a proliferative effect of LNA043 during chondrogenic rescue in UE7T-13 cells.
a, Viability of C-28/I2 cells upon LNA043 treatment. Absence of cytotoxicity of LNA043 in C-28/I2 cells treated for 24 h in C-28/I2 test medium supplemented with LNA043 was determined by CellTiter-Glo® (Promega). Levels are expressed in relative light units (RLU). Values are mean ± s.d. of measurements from a representative experiment with biological triplicates. b, Absence of a proliferative effect of LNA043 during the chondrogenic rescue in UE7T-13 cells. Proliferation was assessed in UE7T-13 cells cultivated for 3, 7, 11 and 14 d in UE7T-13 chondrogenic medium supplemented or not with 0.5 μg ml-1 Poly I:C (PIC), 100 or 200 μg ml-1 LNA043 by CellTiter-Glo® (Promega). Levels are expressed in relative light units (RLU). Values are mean ± s.d. of measurements from biological triplicates. In a and b statistical significance was determined by one-way ANOVA. No significant differences were observed between any of the conditions.
Extended Data Fig. 2
Extended Data Fig. 2. LNA043 partially preserves chondrogenic activity in immortalized hMSC and primary human OA chondrocytes in inflammatory conditions.
a-d, UE7T-13 cells cultivated in chondrogenic medium supplemented with Poly I:C (PIC) and/or LNA043 (100 or 200 μg ml-1) as indicated. a, ACAN, SOX9 and COMP gene expression after 3, 7, 11 and 14 d culture. COMP secretion (ELISA) following 14 d treatment; one representative experiment is shown out of three, with n=3 biological replicates. b, Phase-contrast microscopic appearance of representative UE7T-13 cells cultured for 11 d in chondrogenic medium (A) or supplemented with 0.5 μg ml-1 Poly I:C (B) or 0.5 μg ml-1 Poly I:C and 100 μg ml-1 LNA043 (C) or 0.5 μg ml-1 Poly I:C and 200 μg ml-1 LNA043 (D). Areas of cartilage nodule formation are encircled by lines; scale bar = 100 μm. Middle: Alcian blue staining at 10 d in a 96-well plate in chondrogenic medium supplemented as indicated in A, B, C and D; one representative experiment shown out of three. c, IL6 gene and protein expression after 3 (gene only), 7, 11 and 14 d culture; one representative experiment shown out of three, with n=3 biological replicates. d, PRG4 ELISA of supernatant from 3D cultures of primary human OA articular chondrocytes, originating from one donor (one representative experiment shown out of three, n=3 biological replicates). After 14 d in chondrogenic medium cells were treated for 3 d with TNFα + IL-1β followed by a 7 and 11 d recovery period in the presence of LNA043 or vehicle. Comparable effects of LNA043 were detected with primary OA chondrocytes from 3 different donors. a, c, d, Values are means ± s.d. a, c, d, Statistical significance was determined by one-way ANOVA performed on each day separately; P-values are provided in Extended Data Table 2. (*P < 0.05; **P < 0.01; ***P < 0.001; ****P < 0.0001).
Extended Data Fig. 3
Extended Data Fig. 3. Tables summarizing the key pharmacokinetic parameters.
a, LNA043 pharmacokinetics, demonstrating fast clearance of LNA043 from circulation, and b, ANGPTL3 pharmacokinetics, not showing any impact of exposure to LNA043.
Extended Data Fig. 4
Extended Data Fig. 4. LNA043 cartilage penetration in the FIH study.
Data are analyzed using a linear mixed-effect model with repeated measures. The two-sided P-value was obtained by t-statistic. a, LNA043 staining detected only in cohort 5 samples from the CLNA043X2101 study, when LNA043 was injected 2 h before TKR. Individual data points and boxplot of the LNA043 staining score of osteochondral samples from all cohorts are shown. Positive staining was observed in cohort 5 (*P = 0.0002). Boxplot data is expressed as median and lower/upper quartiles and whiskers at 1.5 times the interquartile range. b, LNA043 diffuses deeper into damaged compared to undamaged cartilage. Scatter plot of LNA043 penetration depth in cartilage samples from cohort 5, expressed as % of cartilage thickness, which is positively stained. Measurements were performed by an expert pathologist (KAW) on n=11 samples, with 4 samples harvested from different areas of the knee (osteochondral biopsies from femoral condyle, patella, trochlea, tibia) for each of the 3 patients (1 sample missing, because there was no cartilage left). Dotted lines separate data from individual patients. P = 0.000000475 for LNA043 penetration depth in damaged compared to undamaged cartilage.
Extended Data Fig. 5
Extended Data Fig. 5. Genes significantly regulated by LNA043 treatment and RAAK OA signature counter-regulated by LNA043.
a, Log2[FC] (log2FC) of genes significantly regulated at either 2 h, 7 or 21 d after LNA043 treatment in damaged OA cartilage compared to placebo (Limma moderated t-test, Bejamini and Hochberg, P ≤ 0.05). Most-significantly regulated genes are shown in bold; fold upregulation is visualized by red color intensity, fold downregulation by blue color intensity, adjusted P-values (adj. P) ≤ 0.05 are shaded in yellow b, Temporal counter-regulation of RAAK OA signatures by LNA043. Signatures were generated from the RAAK study published by Ramos et al.. The enrichment significance for each geneset, defined as the negative log10 of the False Discovery Rate (-log10(FDR)), is plotted over time. Signs depict the direction of enrichment (positive for geneset upregulation and negative for geneset downregulation). Heatmap of the expression profiles of individual genes in the RAAK signatures. OA-associated changes in damaged versus undamaged OA cartilage are reverted by LNA043 treatment across all three timepoints in the FIH study. Downregulated genes, besides FN1 and OPN, encode TNFRSF11B/OPG (a subchondral bone remodeling regulator in OA,), inflammatory mediators like cytokine receptor-like factor 1 (CRLF1) and the middle zone articular cartilage marker C-X-C motif chemokine ligand 14 (CXCL14), as well as nerve growth factor (NGF) the key mediator of pain in OA (reviewed by Dietz et al.). Upregulated genes encode cartilage development pathway members whose expression correlates negatively with OA, besides CHRDL2, FRZB and COL9A1, the adipokine chemerin (RARRES2). Data are expressed as log 2[FC](log2FC). c, Temporal expression profiles of selected members of the RAAK signatures in damaged and undamaged cartilage upon LNA043 treatment. Expression levels are expressed as log2[CPM] (log2CPM). Data is represented as mean ± s.d.
Extended Data Fig. 6
Extended Data Fig. 6. LNA043 MoA hypothesis.
LNA043 binding to the FN1 receptor, integrin α5β1, and intracellular signaling e.g. via FAK and AKT phosphorylation induces transcriptional counter-regulation of OA-relevant gene expression. Specifically, a, up-regulation of essential cartilage matrix components PRG4, COL2A1, ACAN, COMP, MATN4, COL9A1 results in cartilage matrix synthesis; b, regulation of genes DKK1, FRZB, WNT16 inhibits WNT signaling, which induces chondrogenesis and cartilage regeneration; c, regulation of genes CHRDL2, GREM1, BMP6 inhibits BMP signaling, which prevents detrimental chondrocyte hypertrophy and mineralization in OA; d, downregulation of OA progression mediators OPN, DNER, OPG as well as FN1 splice variants and FN1, which in the OA environment is cleaved into cartilage degradation-promoting fragments, reduces cartilage degeneration and progression of OA. Transparent symbols depict transcriptomics results, colored symbols in vitro assay-confirmed data.

Comment in

References

    1. Hunter DJ, March L, Chew M. Osteoarthritis in 2020 and beyond: a Lancet commission. Lancet. 2020;396:1711–1712. doi: 10.1016/S0140-6736(20)32230-3. - DOI - PubMed
    1. Long H, et al. Prevalence trends of site-specific osteoarthritis from 1990 to 2019: findings from the Global Burden of Disease Study 2019. Arthritis Rheumatol. 2022;74:1172–1183. doi: 10.1002/art.42089. - DOI - PMC - PubMed
    1. Karsdal MA, et al. Disease-modifying treatments for osteoarthritis (DMOADs) of the knee and hip: lessons learned from failures and opportunities for the future. Osteoarthr. Cartil. 2016;24:2013–2021. doi: 10.1016/j.joca.2016.07.017. - DOI - PubMed
    1. McAlindon TE, et al. OARSI guidelines for the non-surgical management of knee osteoarthritis. Osteoarthr. Cartil. 2014;22:363–388. doi: 10.1016/j.joca.2014.01.003. - DOI - PubMed
    1. Katz JN, Earp BE, Gomoll AH. Surgical management of osteoarthritis. Arthritis Care Res. (Hoboken) 2010;62:1220–1228. doi: 10.1002/acr.20231. - DOI - PMC - PubMed

Publication types

Associated data