Observational Study
. 2022 Dec 1;15(1):125.
doi: 10.1186/s13048-022-01063-4.

Differences between complex epithelial neoplasms of the ovary and high-grade serous ovarian cancer: a retrospective observational cohort study

Affiliations
Observational Study

Differences between complex epithelial neoplasms of the ovary and high-grade serous ovarian cancer: a retrospective observational cohort study

Xiaoxue Li et al. J Ovarian Res. .

Abstract

Background: Complex epithelial neoplasms of the ovary (CENO), an uncommon pathological histotype in ovarian cancer, comprises adenosquamous carcinoma and adenocarcinoma with metaplasia. Owing to the rarity of relevant reports, there are currently no statistics on outcomes based on large samples. Meanwhile high-grade serous ovarian cancer (HGSOC) is the most common histotype in ovarian cancer which has a recognized first-line treatment regimen and poor prognosis. Thus, we aimed to determine the characteristics, prognosis, and independent predictors of survival for CENO, compare them with those of HGSOC and construct prognostic predictive models and nomograms.

Methods: We used the Surveillance, Epidemiology, and End Results (SEER) database to determine patients diagnosed with CENO or HGSOC from 2000 to 2017. Clinical, demographic, and treatment characteristics were compared between these groups. Propensity score matching, Cox risk regression analysis, Kaplan-Meier survival curves, and the Least Absolute Shrinkage and Selection Operator regression analysis were employed for analyzing the data.

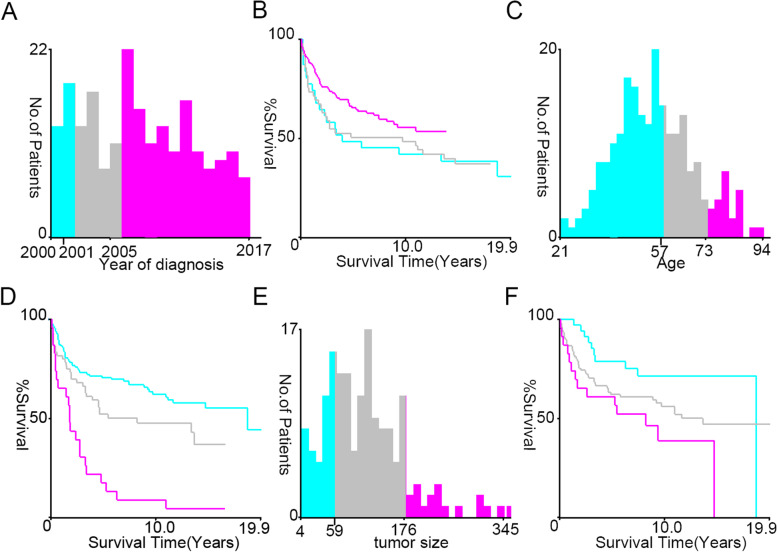
Results: Here, 31,567 patients with HGSOC and 216 patients with CENO between 2000 and 2017 in the SEER database were enrolled. Age < 57 years, unmarried, and early-stage diseases were more common in patients with CENO than in those with HGSOC. Women with CENO were less likely to receive adjuvant chemotherapy (65.7% vs. 79.4%) but more likely to receive radiotherapy (6.0% vs. 0.8%; both p < 0.001) than those with HGSOC. Year of diagnosis, surgery status, number of primary tumors, grade, and FIGO stage were independent prognostic factors for overall and cancer-specific survival in CENO. Overall survival rates were significantly lower for CENO than for more malignant HGSOC.

Conclusions: In summary, CENO was rare in ovarian cancer, while the year of diagnosis, surgery status, number of primary tumors, grade, and FIGO stage were independent prognostic factors. Compared with other common malignant ovarian tumors, CENO had a poor prognosis. Prognostic predictive models and nomograms had been determined to predict the individual survival rates of patients with CENO. These methods could improve evaluations of survival and therapeutic decisions for patients.

Keywords: Adenocarcinoma with metaplasia; Adenosquamous carcinoma; Cancer-specific survival; Complex epithelial neoplasms of the ovary; High-grade serous ovarian cancer; Overall survival; Propensity score matching; SEER database.


Conflict of interest statement

The authors declare that they have no competing interests.

Figures

Fig. 1
Fig. 1
Schematic illustration of the study workflow
Fig. 2
Fig. 2
Identification of optimal cut-off values for the various clinical characteristics using X-tile software analysis. Year of diagnosis: (a) best cut-off value for the year of diagnosis and (b) survival curves for different years of diagnosis. Age: (c) best cut-off value for age and (d) survival curves for different ages. Tumor size: (e) best cut-off value for tumor size and (f) survival curves for different tumor sizes. Based on overall survival, the optimal minimum and maximum cut-off values for the year of diagnosis are 2001 and 2005, respectively, while those for age at diagnosis and tumor sizes are 57 and 73 years and 59 and 176 mm, respectively
Fig. 3
Fig. 3
Survival outcomes before and after propensity score matching. a Overall survival and (b) cancer-specific survival based on patients with HGSOC or CENO before propensity score matching. Log-rank tests are used to generate the p-values. c Overall survival and (d) cancer-specific survival based on patients with HGSOC or CENO after propensity score matching. The Gehan-Breslow tests are used to generate the p-values. HGSOC, high-grade serous ovarian cancer; CENO, complex epithelial neoplasms of the ovary
Fig. 4
Fig. 4
Construction and evaluation of overall survival-associated predictive models. a LASSO coefficient profiles and (b) LASSO deviance profiles depicting the optimal λ value and risk factors. c Kaplan–Meier survival curves of overall survival according to the risk scores; prognosis of the low-risk group is significantly better than that of the high-risk score group. d Receiver operating characteristic curves of overall survival at 1–10 years according to the risk scores in the predictive model data sets. LASSO, Least Absolute Shrinkage and Selection Operator
Fig. 5
Fig. 5
Construction and evaluation of cancer-specific survival-associated predictive models. a LASSO coefficient profiles and (b) LASSO deviance profiles depicting the optimal λ value and risk factors. c Kaplan–Meier survival curves of cancer-specific survival according to the risk scores; prognosis of the low-risk group is significantly better than that of the high-risk score group. d Receiver operating characteristic curves of cancer-specific survival at 1–10 years according to the risk scores in the predictive model data sets. LASSO, Least Absolute Shrinkage and Selection Operator.
Fig. 6
Fig. 6
Nomogram of overall survival-associated predictive models. The larger the red dot, the greater the corresponding distribution frequency. The sum of the scores represented by the grey arrows represents the survival probability corresponding to 1, 3, and 5 years
Fig. 7
Fig. 7
Nomogram of cancer-specific survival-associated predictive models. The larger the red dot, the greater the corresponding distribution frequency. The sum of the scores represented by the grey arrows represents the survival probability corresponding to 1, 3, and 5 years

Similar articles

Cited by

References

    1. Sung H, Ferlay J, Siegel RL, Laversanne M, Soerjomataram I, Jemal A, Bray F. Global Cancer Statistics 2020: GLOBOCAN Estimates of Incidence and Mortality Worldwide for 36 Cancers in 185 Countries. CA Cancer J Clin. 2021;71(3):209–249. doi: 10.3322/caac.21660. - DOI - PubMed
    1. Torre LA, Trabert B, DeSantis CE, Miller KD, Samimi G, Runowicz CD, Gaudet MM, Jemal A, Siegel RL. Ovarian cancer statistics, 2018. CA Cancer J Clin. 2018;68(4):284–296. doi: 10.3322/caac.21456. - DOI - PMC - PubMed
    1. Ordulu Z, Watkins J, Ritterhouse LL. Molecular Pathology of Ovarian Epithelial Neoplasms: Predictive, Prognostic, and Emerging Biomarkers. Surg Pathol Clin. 2021;14(3):415–428. doi: 10.1016/j.path.2021.05.006. - DOI - PubMed
    1. Meinhold-Heerlein I, Fotopoulou C, Harter P, Kurzeder C, Mustea A, Wimberger P, Hauptmann S, Sehouli J. The new WHO classification of ovarian, fallopian tube, and primary peritoneal cancer and its clinical implications. Arch Gynecol Obstet. 2016;293(4):695–700. doi: 10.1007/s00404-016-4035-8. - DOI - PubMed
    1. Lisio MA, Fu L, Goyeneche A, Gao ZH, Telleria C. High-Grade Serous Ovarian Cancer: Basic Sciences, Clinical and Therapeutic Standpoints. Int J Mol Sci. 2019;20(4). - PMC - PubMed

Publication types