

Perfusion imaging heterogeneity during NO inhalation distinguishes pulmonary arterial hypertension (PAH) from healthy subjects and has potential as an imaging biomarker
- PMID: 36457013
- PMCID: PMC9714016
- DOI: 10.1186/s12931-022-02239-8
Perfusion imaging heterogeneity during NO inhalation distinguishes pulmonary arterial hypertension (PAH) from healthy subjects and has potential as an imaging biomarker
Abstract
Background: Without aggressive treatment, pulmonary arterial hypertension (PAH) has a 5-year mortality of approximately 40%. A patient's response to vasodilators at diagnosis impacts the therapeutic options and prognosis. We hypothesized that analyzing perfusion images acquired before and during vasodilation could identify characteristic differences between PAH and control subjects.
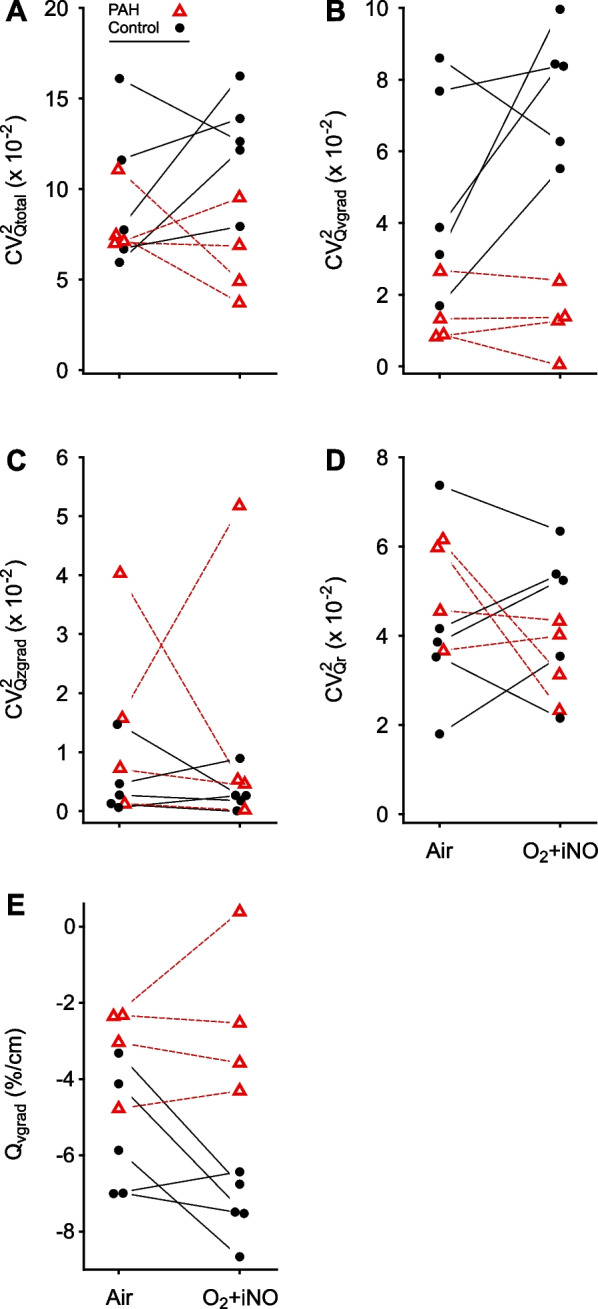
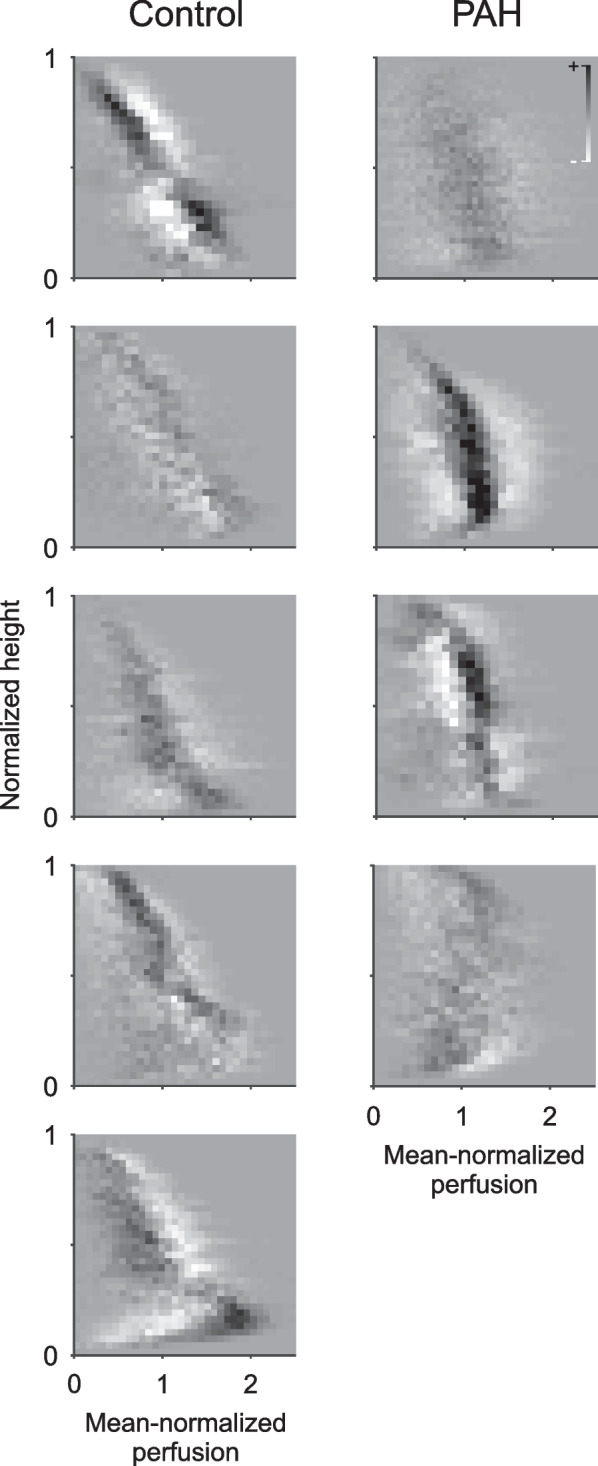
Methods: We studied 5 controls and 4 subjects with PAH using HRCT and 13NN PET imaging of pulmonary perfusion and ventilation. The total spatial heterogeneity of perfusion (CV2Qtotal) and its components in the vertical (CV2Qvgrad) and cranio-caudal (CV2Qzgrad) directions, and the residual heterogeneity (CV2Qr), were assessed at baseline and while breathing oxygen and nitric oxide (O2 + iNO). The length scale spectrum of CV2Qr was determined from 10 to 110 mm, and the response of regional perfusion to O2 + iNO was calculated as the mean of absolute differences. Vertical gradients in perfusion (Qvgrad) were derived from perfusion images, and ventilation-perfusion distributions from images of 13NN washout kinetics.
Results: O2 + iNO significantly enhanced perfusion distribution differences between PAH and controls, allowing differentiation of PAH subjects from controls. During O2 + iNO, CV2Qvgrad was significantly higher in controls than in PAH (0.08 (0.055-0.10) vs. 6.7 × 10⁻³ (2 × 10⁻⁴-0.02), p < 0.001) with a considerable gap between groups. Qvgrad and CV2Qtotal showed smaller differences: - 7.3 vs. - 2.5, p = 0.002, and 0.12 vs. 0.06, p = 0.01. CV2Qvgrad had the largest effect size among the primary parameters during O2 + iNO. CV2Qr, and its length scale spectrum were similar in PAH and controls. Ventilation-perfusion distributions showed a trend towards a difference between PAH and controls at baseline, but it was not statistically significant.
Conclusions: Perfusion imaging during O2 + iNO showed a significant difference in the heterogeneity associated with the vertical gradient in perfusion, distinguishing in this small cohort study PAH subjects from controls.
Keywords: Functional imaging; Inhaled nitric oxide; Perfusion distribution; Positron emission tomography; Pulmonary circulation; Vascular physiology; Ventilation.
© 2022. The Author(s).
Conflict of interest statement
The authors declare that they have no competing interests. For full disclosure, ASW has been consulting for United Therapeutics in the past on topics unrelated to this study, and RC has or had consultant, research, or speaker relationships with United Therapeutics, Janssen, Bayer, Gossamer, Altavant, Third Pole, and Aria CV.
Figures


Similar articles
-
PET Imaging Reveals Early Pulmonary Perfusion Abnormalities in HIV Infection Similar to Smoking.J Nucl Med. 2021 Mar;62(3):405-411. doi: 10.2967/jnumed.120.245977. Epub 2020 Aug 6. J Nucl Med. 2021. PMID: 32764123 Free PMC article.
-
Abnormal pulmonary perfusion heterogeneity in patients with Fontan circulation and pulmonary arterial hypertension.J Physiol. 2021 Jan;599(1):343-356. doi: 10.1113/JP280348. Epub 2020 Oct 27. J Physiol. 2021. PMID: 33026102 Free PMC article.
-
The spatial-temporal dynamics of pulmonary blood flow are altered in pulmonary arterial hypertension.J Appl Physiol (1985). 2023 Apr 1;134(4):969-979. doi: 10.1152/japplphysiol.00463.2022. Epub 2023 Mar 2. J Appl Physiol (1985). 2023. PMID: 36861672 Free PMC article.
-
Vascular endothelial injury assessed with functional techniques in systemic sclerosis patients with pulmonary arterial hypertension versus systemic sclerosis patients without pulmonary arterial hypertension: a systematic review and meta-analysis.Rheumatol Int. 2021 Jun;41(6):1045-1053. doi: 10.1007/s00296-021-04850-2. Epub 2021 Apr 8. Rheumatol Int. 2021. PMID: 33830321
-
Inhaled Therapies for Pulmonary Hypertension.Respir Care. 2015 Jun;60(6):794-802; discussion 802-5. doi: 10.4187/respcare.03927. Respir Care. 2015. PMID: 26070575 Review.
Cited by
-
Lung functional imaging.Breathe (Sheff). 2023 Sep;19(3):220272. doi: 10.1183/20734735.0272-2022. Epub 2023 Nov 14. Breathe (Sheff). 2023. PMID: 38020338 Free PMC article.
-
Using 13N2 and PET to track in vivo nitrogen gas kinetics during normobaric conditions.Front Physiol. 2025 Apr 1;16:1556478. doi: 10.3389/fphys.2025.1556478. eCollection 2025. Front Physiol. 2025. PMID: 40236826 Free PMC article.
References
-
- Halliday SJ, Hemnes AR, Robbins IM, Pugh ME, Zhao DX, Piana RN, et al. Prognostic value of acute vasodilator response in pulmonary arterial hypertension: beyond the “classic” responders. J Heart Lung Transplant Off Publ Int Soc Heart Transplant. 2015;34:312–318. doi: 10.1016/j.healun.2014.10.003. - DOI - PMC - PubMed
-
- Galiè N, Humbert M, Vachiery J-L, Gibbs S, Lang I, Torbicki A, et al. 2015 ESC/ERS Guidelines for the diagnosis and treatment of pulmonary hypertension: The Joint Task Force for the Diagnosis and Treatment of Pulmonary Hypertension of the European Society of Cardiology (ESC) and the European Respiratory Society (ERS): Endorsed by: Association for European Paediatric and Congenital Cardiology (AEPC), International Society for Heart and Lung Transplantation (ISHLT) Eur Respir J. 2015;46:903–975. doi: 10.1183/13993003.01032-2015. - DOI - PubMed
MeSH terms
Substances
LinkOut - more resources
Full Text Sources
Miscellaneous
