. 2022 Dec 1;15(1):171.
doi: 10.1186/s13045-022-01390-5.

Electrostatic anti-CD33-antibody-protamine nanocarriers as platform for a targeted treatment of acute myeloid leukemia

Affiliations

Electrostatic anti-CD33-antibody-protamine nanocarriers as platform for a targeted treatment of acute myeloid leukemia

Nicole Bäumer et al. J Hematol Oncol. .

Abstract

Background: Acute myeloid leukemia (AML) is a fatal clonal hematopoietic malignancy, which results from the accumulation of several genetic aberrations in myeloid progenitor cells, with a worldwide 5-year survival prognosis of about 30%. Therefore, the development of more effective therapeutics with novel mode of action is urgently demanded. One common mutated gene in the AML is the DNA-methyltransferase DNMT3A whose function in the development and maintenance of AML is still unclear. To specifically target "undruggable" oncogenes, we initially invented an RNAi-based targeted therapy option that uses the internalization capacity of a colorectal cancer specific anti-EGFR-antibody bound to cationic protamine and the anionic siRNA. Here, we present a new experimental platform technology of molecular oncogene targeting in AML.

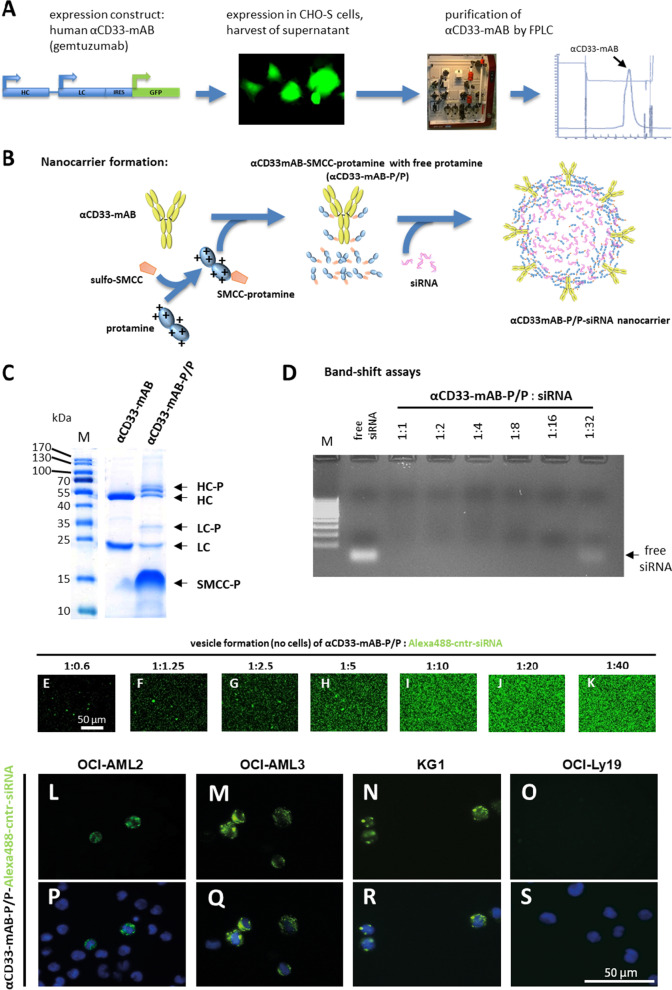
Methods: Our AML-targeting system consists of an internalizing anti-CD33-antibody-protamine conjugate, which together with anionic molecules such as siRNA or ibrutinib-Cy3.5 and cationic free protamine spontaneously assembles into vesicular nanocarriers in aqueous solution. These nanocarriers were analyzed concerning their physical properties and relevant characteristics in vitro in cell lines and in vivo in xenograft tumor models and patient-derived xenograft leukemia models with the aim to prepare them for translation into clinical application.

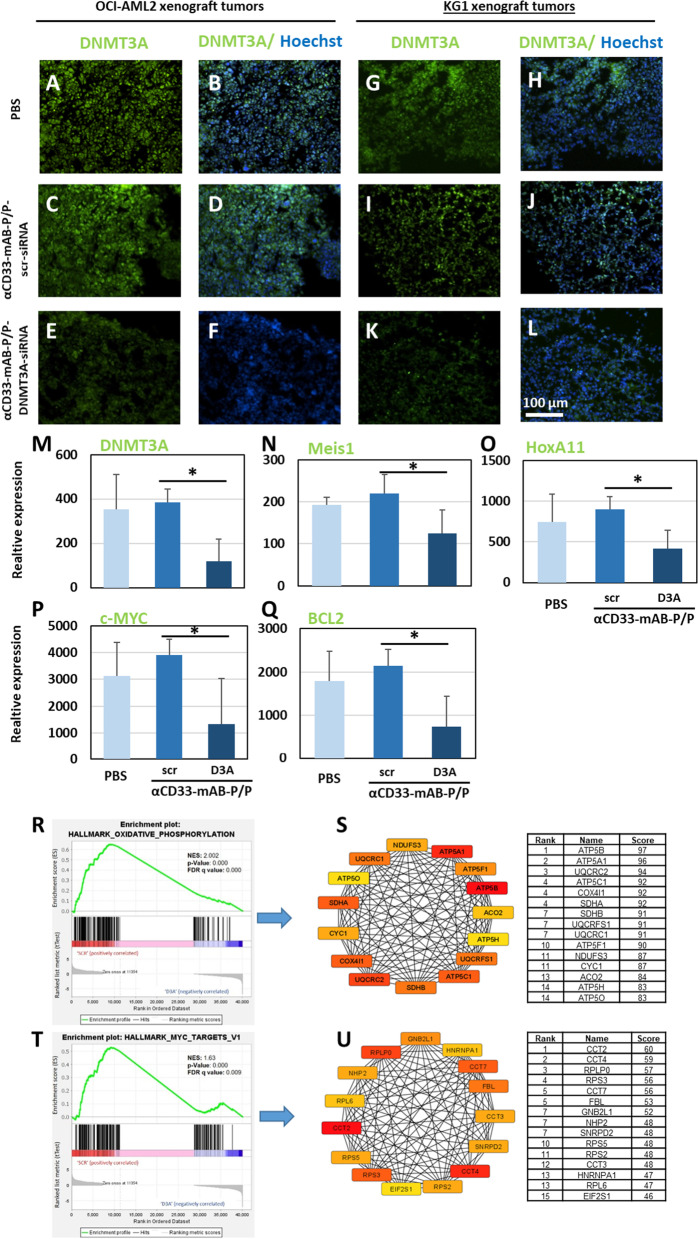
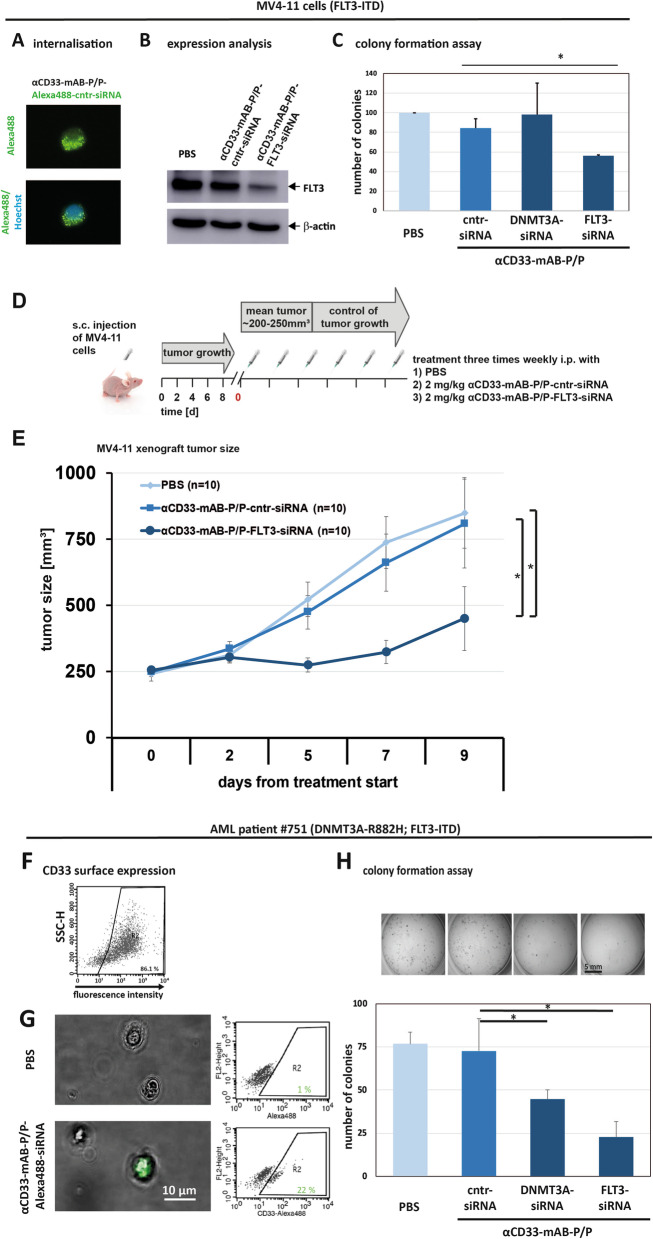
Results: The nanocarriers formed depend on a balanced electrostatic combination of the positively charged cationic protamine-conjugated anti-CD33 antibody, unbound cationic protamine and the anionic cargo. This nanocarrier transports its cargo safely into the AML target cells and has therapeutic activity against AML in vitro and in vivo. siRNAs directed specifically against two common mutated genes in the AML, the DNA-methyltransferase DNMT3A and FLT3-ITD lead to a reduction of clonal growth in vitro in AML cell lines and inhibit tumor growth in vivo in xenotransplanted cell lines. Moreover, oncogene knockdown of DNMT3A leads to increased survival of mice carrying leukemia patient-derived xenografts. Furthermore, an anionic derivative of the approved Bruton's kinase (BTK) inhibitor ibrutinib, ibrutinib-Cy3.5, is also transported by this nanocarrier into AML cells and decreases colony formation.

Conclusions: We report important results toward innovative personalized, targeted treatment options via electrostatic nanocarrier therapy in AML.

Keywords: DNMT3A inhibition; Gemtuzumab; Ibrutinib; Molecular targeted therapy; RNA interference.


Conflict of interest statement

NB, LW, AF, GL, WEB, SB have filed patent applications on electrostatic nanocarrier technology. All other authors disclose no conflict of interest.

Figures

Fig. 1
Fig. 1
The αCD33-monoclonal antibody (mAB) gemtuzumab-protamine (αCD33-mAB-P/P) conjugates bind and transport siRNA only into CD33-positive cells. A We cloned a plasmid expressing the heavy (HC) and light chain (LC) of the full IgG1 monoclonal antibody gemtuzumab. After transfection of the production cell line CHO-S, the mAB was purified via FPLC. Shown here is a representative elution profile (right panel). IRES, internal ribosomal entry side; GFP, green fluorescent protein. B First, protamine was conjugated chemically to the linker sulfo-SMCC, then this linker was coupled to the αCD33-mAB. The naturally anionic siRNA could then complex by electrostatic binding to the protamine moieties. In complex with siRNA, the αCD33-mAB-P and free SMCC-protamine spontaneously form vesicular structures, which we call αCD33-mAB-P/P-siRNA nanocarrier. C Coomassie-stained SDS–PAGE showing uncoupled αCD33-mAB and αCD33-mAB coupled with SMCC-protamine (αCD33-mAB-P/P). The shift of molecular weight after protamine conjugation via sulfo-SMCC to the αCD33-mAB can be seen for the heavy chain (HC-P) and for the light chain (LC-P). SMCC-P, unbound SMCC-protamine; M, molecular weight marker. D Band-shift assay. Agarose gel-electrophoretic analysis of the binding capacity of siRNA to the αCD33-mAB-P/P complex. Up to 16 mol siRNA per mol of mAB-P can bind to the αCD33-mAB-P/P complex. E–K Fluorescence microscopy of nanocarriers. Vesicles were formed by self-assembly upon incubation of 60 nM αCD33-mAB-P/P with 600 nM Alexa488-control-siRNA for 2 h at RT and documented by fluorescence microscopy after immobilization of the nanocarriers on coated slides without cells o/n at 37 °C. L–S Fluorescence microscopy analysis of siRNA internalization mediated by αCD33-mAB-P/P-siRNA complex into CD33-positive cells (L-N and P-R) but not into negative control cells (O and S). Upper panels (L-O): Green fluorescence depicting Alexa488-control siRNA in vesicular structures within the cells. Lower panels (P-S): Overlay of blue Hoechst staining and green fluorescence from upper panels. α, anti
Fig. 2
Fig. 2
αCD33-mAB-P/P-siRNA-mediated RNAi inhibits target gene expression and decreased growth of DNMT3A-mutant AML cells in vitro and in vivo. A Western blot analysis of treated OCI-AML2 cells. B–D Colony formation assay of DNMT3A mutant cell lines OCI-AML2 (B, n = 6) OCI-AML3 (C, n = 6) and DNMT3A-wild type KG1 cells (D, n = 3). There is a significant decrease in colony growth due to αCD33-mAB-P/P-DNMT3A-siRNA treatment in OCI-AML2 and OCI-AML3 (B-C, in contrast to control-siRNA), but not in KG1 (D). Significance: *, p < 0.05, 2-tailed T-test. Means plus SD of three independent experiments. E. Schematic overview about in vivo treatments after subcutaneous (s.c.) injection of 1 × 107 AML cells in CD1-nude mice. Mice were treated intraperitoneally (i.p.) with PBS, αCD33-mAB-P/P-control (cntr)-siRNA or αCD33-mAB-P/P-DNMT3A-siRNA three times weekly. F,G Tumor growth curves of OCI-AML2 (F) and KG1 (G). Growth of OCI-AML2 tumors was significantly delayed due to systemic αCD33-mAB-P/P-DNMT3A-siRNA treatment in contrast to control-siRNA treatment and PBS treatment (G), whereas KG1 tumors (DNMT3A wild type) did not show significant differences in tumor growth (G). H,I Tumor weight of isolated OCI-AML2 (H) and KG1 (I) tumors. Shown are means plus SD: T-test *, p < 0.05. α, anti
Fig. 3
Fig. 3
Expression analysis and downstream factors in xenograft tumor samples. A–L DNMT3A staining of OCI-AML2 and KG1 tumor sections. DNMT3A was detected in nuclei of OCI-AML2 tumor sections treated with PBS and αCD33-mAB-P/P-control-siRNA; scr, scrambled (= control) (A–D), but DNMT3A staining was almost completely lost after treatment with αCD33-mAB-P/P-DNMT3A-siRNA (E–F). Reduced DNMT3A staining was also observed in KG1 tumor sections from the αCD33-mAB-P/P-DNMT3A-siRNA treatment group (K–L compared to G–J). Nuclear counterstain was performed using Hoechst33342 (B, D, F, H, J, L). M–Q Relative expression (RT-PCR) of DNMT3A and downstream genes in OCI-AML2 tumors ex vivo upon previous in vivo exposure to PBS, control carriers (αCD33-mAB-P/P-scr-siRNA) and αCD33-mAB-P/P-DNMT3A-siRNA. D3A, DNMT3A siRNA; α, anti. R,S Gene set enrichment analysis (GSEA) of RNA sequencing data in αCD33-mAB-P/P-DNMT3A-siRNA vs. scr-siRNA carrier-treated OCI-AML2 tumors, ex vivo. GSEA analysis of hallmark gene sets from the molecular signature database identified significant enrichment for hallmark_oxidative phosphorylation (R) and hallmark_c-Myc targets (T) in αCD33-mAB-P/P-scr-siRNA carrier-treated OCI-AML2 tumors. Shown are representative gene set enrichment plots. FDR, false discovery rate q-value and NES, normalized enrichment score. S, U Graphical presentation of central genes within the biological networks identified in the GSEA analysis. Top 15 hub genes identified by String/cytoscape/cytoHubba interface were presented as a circular layout (color coded: red and yellow indicating a higher and lower rank, respectively) using degree based algorithm of cytoHubba plug-in. Rank, gene and the scores were presented in the adjacent table. Furthermore, protein–protein interaction network/subnetworks were analyzed using 12 different algorithms of cytoHubba plug-in and hub genes representing intersection of at least nine algorithms (75% overlapping signature) potentially indicate key DNMT3A related hub genes in inducing c-Myc targets and oxidative phosphorylation. Detailed information on these hub genes and their importance in different cancers and therapy outcome is depicted in Additional file 1: Figure S4
Fig. 4
Fig. 4
Knockdown of FLT3 via αCD33-mAB-P/P-nanocarrier leads to significantly decreased colony and tumor growth of MV4-11 cells and of colony formation of primary AML blasts. A Internalization of αCD33-mAB-P/P-Alexa488-control-siRNA into MV4-11 cells. B Western blot for FLT3 of FLT3-ITD-mutant AML cell line MV4-11. Expression of FLT3 was suppressed upon αCD33-mAB-P/P-FLT3-siRNA treatment in contrast to control-siRNA in MV4-11 with β-actin as control. C Colony formation assay of FLT3-ITD mutated cell lines MV4-11 (n = 3). There is a significant decrease in colony growth due to αCD33-mAB-P/P-FLT3-siRNA treatment in contrast to control (cntr)- or DNMT3A-siRNA carriers, respectively. Means plus SD of three independent experiments. 2-sided T-test: *p < 0.02. D Schematic overview of in vivo i.p. treatment after s.c. injection of 1 × 107 MV4-11 cells in CD1-nude mice. Mice were treated with PBS, αCD33-mAB-P/P-control (cntr)-siRNA or αCD33-mAB-P/P-FLT3-ITD-siRNA three times weekly. E Tumor growth curves of MV4-11 transplants. Growth of MV4-11 tumors was significantly inhibited due to αCD33-mAB-P/P-FLT3-siRNA treatment in contrast to control-siRNA carrier treatment or PBS treatment. F Flow cytometric analysis of CD33-expression on the surface of AML patient #751 (driven by DNMT3A-R882H and FLT3-ITD mutations) cells. G The αCD33-mAB-P/P nanocarrier is able to internalize Alexa488-siRNA into patient blasts. Left: Fluorescence microscopy; right: Quantification via flow cytometry of non-treated (upper panels) and αCD33-mAB-P/P-Alexa488-control-siRNA internalized AML patient cells (lower panels). H Colony formation capacity of primary AML blasts. Cells were pre-incubated with the antibody-siRNA complex, resuspended in methylcellulose and cultivated for 8—12 days. Colonies were stained with INT, counted and photographed. There is a significant decrease in colony growth upon αCD33-mAB-P/DNMT3A-siRNA and αCD33-mAB-P/P-FLT3-siRNA treatment in contrast to control-siRNA carrier. Significance: *p < 0.05, 2-tailed T-test. Means plus SD of 3 independent replicates. α, anti
Fig. 5
Fig. 5
Attributes of effective αCD33-mAB:protamine conjugation ratios. A Concentrations tested and resulting molar ratios of αCD33 antibody (αCD33-mAB) to SMCC-protamine for the effective conjugation of both components. B Coomassie-stained SDS–PAGE showing uncoupled αCD33-mAB compared to the conjugation products that were coupled as depicted in A. The formation of a protamine-conjugated heavy chain (HC-P) and light chain (LC-P) showed an optimum at a 1:32 conjugation ratio with no further increase at higher ratios. C–H Left: Band-shift assays exhibiting siRNA binding capacity. Right: αCD33-mAB-P/P stored at 4 °C for several days shows precipitation at the bottom of the tube only at ratio 1:50 and 1:120 (blue triangles). I-N Internalization of Alexa488-control-siRNA complexed αCD33-mAB-P/P into OCI-AML2 cells. Complexes of αCD33-mAB-P/P transport Alexa488-siRNA into cells (left panel rectangles), with detailed magnifications (right panels). At conjugation ratios of 1:1–1:10 (I-K) only diffuse greenish background can be detected. O-T Left: Colony formation assays of the different conjugations in OCI-AML2 cells. Significance: *, p < 0.05, 2-tailed T-test. Means plus SD of three independent experiments. D3A, DNMT3A siRNA. S-P, SMCC-protamine. Right: αCD33-mAB-P/P-Alexa488-siRNA complexes form vesicles with different size and efficacy in presence of rising amounts of free SMCC-protamine. No vesicle formation at ratios of 1:1–10 (right: O-Q), apart from some unspecific aggregates (right side in P). α, anti
Fig. 6
Fig. 6
The αCD33-mAB-P/P nanocarriers only transport siRNA in presence of free SMCC-protamine (SMCC-P). A Coomassie-stained SDS–PAGE showing αCD33-mAB, αCD33-mAB coupled with SMCC-P and HPLC-fractions 29–30 of αCD33-mAB-P/P upon effective depletion of unbound SMCC-P; HC = heavy chain, LC = light chain, -P = SMCC-protamine. B Antibody–protamine conjugates with fluorescent Alexa488-siRNA in cell-free incubation overnight on chamber slides. αCD33-mAB-P/P with free SMCC-P forms visible vesicular structures (left panel), while αCD33-mAB-P after depletion of free SMCC-P (fraction 30, see A) do not form visible structures (right panel). C. DLS and zeta-potential measurement of αCD33-mAB-P/free protamine-scr-siRNA carriers. D. αCD33-mAB-P/P-scr-siRNA nanoparticles were left to form for 2 h and subjected to electron microscopy on copper grids by phosphotungstate negative staining. E–H. Immunostaining of nanocarriers with an anti-human IgG antibody to illustrate the accessibility and location of the αCD33-mAB in the outside rim and the siRNA in the lumen of the αCD33-mAB-P/P-nanocarriers. I. Protamine was chemically coupled to Cy3 and then incubated with αCD33-mAB-P that was depleted from free protamine and with non-fluorescent control-siRNA to form nanocarriers. This complexation was performed for 2 h at RT and nanocarriers were then immobilized o/n on slides for immunostaining as in G. J. αCD33-mAB-P/P-Cy3-control-siRNA show homogeneous Cy3 (blue) micelles. K. The same vesicles as in L show anti-human IgG-Alexa647 (red) fluorescence in ring-like structure around each vesicle (staining as depicted in E). L. Overlay of panels J and K. α, anti
Fig. 7
Fig. 7
Knockdown of DNMT3A in a PDX-AML model leads to significantly increased survival. A Schematic overview about in vivo treatments after i.v. injection of 1 × 107 blasts of DNMT3A-mut/FLT3-ITD-mut patient #751 AML into NSG mice. Mice were treated by i.p. injection with PBS, 4 mg/kg αCD33-mAB-P/P-control (scrambled: “scr”)-siRNA, αCD33-mAB-P/P-DNMT3A-siRNA or 4 mg/kg αCD33-mAB-P/P-FLT3-siRNA three times weekly (n = 5 in each group). B Kaplan–Meier survival curves: Treatment with αCD33-mAB-P/P-DNMT3A-siRNA led to survival benefit for all mice within this setting, αCD33-mAB-P/P-FLT3-siRNA showed a trend. C αCD33-mAB-P/P-DNMT3A treatment significantly reduces hCD45-positive circulating leukmia cells in mouse blood. Day 12 was chosen, because control mice were still alive. FLT3-siRNA treated mice showed the same trend. D-U In the same PDX model, engrafted animals were treated with αCD33-mAB-P/P-DNMT3A nanocarriers with Cy5-labeled siRNA (lower row) or non-labeled (upper row) as well as PBS control (middle row). D, E, F. Bright field photographs of Cy5-FRI in G, H, I Mice treated with αCD33-mAB-P/P-nanocarriers loaded with Cy5-labeled siRNA showed Cy5 signals in human leukemia engrafted bone marrow (I, L) as well as excretion by kidney (I), while no or very weak signals were detected in non-labeled siRNA treated (G) and PBS controls (H). M-U Organ sections immunostained for human IgG showed distinct signals in αCD33-mAB-P/P -nanocarrier-treated, but not control mice in bone marrow (αCD33-mAB signal) and kidney (excretion), but not in irrelevant organs such as heart. α, anti; D3A, DNMT3A; FRI, Fluorescence reflectance imaging
Fig. 8
Fig. 8
Cellular targeting of Bruton’s kinase (BTK) by αCD33-mAB-P/P-ibrutinib-Cy3.5 and inhibition of clonal growth of treated AML-cells. A Schematic overview: spontaneous assembly of the αCD33-mAB-P/P-ibrutinib-Cy3.5 nanocarrier. B The αCD33-mAB-P/P conjugate was incubated for 2 h with anionic ibrutinib-Cy3.5 (left panels) or uncharged ibrutinib (trademark: imbruvica™; right panels) in 1:20 ratio and applied to cell-culture treated glass slides for fluorescence microscopy. Only αCD33-mAB-P/P-ibrutinib-Cy3.5 complexes led to the formation of numerous vesicles, where the larger vesicles showed intense Cy3.5 fluorescence (upper left panel) and vesicle formation in phase contrast (PC, lower left panel). No nanocarrier formation in presence of uncharged ibrutinib (upper and lower right panels, bubbles in lower right panel are mounting air inclusion artifacts). C Electromobility shift assays showing the electrostatic loading capacity of ibrutinib-Cy3.5 to conjugates from A in a molar ratio. One mol of αCD33-mAB-P/P can bind at least 20–50 mol ibrutinib-Cy3.5. D CD33-positive OCI-AML2 cells were treated by the respective conjugates shown for 72 h, lysed and subjected to SDS–PAGE and Western blotting for phospho-BTK (pBTK), total BTK (tBTK) and actin as a loading control. Both, free ibrutinib-Cy3.5 and αCD33-mAB-P/P-ibrutinib-Cy3.5 complexes inhibited the phosphorylation of BTK. E-M Fluorescence microscopy of OCI-AML2 cells treated with targeting conjugates and controls showing a marked intracellular enrichment of Cy3.5-signals (I). Fluorescence microscopy of OCI-AML2 cells pre-treated with ibrutinib-bodipy (green, G and M) do not show intracellular enrichment of Cy3.5-signals after αCD33-mAB-P/P-ibrutinib-Cy3.5 treatment (J compared to G). N Upper panels: Photographs of representative colony formation assays as summarized in the lower panel. In colony formation assays, 1200 nM untargeted ibrutinib-Cy3.5 did not reduce colony growth of OCI-AML2 cells, while the specifically targeted αCD33-mAB-P/P-ibrutinib-Cy3.5 (60 nM nanocarrier: 1200 nM ibrutinib-Cy3.5) reduced the colony growth to below 30% of the PBS controls, more than the treatment with 1200 nM uncharged ibrutinib (right-most bar). Significance: *, p < 0.05, 2-tailed T-test. Means plus SD of 3 independent experiments. α, anti

References

    1. Torre LA, Bray F, Siegel RL, Ferlay J, Lortet-Tieulent J, Jemal A. Global cancer statistics, 2012. CA Cancer J Clin. 2015;65:87–108. doi: 10.3322/caac.21262. - DOI - PubMed
    1. de Kouchkovsky I, Abdul-Hay M. Acute myeloid leukemia: a comprehensive review and 2016 update. Blood Cancer J. 2016;6:e441. doi: 10.1038/bcj.2016.50. - DOI - PMC - PubMed
    1. Bäumer N, Appel N, Terheyden L, Buchholz F, Rossig C, Müller-Tidow C, et al. Antibody-coupled siRNA as an efficient method for in vivo mRNA knockdown. Nat Protoc. 2016;11:22–36. doi: 10.1038/nprot.2015.137. - DOI - PubMed
    1. Bäumer N, Rehkämper J, Appel N, Terheyden L, Hartmann W, Wardelmann E, et al. Downregulation of PIK3CA via antibody-esiRNA-complexes suppresses human xenograft tumor growth. PLoS ONE. 2018;13:e0200163. doi: 10.1371/journal.pone.0200163. - DOI - PMC - PubMed
    1. Bäumer S, Bäumer N, Appel N, Terheyden L, Fremerey J, Schelhaas S, et al. Antibody-mediated delivery of anti-KRAS-siRNA in vivo overcomes therapy resistance in colon cancer. Clin Cancer Res. 2015;21:1383–1394. doi: 10.1158/1078-0432.CCR-13-2017. - DOI - PubMed

Publication types