. 2022 Dec 1;10(1):21.
doi: 10.1186/s40170-022-00296-7.

Isotope tracing reveals distinct substrate preference in murine melanoma subtypes with differing anti-tumor immunity

Affiliations

Isotope tracing reveals distinct substrate preference in murine melanoma subtypes with differing anti-tumor immunity

Xinyi Zhang et al. Cancer Metab. .

Abstract

Background: Research about tumor "metabolic flexibility"-the ability of cells to toggle between preferred nutrients depending on the metabolic context-has largely focused on obesity-associated cancers. However, increasing evidence for a key role for nutrient competition in the tumor microenvironment, as well as for substrate regulation of immune function, suggests that substrate metabolism deserves reconsideration in immunogenic tumors that are not strongly associated with obesity.

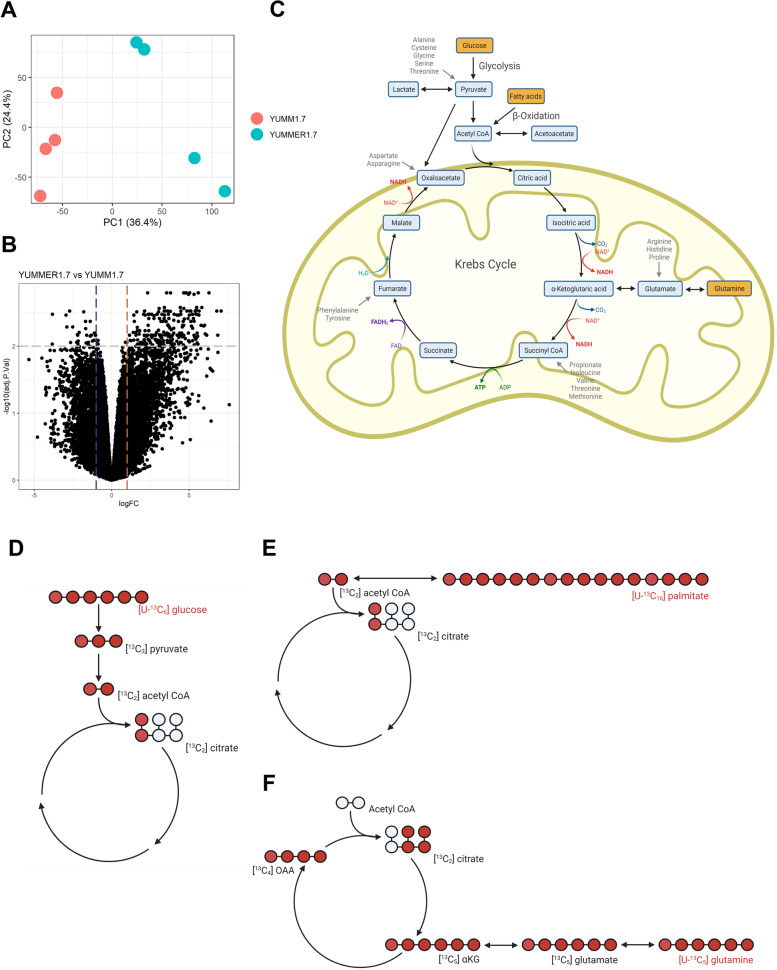
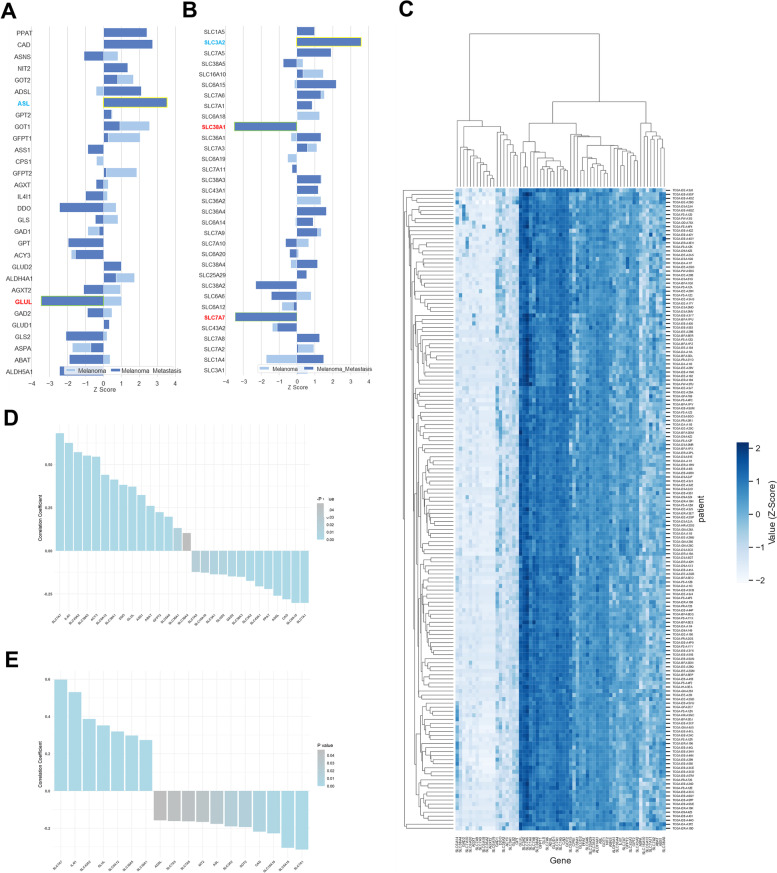
Methods: We compare two murine models: immunologically cold YUMM1.7 and immunologically-hot YUMMER1.7. We utilize stable isotope and radioisotope tracer-based metabolic flux studies as well as gas and liquid chromatography-based metabolomics analyses to comprehensively probe substrate preference in YUMM1.7 and YUMMER1.7 cells, with a subset of studies on the impact of available metabolites across a panel of five additional melanoma cell lines. We analyze bulk RNA-seq data and identify increased expression of amino acid and glucose metabolism genes in YUMMER1.7. Finally, we analyze melanoma patient RNA-seq data to identify potential prognostic predictors rooted in metabolism.

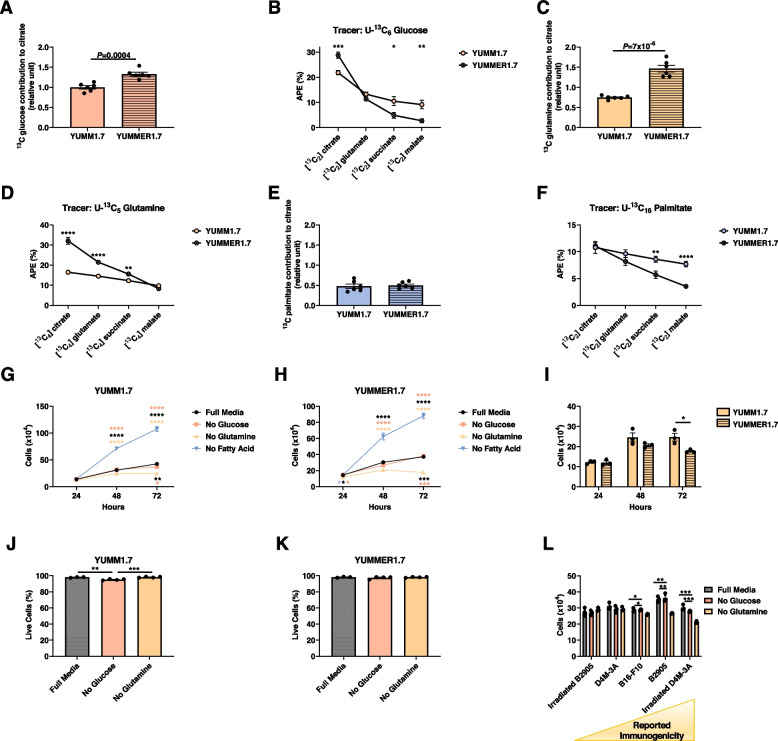
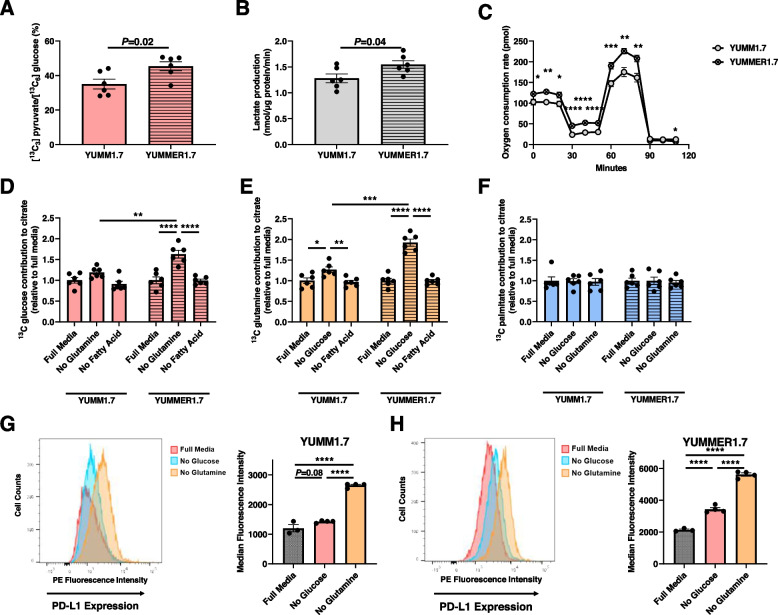
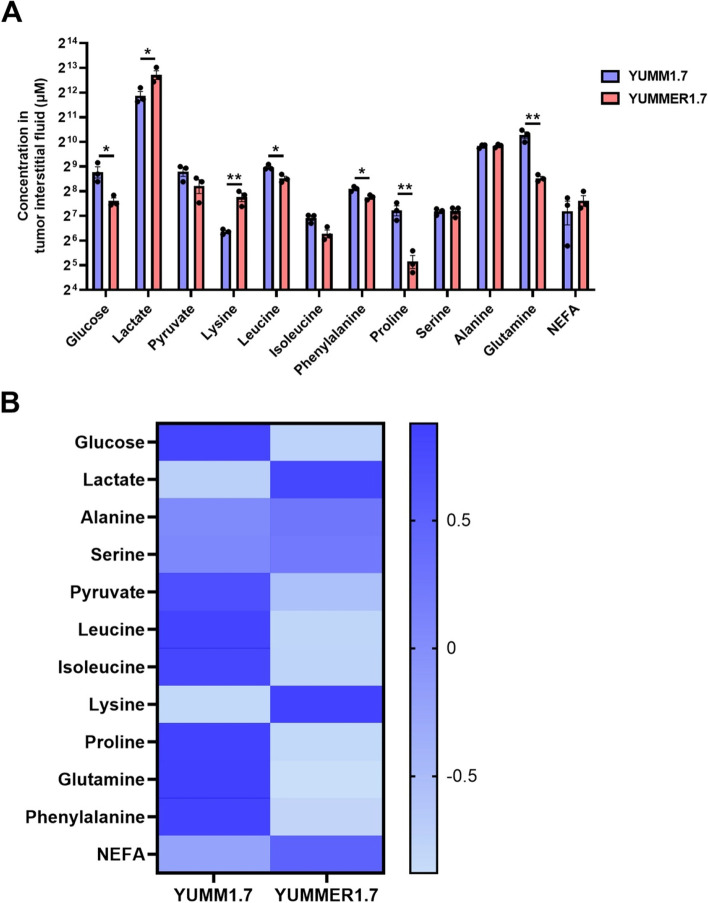
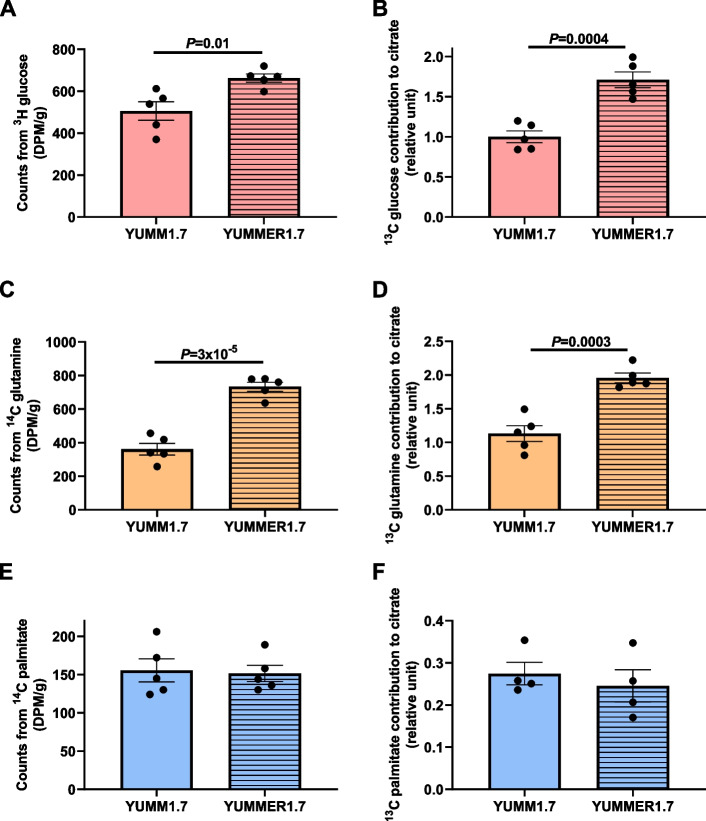
Results: We demonstrate using stable isotope tracer-based metabolic flux studies as well as gas and liquid chromatography-based metabolomics that immunologically-hot melanoma utilizes more glutamine than immunologically-cold melanoma in vivo and in vitro. Analyses of human melanoma RNA-seq data demonstrate that glutamine transporter and other anaplerotic gene expression positively correlates with lymphocyte infiltration and function.

Conclusions: Here, we highlight the importance of understanding metabolism in non-obesity-associated cancers, such as melanoma. This work advances the understanding of the correlation between metabolism and immunogenicity in the tumor microenvironment and provides evidence supporting metabolic gene expression as potential prognostic factors of melanoma progression and may inform investigations of adjunctive metabolic therapy in melanoma.

Trial registration: Deidentified data from The Cancer Genome Atlas were analyzed.

Keywords: Amino acid; Glucose; Melanoma; Tumor metabolism; Tumor microenvironment.


Conflict of interest statement

The authors declare that they have no competing interests.

Figures

Fig. 1
Fig. 1
RNA sequencing and isotope tracers were used to study metabolic pathways. A Principal component analysis (PCA) of bulk RNA-seq in YUMM1.7 and YUMMER1.7 cell lines. B Volcano plot of differentially expressed gene comparing YUMMER1.7 and YUMM1.7 cell bulk RNA-seq, Log2(fold change)>2, P<0.01 define the dotted line cutoffs. C Schematic depicting mitochondrial metabolism. Metabolites traced in this study are shown in yellow boxes and anaplerotic substrates in gray text. Figures in panels CF were created with Biorender.com. DF Tracer-labeling scheme reflecting the first turn of the TCA cycle when [U-13C6] glucose, [U-13C16] palmitate, and [U-13C5] glutamine is used as a tracer, respectively
Fig. 2
Fig. 2
YUMMER1.7 cells are more reliant on anaplerotic substrates in vitro than YUMM1.7 cells. A VCS from [U-13C6] glucose. B 13C enrichment of TCA cycle intermediates in cells incubated in [U-13C6] glucose. C Relative VCS in cells incubated in [U-13C16] glutamine, normalized to data from cells incubated in [U-13C] glucose. D 13C enrichment of TCA cycle intermediates in cells incubated in [U-13C6] glutamine. E Relative VCS in cells incubated in [U-13C16] palmitate. F 13C enrichment of TCA cycle intermediates in cells incubated in [U-13C6] glucose. GH YUMM1.7 and YUMMER1.7 cell number under conditions of substrate deprivation in vitro. The color of the asterisks denotes the group to which the group closest to the symbols was compared. I YUMM1.7 and YUMMER1.7 cell number under conditions of glutamine deprivation. J, K Effect of glucose and glutamine deprivation on the fraction live/dead cells, assessed by flow cytometry. L Impact of glucose or glutamine deprivation on cell number in five cell lines with varying immunogenicity. In all panels, *P<0.05, **P<0.01, ***P<0.001, ****P<0.0001. The 2-tailed unpaired Student’s t test was used to compare two groups and ANOVA with Tukey’s multiple comparisons test to compare three or four groups
Fig. 3
Fig. 3
Glutamine and glucose deprivation increase utilization of the other substrate and increase tumor PD-L1 expression. A [13C3] pyruvate/[13C6] glucose in cells incubated in [U-13C6] glucose. B Lactate production by YUMM1.7 and YUMMER1.7 melanoma cells. C Oxygen consumption during a mitochondrial stress test. DF Contribution of 13C glucose, glutamine, and palmitate to citrate in YUMM1.7 and YUMMER1.7 cells. G, H Impact of glucose and glutamine deprivation on YUMM1.7 and YUMMER1.7 PD-L1 expression, measured by flow cytometry. In all panels, comparisons within cell lines were performed by ANOVA with Tukey’s multiple comparisons test, and comparisons between cell lines by the 2-tailed unpaired Student’s t test. *P<0.05, **P<0.01, ****P<0.0001. a.u. arbitrary unit
Fig. 4
Fig. 4
Analysis of tumor interstitial fluid metabolite concentrations ex vivo suggests greater utilization of glucose and amino acids in YUMMER1.7 tumors as compared to YUMM1.7. A Metabolite concentrations. *P<0.05, **P<0.01 by the 2-tailed unpaired Student’s t test. B Heatmap showing mean metabolite concentrations (n=3 per group). The axis legend unit is the Z score, and the data shown in Fig. 5A are utilized to generate this heatmap
Fig. 5.
Fig. 5.
YUMMER1.7 tumors utilize more glucose and glutamine than YUMM1.7 tumors in vivo. A, B Tumor glucose uptake and oxidation. C, D Glutamine uptake and oxidation. E, F Palmitate uptake and oxidation. In all panels, groups were compared by the 2-tailed unpaired Student’s t test
Fig. 6
Fig. 6
Amino acid transporters and metabolic enzymes are associated with beneficial outcomes in melanoma patients. Z scores of survival effect due to mRNA expression of amino acid metabolic enzymes (A) and transporters (B) in melanoma patients from PRECOG database. C Clustering heatmap of amino acid transporter and metabolic enzyme gene expression in 159 melanoma patients from TCGA database. The results shown here are entirely or partly based upon data generated by the TCGA Research Network: https://www.cancer.gov/tcga. D Correlation coefficient (r value) of leukocyte infiltration to amino acid metabolic enzymes and transporter mRNA expression levels in TCGA melanoma patients. P< 0.05. E Correlation coefficient (r value) of cytolytic activity to amino acid metabolic enzymes and transporter expression levels in TCGA melanoma patients. P< 0.05

References

    1. Bolick NL, Geller AC. Epidemiology of melanoma. Hematol Oncol Clin North Am. 2021;35(1):57–72. doi: 10.1016/j.hoc.2020.08.011. - DOI - PubMed
    1. Vander Heiden MG, Cantley LC, Thompson CB. Understanding the Warburg effect: the metabolic requirements of cell proliferation. Science. 2009;324(5930):1029–1033. doi: 10.1126/science.1160809. - DOI - PMC - PubMed
    1. Warburg O. On the origin of cancer cells. Science. 1956;123(3191):309–314. doi: 10.1126/science.123.3191.309. - DOI - PubMed
    1. Warburg O, Wind F, Negelein E. The metabolism of tumors in the body. J Gen Physiol. 1927;8(6):519–530. doi: 10.1085/jgp.8.6.519. - DOI - PMC - PubMed
    1. do Nascimento RS, et al. Sodium dichloroacetate attenuates the growth of B16-F10 melanoma in vitro and in vivo: an opportunity for drug repurposing. Anticancer Drugs. 2021;32(2):111–116. doi: 10.1097/CAD.0000000000001013. - DOI - PubMed

LinkOut - more resources