. 2023 Aug;180(16):2039-2063.
doi: 10.1111/bph.15996. Epub 2023 Jan 31.

Improved PIEZO1 agonism through 4-benzoic acid modification of Yoda1

Affiliations

Improved PIEZO1 agonism through 4-benzoic acid modification of Yoda1

Gregory Parsonage et al. Br J Pharmacol. 2023 Aug.

Abstract

Background and purpose: The protein PIEZO1 forms mechanically activated, calcium-permeable, non-selective cation channels in numerous cell types from several species. Options for pharmacological modulation are limited and so we modified a small-molecule agonist at PIEZO1 channels (Yoda1) to increase the ability to modulate these channels.

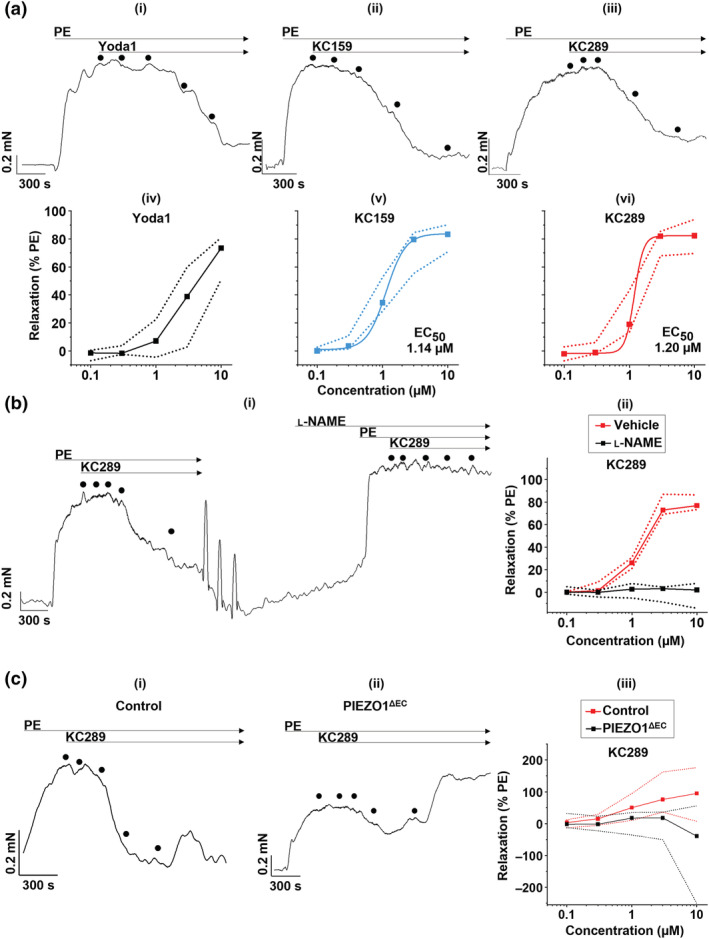
Experimental approach: Medicinal chemistry generated Yoda1 analogues that were tested in intracellular calcium and patch-clamp assays on cultured cells exogenously expressing human or mouse PIEZO1 or mouse PIEZO2. Physicochemical assays and wire myography assays on veins from mice with genetic disruption of PIEZO1.

Key results: A Yoda1 analogue (KC159) containing 4-benzoic acid instead of the pyrazine of Yoda1 and its potassium salt (KC289) have equivalent or improved reliability, efficacy and potency, compared with Yoda1 in functional assays. Tested against overexpressed mouse PIEZO1 in calcium assays, the order of potency (as EC50 values, nM) was KC289, 150 > KC159 280 > Yoda1, 600). These compounds were selective for PIEZO1 over other membrane proteins, and the physicochemical properties were more suited to physiological conditions than those of Yoda1. The vasorelaxant effects were consistent with PIEZO1 agonism. In contrast, substitution with 2-benzoic acid failed to generate a modulator.

Conclusion and implications: 4-Benzoic acid modification of Yoda1 improves PIEZO1 agonist activity at PIEZO1 channels. We suggest naming this new modulator Yoda2. It should be a useful tool compound in physiological assays and facilitate efforts to identify a binding site. Such compounds may have therapeutic potential, for example, in diseases linked genetically to PIEZO1 such as lymphatic dysplasia.

Keywords: calcium channel; endothelial cell; mechanical force; medicinal chemistry; non-selective cation channel; pharmacology; vascular biology.


Conflict of interest statement

Automated patch‐clamp studies were performed at Nanion Technologies GmbH, which has interest in the commercial success of the SyncroPatch 384. Authors at Leeds and Homburg have interest in successful outcomes from research grants and studentships as indicated in the Acknowledgements. No other conflicts of interest are disclosed.

Figures

FIGURE 1
FIGURE 1
Yoda1 analogues and their effects on hPIEZO1. (a) Structures of Yoda1 and analogues in which the pyrazine moiety has been altered. KC157, 2‐benzoic acid; KC158, 3‐benzoic acid; KC159, 4‐benzoic acid; KC161, 4‐benzamide; KC162, 3‐benzamide; KC289, 4‐benzoic acid (potassium salt). (b) Intracellular Ca2+ measurements from a single experiment (n = 1) in which hPIEZO1‐TREx cells were acutely exposed to (i) DMSO vehicle or 10 μM (ii) Yoda1, (iii) KC157, (iv) KC158, (v) KC159, (vi) KC161, (vii) KC162 and (viii) KC289. Arrows indicate the time at which the indicated compound was added to the cells, following a 30 s background read. Mean (± SEM) values from three technical replicates are shown. (c) Paired, background‐subtracted (change above background, Δ), peak intracellular Ca2+ measurement comparisons of hPIEZO1‐TREx cells treated with 10 μM indicated compound. Each plot shows mean peak values from independent experiments (KC157, n = 7; KC158, n = 6; KC159, n = 25; KC161, n = 6; KC162, n = 12; and KC289, n = 18) and comparisons of the median values of the collated experiments are shown. * P < 0.05, significantly different as indicated; paired‐sample Wilcoxon signed‐rank test. Median fold differences compared to Yoda1 are also indicated. (d) Background‐subtracted (Δ) peak intracellular Ca2+ measurements for hPIEZO1‐TREx cells treated with 10 μM indicated compound. Each symbol shows a mean peak value from an independent experiment (Yoda1, n = 67; KC159, n = 30; and KC289, n = 18) and the median values of each treatment pair are shown. * P < 0.05, significantly different as indicated; Kruskal–Wallis ANOVA.
FIGURE 2
FIGURE 2
4‐Benzoic acid improves concentration–response data for human PIEZO1. (a) Background‐subtracted (Δ) intracellular Ca2+ measurements from a single experiment (n = 1) in which hPIEZO1‐TREx cells were exposed to the indicated concentrations of (i) Yoda1, (ii) KC159 and (iii) KC289. Mean (± SEM) values from three technical replicates are shown. (b) Background‐subtracted (Δ) peak intracellular Ca2+ measurements of hPIEZO1‐TREx cells treated with the indicated concentration range of (i) Yoda1, (ii) KC159 and (iii) KC289. Median peak values and the data range from collated experiments are shown (Yoda1, n = 12; KC159, n = 17; and KC289, n = 7). (c) Background‐subtracted (Δ) intracellular Ca2+ measurements from a single dose–response experiment (n = 1) in which HUVECs were exposed to the indicated concentrations of (i) Yoda1, (ii) KC159 and (iii) KC289. Mean ± SEM values from three technical replicates are shown. (d) Background‐subtracted (Δ) peak intracellular Ca2+ measurements of HUVECs treated with the indicated concentration range of (i) Yoda1, (ii) KC159 and (iii) KC289. Median peak values and the data range from collated experiments are shown (Yoda1, n = 9; KC159, n = 9; and KC289, n = 6). Fitted curves constructed using the Hill equation are shown in (ii) and (iii).
FIGURE 3
FIGURE 3
4‐Benzoic acid improves efficacy at mouse PIEZO1. (a) Intracellular Ca2+ measurements from a single experiment in which mPIEZO1‐TREx cells were acutely exposed to (i) DMSO vehicle or 10 μM (ii) Yoda1, (iii) KC157, (iv) KC158, (v) KC159, (vi) KC161, (vii) KC162 and (viii) KC289. Arrows indicate the time at which the indicated compound was added to the cells, following a 30 s background read. Mean (± SEM) values from five technical replicates are shown. (b) Paired, background‐subtracted (Δ), peak intracellular Ca2+ measurement comparisons of mPIEZO1‐TREx cells treated with 10 μM indicated compound. Each plot shows mean peak values from independent experiments (KC157, n = 15; KC158, n = 6; KC159, n = 15; KC161, n = 6; KC162, n = 15; and KC289, n = 15). Comparisons of the median values of the collated experiments are shown. * P < 0.05, significantly different as indicated; paired‐sample Wilcoxon signed‐rank test. Median fold differences compared to Yoda1 are also indicated.
FIGURE 4
FIGURE 4
4‐Benzoic acid improves potency at mouse PIEZO1. (a) Intracellular Ca2+ measurements from a single experiment (n = 1) in which mPIEZO1‐TREx cells were exposed to the indicated concentrations of (i) Yoda1, (ii) KC159 and (iii) KC289. Mean ± SEM values from four technical replicates are shown. (b) Background‐subtracted (Δ) peak intracellular Ca2+ measurements of mPIEZO1‐TREx cells treated with the indicated concentration range of (i) Yoda1, (ii) KC159 and (iii) KC289. Median peak values and the data range from collated experiments are shown (n = 12 for all compounds). (c) Median peak values for each compound were used to construct fitted curves from the Hill equation, and the respective EC50 values are indicated.
FIGURE 5
FIGURE 5
PIEZO1 agonist activity confirmed by manual patch clamp. (a) (i) Ramp voltage protocol used for cell stimulation. Dashed gridlines show time points where the ramp starts (−100 mV), reverses (0 mV) and ends (+100 mV). They also match the lines in (ii) and (iii), which show representative (n = 1) whole‐cell currents activated in mPIEZO1‐TREx channels by 10 μM (ii) Yoda1 or (iii) KC159. The circled numbers indicate currents at the following stages of the experiment: ① control, ② after the start of SBS flow, ③ (maximal) after application of the indicated compound, ④ 100 ms after application of compound and ⑤ after bath solution (SBS) washout of compound. The circled numbers correspond to those shown in all subsequent plots. (b) Time‐resolved plots of representative experiments (n = 1): (i) HEK‐TREx control (null) cell treated with fluid flow and then flow plus 10 μM KC159; (ii) mPIEZO1‐TREx cell treated with flow and then flow plus 10 μM Yoda1; and (iii) mPIEZO1‐TREx cell treated with flow and then flow plus 10 μM KC159. Arrow indicates the start of SBS flow. Circles indicate currents measured at +100 mV of the ramp, and squares indicate those measured at −100 mV. The currents were recorded every 10 s. (c) Collated data for experiments as described in (a) and (b). Current densities (pA·pF−1) measured at +100 mV are shown on the upper Y axis (blue for KC159 and dark grey for Yoda1) and those measured at −100 mV on the lower Y axis (orange for KC159 and light grey for Yoda1). Individual data points of different cells are shown with different colours. Bars indicate the median ± range. (i) HEK‐TREx control cells treated with 10 μM KC159: ① n = 11, ② n = 11 and ③ n = 11. (ii) mPIEZO1‐TREx cells treated with 10 μM Yoda1: ① n = 5, ② n = 5, ③ n = 5, ④ n = 5 and ⑤ n = 5. (iii) mPIEZO1‐TREx cells treated with 10 μM KC159: ① n = 13, ② n = 13, ③ n = 13, ④ n = 13 and ⑤ n = 6
FIGURE 6
FIGURE 6
Improved agonist activity as measured by automated patch clamp. Averaged traces for PIEZO1‐mediated currents activated by mechanical stimulation (M‐Stim) on the SyncroPatch 384 in the absence (black traces) and presence of 10 μM KC159 (blue traces) from (a) hPIEZO1‐TREx (n = 44), (b) mPIEZO1‐TREx (n = 46) and (c) untransfected HEK‐TREx (n = 55). Current densities elicited by M‐Stim in the absence and presence of 10 μM (d) KC157 or (e) KC159 in untransfected HEK‐TREx, hPIEZO1‐TREx and mPIEZO1‐TREx cells. Each square represents the peak current density of a single cell, with median values and ranges indicated in black. Only data for cells defined as responding (see Section 2) are included in the plots. Recordings were made from cells on three different 384‐well recording chips, and the data from these chips are distinguished by red, blue and green colours with the filled triangles indicating the median values for each chip. (d) HEK‐TREx M‐Stim (n = 10), HEK‐TREx M‐Stim + KC157 (n = 10), hPIEZO1‐TREx M‐Stim (n = 12), hPIEZO1‐TREx M‐Stim + KC157 (n = 12), mPIEZO1‐TREx M‐Stim (n = 20) and mPIEZO1‐TREx M‐Stim + KC157 (n = 20). (e) HEK‐TREx M‐Stim (n = 13), HEK‐TREx M‐Stim + KC159 (n = 13), hPIEZO1‐TREx M‐Stim (n = 94), hPIEZO1‐TREx M‐Stim + KC159 (n = 94), mPIEZO1‐TREx M‐Stim (n = 113) and mPIEZO1‐TREx M‐Stim + KC159 (n = 113)
FIGURE 7
FIGURE 7
Automated patch‐clamp comparison with Yoda1. Percentages of (a) hPIEZO1‐TREx and (b) mPIEZO1‐TREx cells responding to activation by 10 μM KC157, 10 μM Yoda1 and 5 μM KC159. Each square represents an independent experiment with mean values indicated by black bars. All groups contained 64 cells per condition tested on the same chip, and the following numbers of valid cells were assessed for responsiveness in each repeat: (a) KC157, n = 40, 40 and 53; Yoda1, n = 37, 50, 51, 46, 39 and 49; and KC159, n = 42, 50 and 41. (b) KC157, n = 48, 55 and 46; Yoda1, n = 42, 48, 56, 48, 43 and 54; and KC159, n = 34, 25 and 43. Because the number of independent 384‐well chips used was less than five in some cases (i.e., three), we did not apply statistical testing to these data. Dose–response data expressed as mean normalised activation ± SEM, obtained from (c) hPIEZO1‐TREx (n = 108) and (d) mPIEZO1‐TREx (n = 134) cells exposed to increasing concentrations (0.3, 1, 3 and 10 μM) of Yoda1. hPIEZO1 0.3 μM (n = 27), 1 μM (n = 25), 3 μM (n = 28) and 10 μM (n = 28); mPIEZO1 0.3 μM (n = 34), 1 μM (n = 34), 3 μM (n = 34) and 10 μM (n = 32). The peak current in the presence of the agonist was normalised to the peak current in the presence of reference only. Dose–response data expressed as mean normalised activation ± SEM, obtained from (e) hPIEZO1‐TREx (n = 316) and (f) mPIEZO1‐TREx (n = 250) cells exposed to increasing concentrations (0.3, 1, 3 and 10 μM) of KC159. hPIEZO1 0.3 μM (n = 79), 1 μM (n = 86), 3 μM (n = 73) and 10 μM (n = 78); mPIEZO1 0.3 μM (n = 65), 1 μM (n = 58), 3 μM (n = 63) and 10 μM (n = 64). The peak current in the presence of the agonist was normalised to the peak current in the presence of reference only. Fitted curves (blue) were generated from the Hill equation.
FIGURE 8
FIGURE 8
NO‐ and endothelial PIEZO1‐dependent vasorelaxation. Isometric tension of mouse portal vein possessing intact endothelium was measured following pre‐constriction with 10 μM phenylephrine (PE) and exposure to increasing concentrations (0.1, 0.3, 1, 3 and 10 μM) of indicated compounds. (a) (upper panel) Isometric tension traces from single experiments (n = 1) in which mouse portal vein segments were exposed to increasing concentrations of (i) Yoda1, (ii) KC159 and (iii) KC289. The dots indicate the sequential addition of rising concentrations of compounds. (lower panel) Corresponding dose–response data for (iv) Yoda1 (n = 8), (v) KC159 (n = 5) and (vi) KC289 (n = 5) expressed as a % of the maximal PE‐induced tension. Squares indicate median values, and dotted lines indicate the data range from collated experiments. For Yoda1, curve fitting was not successful due to the lack of upper plateau. For KC159 and KC289, fitted curves generated from the Hill equation (Hill1 in OriginPro 2020 software) and their corresponding EC50 values are shown. (b) (i) Isometric tension response trace from a single experiment (n = 1) in which increasing concentrations of KC289 were added before and after a 30 min pre‐incubation of the vessel with 100 μM l‐NAME. (ii) Corresponding collated dose–response data expressed as a % of the maximal PE‐induced tension (n = 5). Median and range are shown. (c) Isometric tension response traces from a single experiment (n = 1) in which increasing concentrations of KC289 were added to portal veins from (i) control and (ii) PIEZO1ΔEC mice. (iii) Corresponding dose–response data expressed as a % of the maximal PE‐induced tension (control, n = 9; PIEZO1ΔEC, n = 9). Median and range from collated experiments are shown.
FIGURE 9
FIGURE 9
Effects of 3‐ and 4‐benzamide and 3‐benzoic acid analogues. Paired, background‐subtracted (Δ), peak intracellular Ca2+ measurement comparisons of (a) hPIEZO1‐TREx and (b) mPIEZO1‐TREx pretreated with 10 μM indicated compound for 30 min prior to acute exposure to (ii–vi) the indicated Yoda1 stimulus. Each plot shows mean peak values from independent experiments. (a) Independent experiment numbers for hPIEZO1‐TREx experiments: KC157, n = 6; KC158, n = 6; KC159, n = 6; KC161, n = 6; KC162, n = 11; and KC289, n = 7. (b) Independent experiment numbers for mPIEZO1‐TREx experiments: n = 6 for all compounds. Comparisons of the median values of the collated experiments are shown. * P < 0.05, significantly different as indicated; ns, not significantly different; paired‐sample Wilcoxon signed‐rank test. Median fold differences compared to DMSO pretreatment/indicated Yoda1 stimulation are also shown.
FIGURE 10
FIGURE 10
Relevance to PIEZO2. (a) Background‐subtracted (Δ) peak intracellular Ca2+ measurements of HEK 293 cells overexpressing mPIEZO1, mPIEZO2 or non‐transfected cells. Cells were exposed to 10 μM (i) Yoda1, (ii) KC159 and (iii) KC289. In each case, mean ± SEM values from four technical replicates are shown (n = 1 each). (iv) Mean ± SD (n = 6) for peak Ca2+ signals evoked by 10 μM Yoda1, KC159 and KC289. (b) Background‐subtracted (Δ) peak intracellular Ca2+ measurements of HeLa cells after siRNA mediated knockdown of hPIEZO1 (siRNA targeted to PIEZO1 expression [siPIEZO1]), hPIEZO2 (siPIEZO2), both (siPIEZO1 + siPIEZO2) or transfected with a non‐targeting (control [Ctrl]) siRNA (siCtrl). Cells were exposed to 10 μM (i) Yoda1, (ii) KC159 and (iii) KC289. Mean ± SEM values from four technical replicates are shown (n = 1 each). (iv) Mean ± SD (n = 5) for peak Ca2+ signals evoked by 10 μM Yoda1, KC159 and KC289. Mean values of the collated experiments are shown. * P < 0.05, significantly different as indicated; ns, not significantly different; # P < 0.05, significantly different from siCtrl; repeated measures one‐way ANOVA followed by Tukey's post hoc test for multiple comparisons.

References

    1. Akbulut, Y. , Gaunt, H. J. , Muraki, K. , Ludlow, M. J. , Amer, M. S. , Bruns, A. , Vasudev, N. S. , Radtke, L. , Willot, M. , Hahn, S. , Seitz, T. , Ziegler, S. , Christmann, M. , Beech, D. J. , & Waldmann, H. (2015). (−)‐Englerin A is a potent and selective activator of TRPC4 and TRPC5 calcium channels. Angewandte Chemie (International Ed. in English), 54, 3787–3791. 10.1002/anie.201411511 - DOI - PMC - PubMed
    1. Alexander, S. P. , Christopoulos, A. , Davenport, A. P. , Kelly, E. , Mathie, A. , Peters, J. A. , Veale, E. L. , Armstrong, J. F. , Faccenda, E. , Harding, S. D. , Pawson, A. J. , Southan, C. , Davies, J. A. , Abbracchio, M. P. , Alexander, W. , Al‐hosaini, K. , Bäck, M. , Barnes, N. M. , Bathgate, R. , … Ye, R. D. (2021). THE CONCISE GUIDE TO PHARMACOLOGY 2021/22: G protein‐coupled receptors. British Journal of Pharmacology, 178(S1), S27–S156. 10.1111/bph.15538 - DOI - PubMed
    1. Alexander, S. P. , Fabbro, D. , Kelly, E. , Mathie, A. , Peters, J. A. , Veale, E. L. , Armstrong, J. F. , Faccenda, E. , Harding, S. D. , Pawson, A. J. , Southan, C. , Davies, J. A. , Boison, D. , Burns, K. E. , Dessauer, C. , Gertsch, J. , Helsby, N. A. , Izzo, A. A. , Koesling, D. , … Wong, S. S. (2021). THE CONCISE GUIDE TO PHARMACOLOGY 2021/22: Enzymes. British Journal of Pharmacology, 178(S1), S313–S411. 10.1111/bph.15542 - DOI - PubMed
    1. Alexander, S. P. , Kelly, E. , Mathie, A. , Peters, J. A. , Veale, E. L. , Armstrong, J. F. , Faccenda, E. , Harding, S. D. , Pawson, A. J. , Southan, C. , Davies, J. A. , Amarosi, L. , Anderson, C. M. H. , Beart, P. M. , Broer, S. , Dawson, P. A. , Hagenbuch, B. , Hammond, J. R. , Inui, K.‐I. , … Verri, T. (2021). THE CONCISE GUIDE TO PHARMACOLOGY 2021/22: Transporters. British Journal of Pharmacology, 178(S1), S412–S513. 10.1111/bph.15543 - DOI - PubMed
    1. Alexander, S. P. , Mathie, A. , Peters, J. A. , Veale, E. L. , Striessnig, J. , Kelly, E. , Armstrong, J. F. , Faccenda, E. , Harding, S. D. , Pawson, A. J. , Southan, C. , Davies, J. A. , Aldrich, R. W. , Attali, B. , Baggetta, A. M. , Becirovic, E. , Biel, M. , Bill, R. M. , Catterall, W. A. , … Zhu, M. (2021). The Concise Guide to PHARMACOLOGY 2021/22: Ion channels. British Journal of Pharmacology, 178(Suppl 1), S157–S245. - PubMed

Publication types