. 2022 Aug 30:13:939633.
doi: 10.3389/fphys.2022.939633. eCollection 2022.

Intra-subject stability of different expressions of spatial QRS-T angle and their relationship to heart rate

Affiliations

Intra-subject stability of different expressions of spatial QRS-T angle and their relationship to heart rate

Irena Andršová et al. Front Physiol. .

Abstract

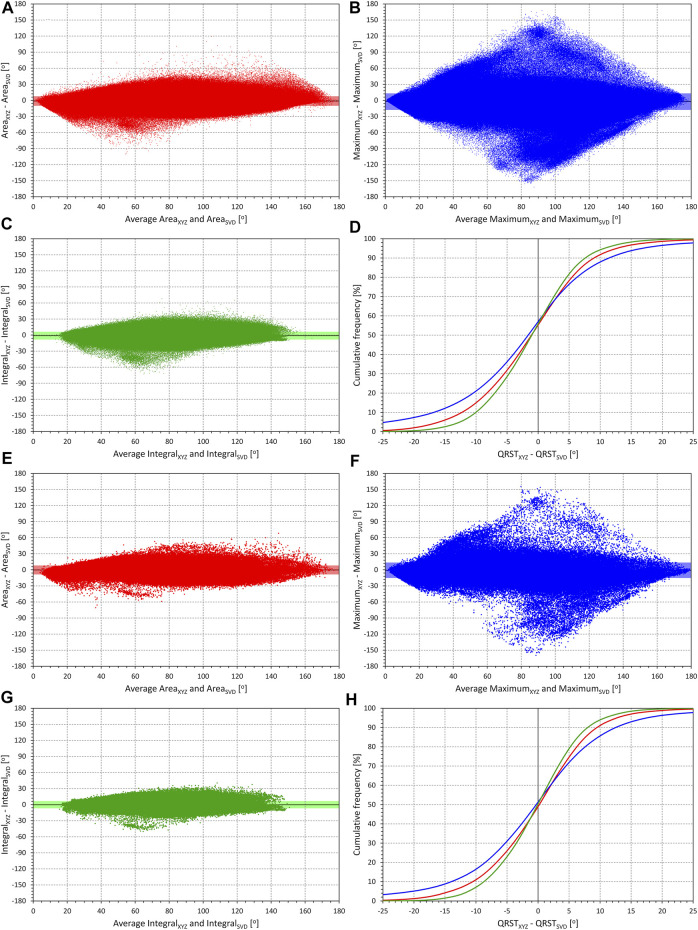
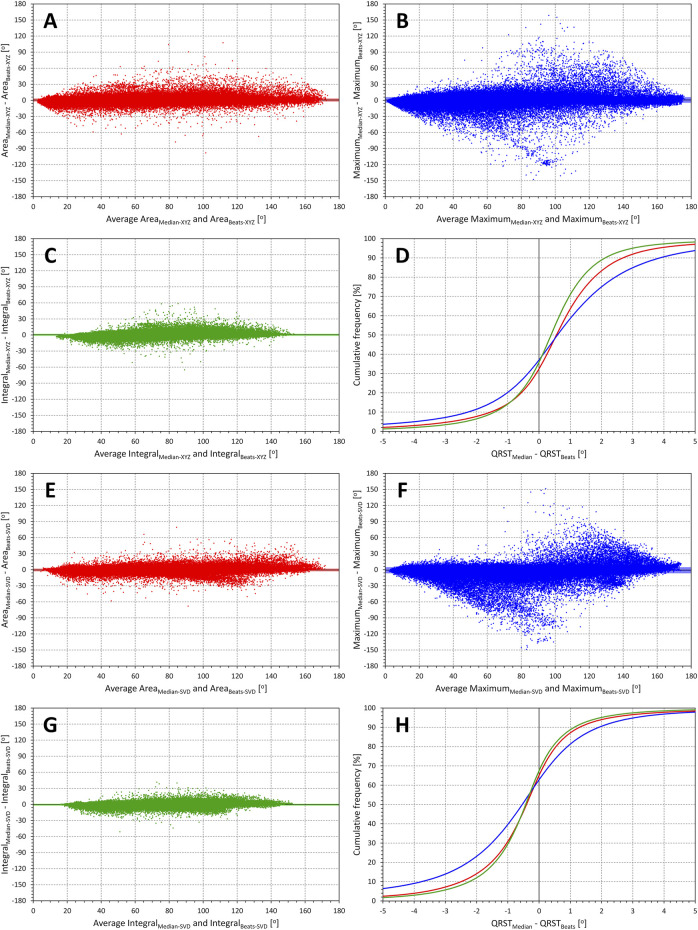
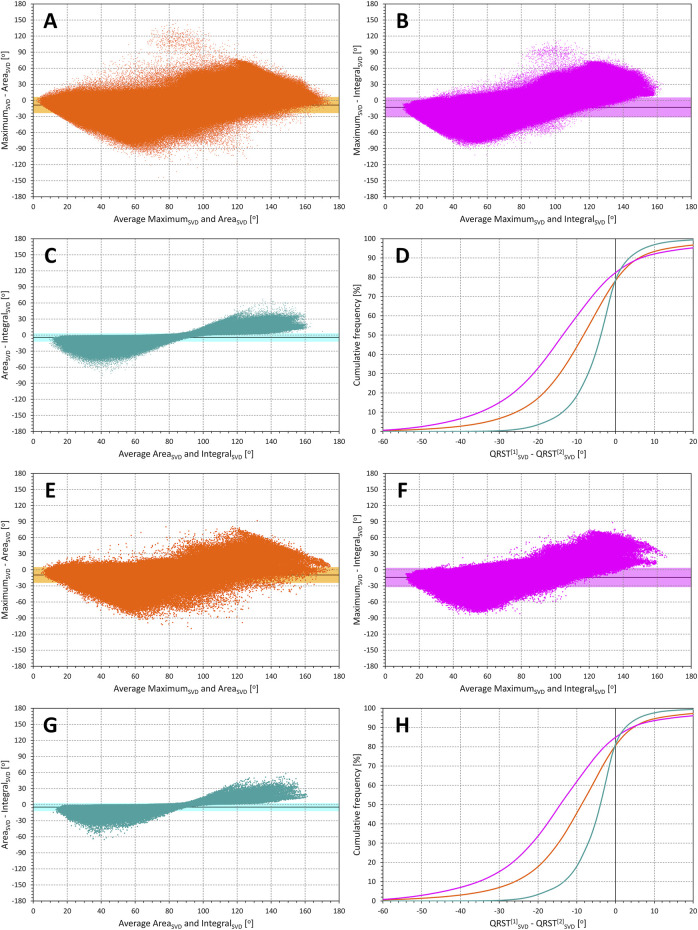
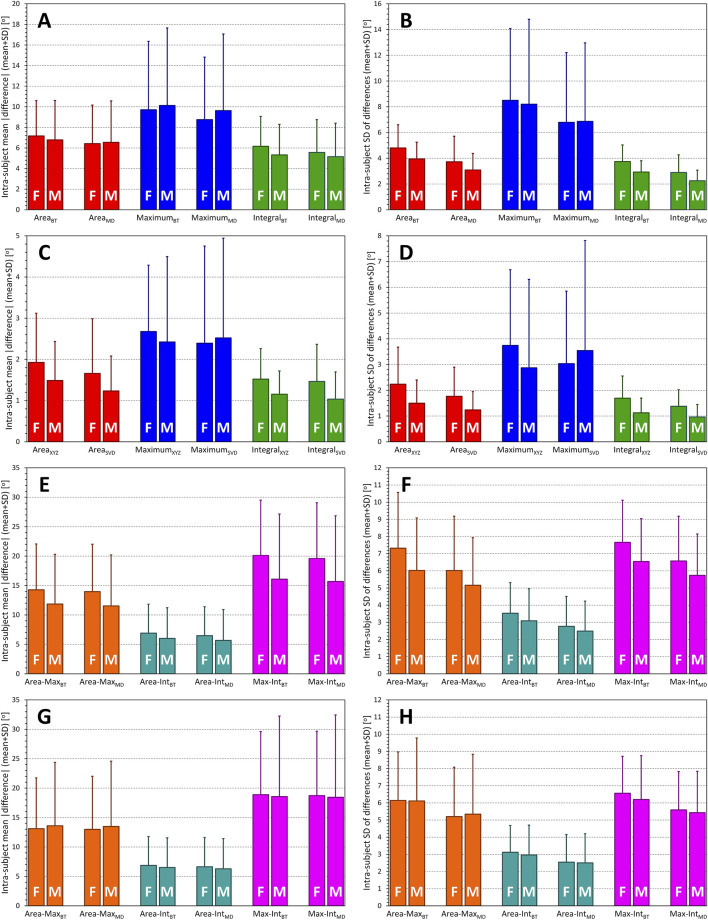
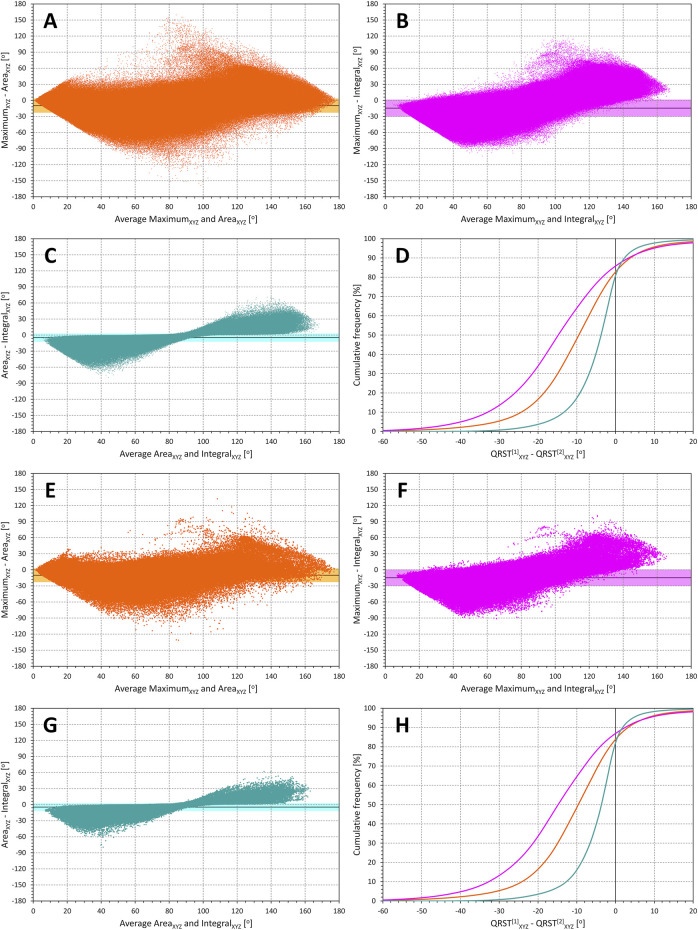
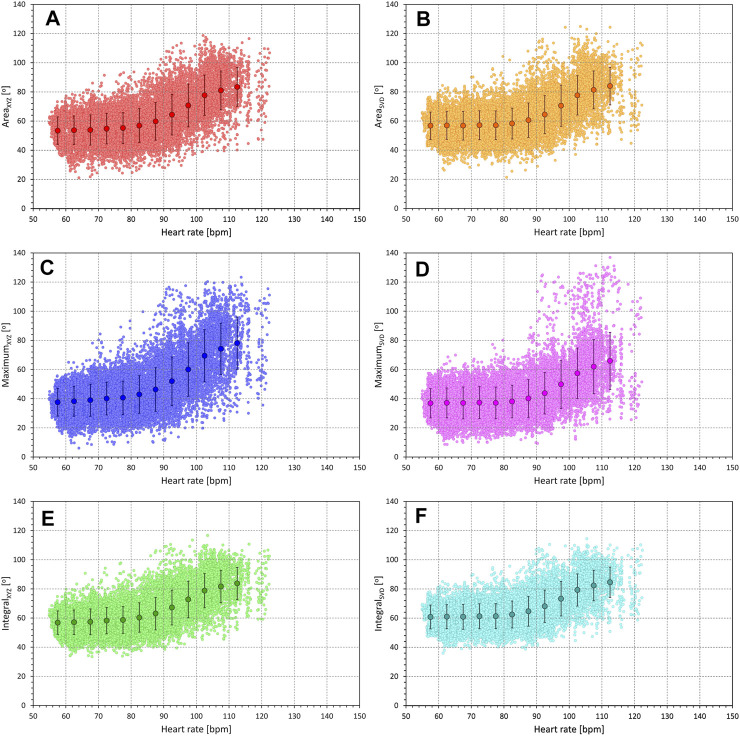
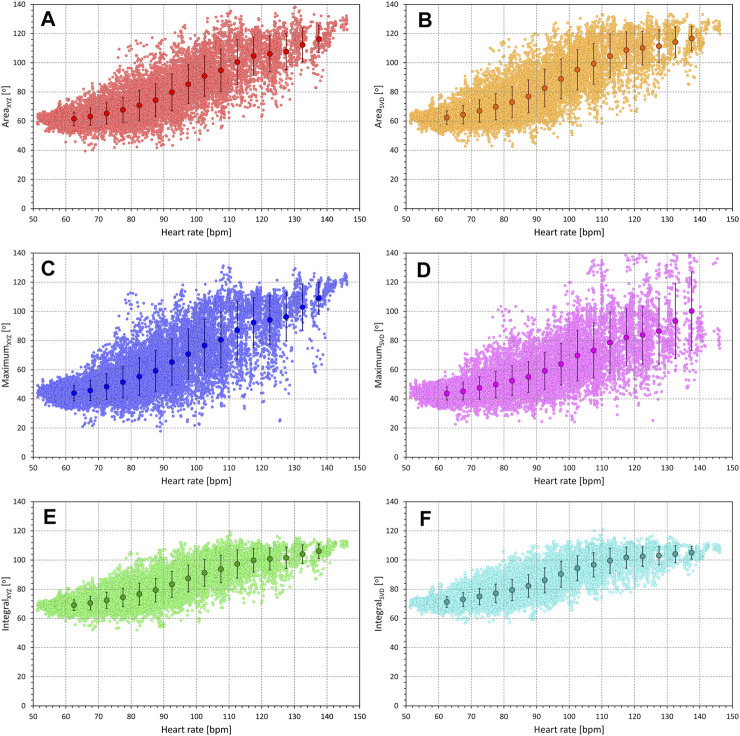
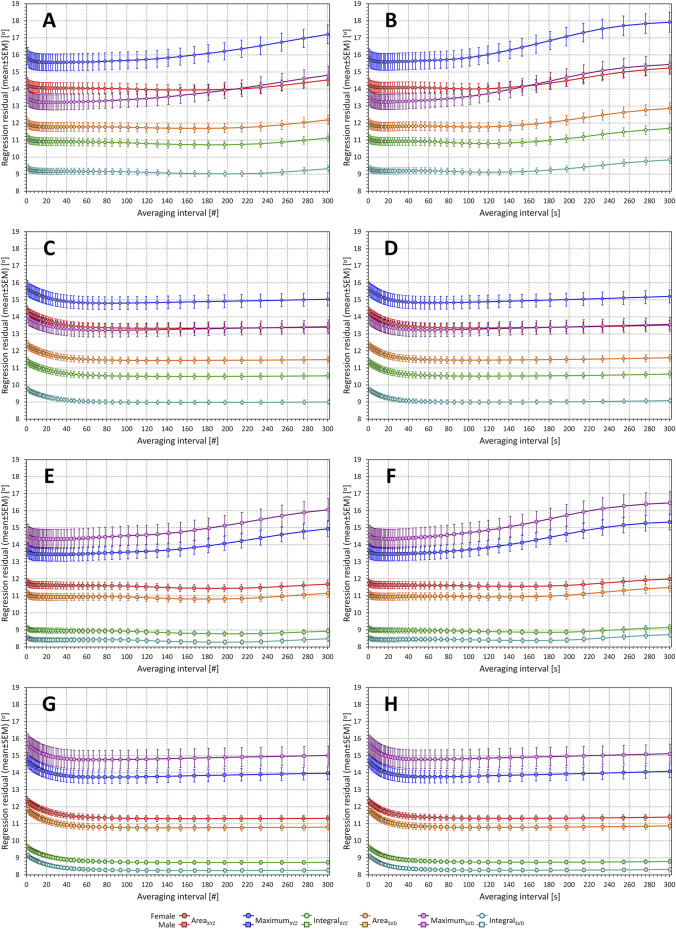
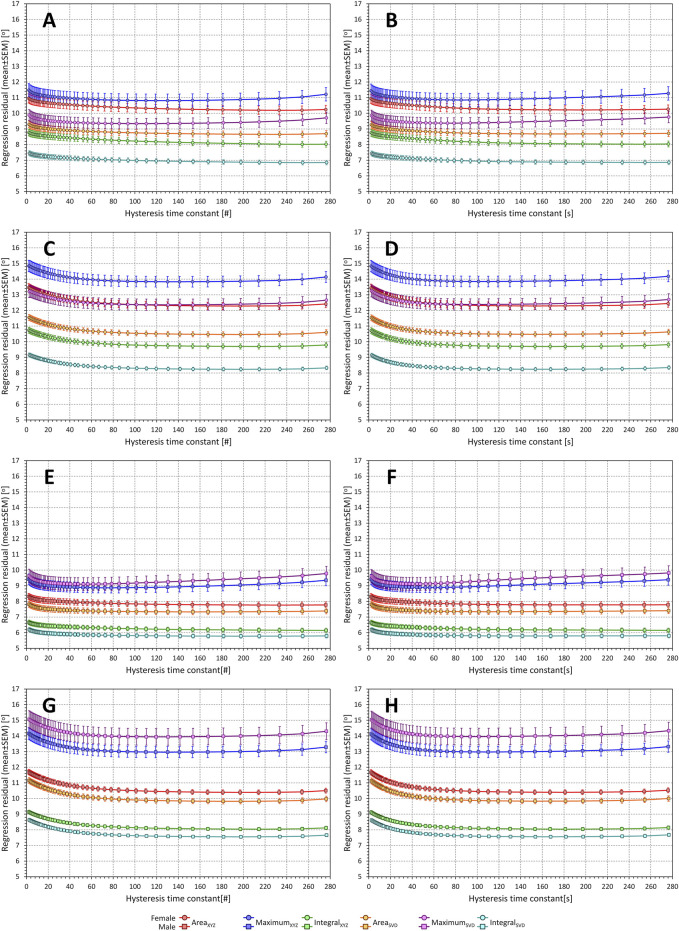
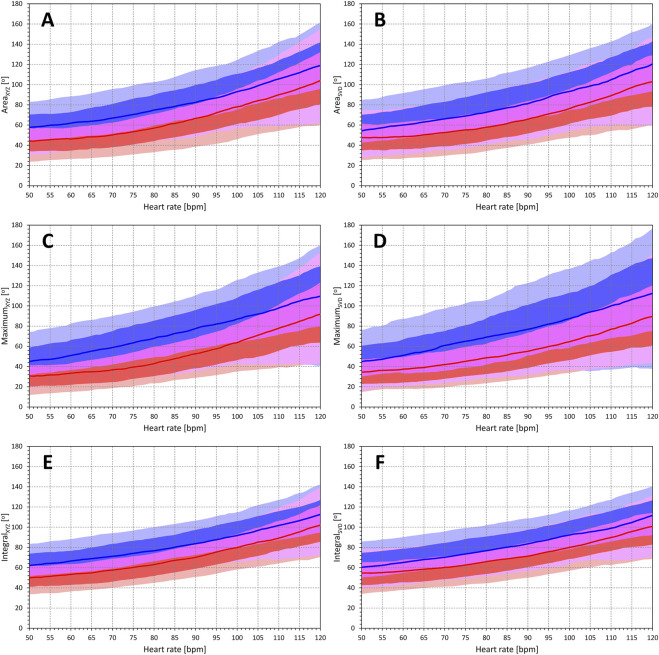
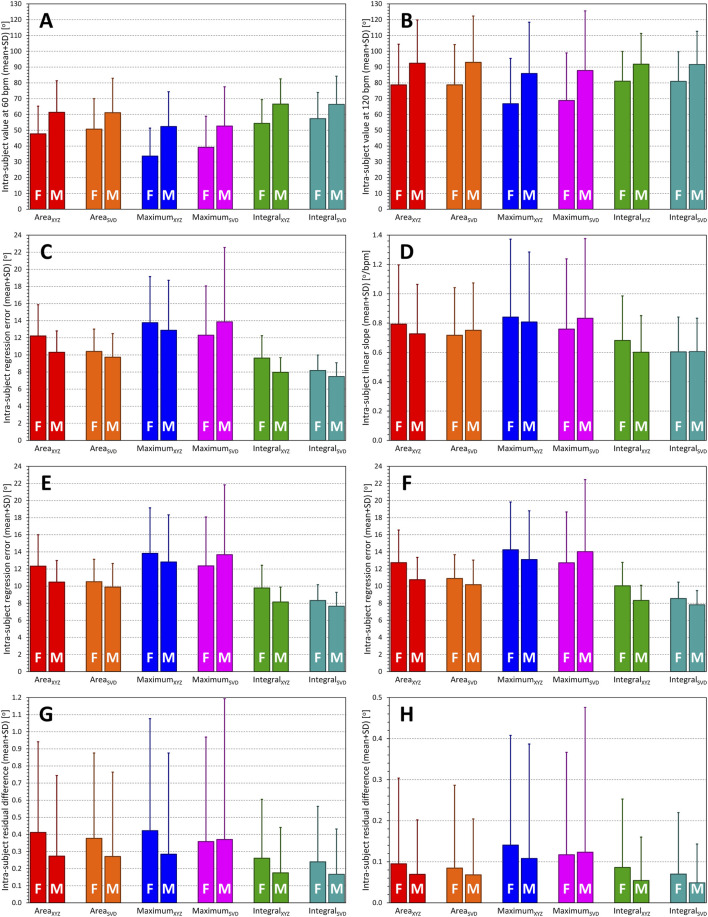
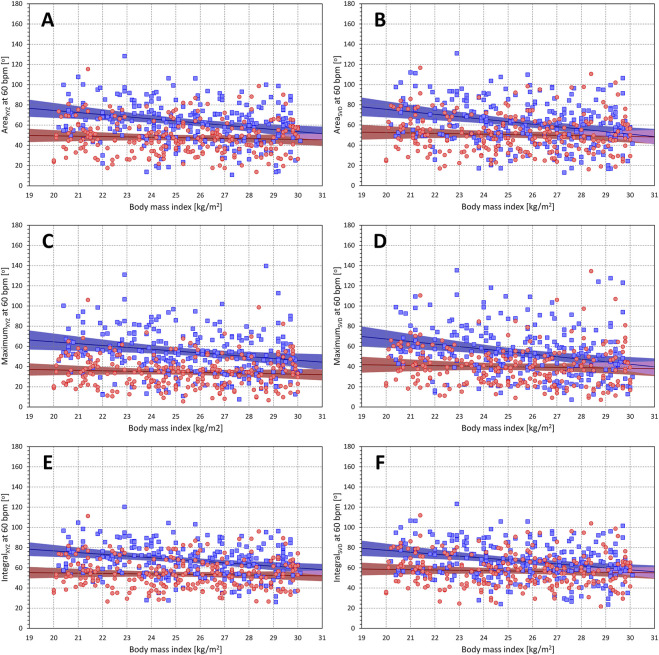
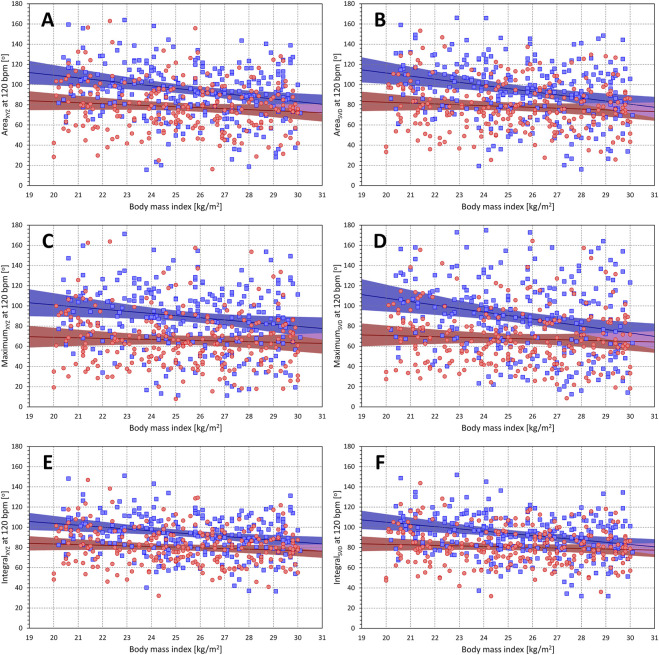
Three-dimensional angle between the QRS complex and T wave vectors is a known powerful cardiovascular risk predictor. Nevertheless, several physiological properties of the angle are unknown or poorly understood. These include, among others, intra-subject profiles and stability of the angle relationship to heart rate, characteristics of angle/heart-rate hysteresis, and the changes of these characteristics with different modes of QRS-T angle calculation. These characteristics were investigated in long-term 12-lead Holter recordings of 523 healthy volunteers (259 females). Three different algorithmic methods for the angle computation were based on maximal vector magnitude of QRS and T wave loops, areas under the QRS complex and T wave curvatures in orthogonal leads, and weighted integration of all QRS and T wave vectors moving around the respective 3-dimensional loops. These methods were applied to orthogonal leads derived either by a uniform conversion matrix or by singular value decomposition (SVD) of the original 12-lead ECG, giving 6 possible ways of expressing the angle. Heart rate hysteresis was assessed using the exponential decay models. All these methods were used to measure the angle in 659,313 representative waveforms of individual 10-s ECG samples and in 7,350,733 individual beats contained in the same 10-s samples. With all measurement methods, the measured angles fitted second-degree polynomial regressions to the underlying heart rate. Independent of the measurement method, the angles were found significantly narrower in females (p < 0.00001) with the differences to males between 10o and 20o, suggesting that in future risk-assessment studies, different angle dichotomies are needed for both sexes. The integrative method combined with SVD leads showed the highest intra-subject reproducibility (p < 0.00001). No reproducible delay between heart rate changes and QRS-T angle changes was found. This was interpreted as a suggestion that the measurement of QRS-T angle might offer direct assessment of cardiac autonomic responsiveness at the ventricular level.

Keywords: ECG measurements; healthy volunteers; heart rate; heart rate hysteresis; long-term ECG; polynomial regression; sex differences; spatial QRS-T angle.


Conflict of interest statement

The authors declare that the research was conducted in the absence of any commercial or financial relationships that could be construed as a potential conflict of interest.

Figures

FIGURE 1
FIGURE 1
Comparison of QRS-T angle measurements in XYZ and SVD orthogonal projections. The matrix (XYZ) and the singular value decomposition (SVD) methods are used to derive orthogonal leads. In individual panels, the measurements in all subjects are pooled and the difference between XYZ and SVD angle expressions is plotted against their averaged value. The mean difference is shown by a bold horizontal line while the light-coloured band (along the horizontal axis) shows the spread of mean ± standard deviation. Panels (A) (comparisons of AreaXYZ and AreaSVD), (B) (comparisons of MaximumXYZ and MaximumSVD), and (C) (comparisons of IntegralXYZ and IntegralSVD) show data derived from individual beats. Panel (D) shows cumulative distributions of the MethodXYZ-MethodSVD values shown in panels (A), (B), and (C) (the colours of the graphs in this panel correspond to the colours of the scatter diagram panels). Panels (E), (F), and (G) show corresponding comparisons of the methods applied to representative waveforms of individual 10-s ECG segments. Panel (H) again shows the cumulative distributions of the method differences shown in panels (E), (F), and (G). Note that the trapezoidal shape of the images (noticeable especially in panels (B) and (F) is caused by the measurements strictly between 0o and 180o (the difference of 180o is only possible if one of the methods gives 0o and the other 180o, in which case the average of the methods is 90o).
FIGURE 2
FIGURE 2
Comparisons of QRS-T angle measurements in individual beats and representative waveforms. Bland-Altman type of comparisons between QRS-T angle expressions measured at the representative waveform of 10-s ECG segments with the averages of the same angle expressions measured at individual beats of the same ECG segment. The layout of the figure and of the individual panels corresponds to that of Figure 1, with all the measurements in all study subjects pooled. In the method indicators, additional subscripts Median and Beats indicate measurement value derived from representative median waveform and obtained as an average of individual beats of the ECG segment, respectively. Panels (A,B) and (C) show the comparisons for the AreaXYZ, MaximumXYZ, and IntegralXYZ angle measurements, respectively; panel (D) again shows the cumulative distributions of the measurement differences shown in panels (A), (B), and (C). The same analysis of the results of methods AreaSVD, MaximumSVD, and IntegralSVD is shown in panels (E,F) and (G), respectively; corresponding cumulative distributions are shown in panel (H).
FIGURE 4
FIGURE 4
Comparisons of methods of QRS-T angle measurements in SVD orthogonal projections. Bland-Altman type of comparisons between different QRS-T angle methods applied to the orthogonal leads derived by singular value decomposition of the original 12-lead ECG signals. The layout of the Figure and the meaning of individual panels is the same as in Figure 3 but methods Maximum SVD, AreaSVD, and IntegralSVD were analysed instead of MaximumXYZ, AreaXYZ, and IntegralXYZ, respectively.
FIGURE 5
FIGURE 5
Statistical summaries of the differences between QRS-T angle measurements shown in Figures 1–4. Panel (A) shows the summary of intra-subject means of absolute values of the differences between the angle measurements in conversion matrix-derived XYZ orthogonal leads and SVD-derived optimised orthogonal leads; panel (B) shows the summary of intra-subject standard deviations of these differences. Panel (C) shows the summary of intra-subject means of absolute values of the differences between measurements in median waveforms of an ECG segment and the averages of measurements in individual beats of the same segment; panel (D) shows the summary of intra-subject standard deviations of these differences. Panels (E) and (G) show the summary of the intra-subject means of absolute values of the differences between different measurement methods applied to the matrix-derived XYZ orthogonal leads (panel E) and to the measurements SVD-derived optimised orthogonal leads (panel G); panels (F) and (H) show the summary of intra-subject standard deviations of these differences. In each panel, statistics of female (F) and male (M) sub-populations are shown separately. See the text for the definition of measurement methods (Max – Maximum, Int – Integral). Subscripts MethodBT and MethodMD indicate measurements performed in individual beats and in the median waveforms, respectively. See the text for p-values of statistical comparisons.
FIGURE 3
FIGURE 3
Comparisons of methods of QRS-T angle measurements in XYZ orthogonal projections. Bland-Altman type of comparisons between different QRS-T angle methods applied to the matrix-derived orthogonal leads XYZ. The layout of the figure and of the individual panels corresponds to that of Figure 1, with all the measurements in all study subjects pooled. Panels (A–C) shows the comparisons of MaximumXYZ with AreaXYZ, MaximumXYZ with IntegrealXYZ, and AreaXYZ with IntegralXYZ, respectively, all values are derived from individual beat measurements. Panel (D) shows corresponding cumulative distributions, i.e., of pooled values MaximumXYZ─AreaXYZ, MaximumXYZ─IntegrealXYZ, and AreaXYZ─IntegralXYZ. Panels (E–H) show the same analysis applied to the measurements derived from representative median waveforms of 10-s ECG segments (again pooled over all study subjects).
FIGURE 6
FIGURE 6
Example of the relationship of beat-based measurements of QRS-T angle and the heart rate measured over 1 min preceding each angle measurements. The data were obtained from the recordings of a 21.2-year-old female subject. Individual panels of the figure correspond to different QRS-T angle expressions; results corresponding to, AreaXYZ, AreaSVD, MaximumXYZ, MaximumSVD, IntegralXYZ, and IntegralSVD angle expressions are shown in panels (A–F), respectively. In each panel, the individual light-colour small marks correspond to the individual ECG beats data, the larger full-colour marks correspond to the averages of the QRS-T angle values in 5 beat per minute (BPM) bins, the error bars of the larger full-colour marks show the spread of ±1 standard deviation in the corresponding 5-BPM bins.
FIGURE 7
FIGURE 7
Example of the relationship of beat-based measurements of QRS-T angle and the heart rate measured over 1 min preceding each angle measurements. The data were obtained from the recordings of a 24.4-year-old male subject. The layout of the figure and the meaning of the symbols correspond to those in Figure 6.
FIGURE 8
FIGURE 8
Regression residuals of QRS-T angle related to averaged preceding heart rate. In each panel, the individual graphs correspond to different QRS-T angle expressions and show the mean ± standard deviation of intra-subject residuals of second-degree polynomial regressions between QRS-T angle measurements and heart rates measured in preceding intervals of a given number of RR intervals [(#)—panels on the left] or a given number of seconds [(s)—panels on the right]. Panels (A) and (B) show the results in females with regressions involving only measurements preceded by variable heart rates; panels (C) and (D) show the results in females with regressions involving all measurements; panels (E) and (F) show the results in males with regressions involving only measurements preceded by variable heart rates; panels (G) and (H) show the results in males with regressions involving all measurements. Results related to the QRS-T angle expressions AreaXYZ, MaximumXYZ, IntegralXYZ, AreaSVD, MaximumSVD, and IntegralSVD are shown in red, blue, green, amber, violet, and cyan, respectively. See the text for the definitions of the angle expressions.
FIGURE 9
FIGURE 9
Regression residuals of QRS-T angle related to exponential decay of preceding heart rate. In each panel, the individual graphs correspond to different QRS-T angle expressions and show the mean ± standard deviation of intra-subject residuals of second-degree polynomial regressions between QRS-T angle measurements and heart rates derived by exponential decay hysteresis models with hysteresis constants of a given number of RR intervals [(#)—panels on the left] or a given number of seconds [(s)—panels on the right]. Panels (A,B) show the results in females with regressions involving only measurements preceded by variable heart rates; panels (C,D) show the results in females with regressions involving all measurements; panels (E) and (F) show the results in males with regressions involving only measurements preceded by variable heart rates; panels (G) and (H) show the results in males with regressions involving all measurements. Results related to the QRS-T angle expressions AreaXYZ, MaximumXYZ, IntegralXYZ, AreaSVD, MaximumSVD, and IntegralSVD are shown in red, blue, green, amber, violet, and cyan, respectively. See the text for the definitions of the angle expressions.
FIGURE 10
FIGURE 10
Population profiles of QRS-T angle relationship to underlying heart rate. Each panel of the figure corresponds to a different QRS-T angle expression and shows the summary of population distributions of intra-subject curvatures of second-degree polynomial regressions between QRS-T angle measurements and heart rate measured over the preceding 1 min. Bold red and blue lines show point-by-point median values of the regression curvatures in female and male subjects, respectively. The red and blue bands show the point-by-point inter-quartile ranges of the curvature values in females and males, respectively; the violet bands show the overlaps between the inter-quartile ranges between both sexes. The light red and light blue bands show the 10%–90% ranges of the curvature values in females and males, respectively; the light violet bands show the overlaps between the 10%–90% ranges between both sexes. The bands of inter-quartile ranges including their sex overlap are shown overlaying the 10%–90% bands. Panels (A–F) correspond to Area XYZ, AreaSVD, MaximumXYZ, MaximumSVD, IntegralXYZ, and IntegralSVD QRS-T angle expressions, respectively.
FIGURE 11
FIGURE 11
Summaries of QRS-T angle/rate regression residuals. Statistical evaluation of the characteristics of different QRS-T angle expressions (see the labels of the horizontal axes in each panel). Panels (A,B) show the intra-subject QRS-T angle values measured at the heart rate of 60 and 120 bpm, respectively (as derived by the second-degree polynomial regressions between QRS-T angle measurements and heart rate measured over the preceding 1 min). Panel (C) shows intra-subject residuals of the second-degree polynomial regression between QRS-T angle measurements and heart rate expressed by intra-subject optimum hysteresis model. Panel (D) shows intra-subject slopes of linear regressions between QRS-T angle measurements and heart rate measured during the preceding 1 min. Panels (E,F) show the intra-subject residuals of the second-degree (panel E) and linear (panel F) regressions between QRS-T angle measurements and heart rate measured over the preceding 1 min. Panels (G,H) show the decrease in regression residuals between second-degree and linear (panel G) and third-degree and second-degree (panel H) polynomial regression between QRS-T angle measurements and heart rate expressed by intra-subject optimum hysteresis model. In each panel, statistics of female (F) and male (M) sub-populations are shown separately. See the text for p-values of statistical comparisons.
FIGURE 12
FIGURE 12
Relationship of QRS-T angle (projections to heart rate of 60 bpm) to body mass index. The different panels of the figure show scatter diagrams between body mass index and subject-specific projections of different QRS-T angle expressions to the heart rate of 60 bpm. Panels (A–F) show QRS-T angle data of AreaXYZ, AreaSVD, MaximumXYZ, MaximumSVD, IntegralXYZ, and IntegralSVD, respectively. In each panel, the red circles and blue squares show the data of female and male subjects, respectively. The red and blue bold lines are linear regression of QRS-T angle to body mass index in female and male sub-populations, respectively. The light red and light blue areas are the 95% confidence bands of the sex-specific regressions, the light violet areas are the overlaps between the regression confidence bands of both sexes.
FIGURE 13
FIGURE 13
Relationship of QRS-T angle (projections to heart rate of 120 bpm) to body mass index. The different panels of the figure show scatter diagrams between body mass index and subject-specific projections of different QRS-T angle expressions to the heart rate of 120 bpm. The layout of the figure and the meaning of the individual symbols is the same as in Figure 12.

Similar articles

Cited by

References

    1. Acar B., Köymen H. (1999). SVD-based on-line exercise ECG signal orthogonalization. IEEE Trans. Biomed. Eng. 46, 311–321. 10.1109/10.748984 - DOI - PubMed
    1. Acar B., Yi G., Hnatkova K., Malik M. (1999). Spatial, temporal and wavefront direction characteristics of 12-lead T-wave morphology. Med. Biol. Eng. Comput. 37, 574–584. 10.1007/BF02513351 - DOI - PubMed
    1. Andršová I., Hnatkova K., Helánová K., Šišáková M., Novotný T., Kala P., et al. (2019). Individually rate corrected QTc intervals in children and adolescents. Front. Physiol. 10, 994. 10.3389/fphys.2019.00994 - DOI - PMC - PubMed
    1. Andršová I., Hnatkova K., Šišáková M., Toman O., Smetana P., Huster K. M., et al. (2020). Heart rate dependency and inter-lead variability of the T peak - T end intervals. Front. Physiol. 11, 595815. 10.3389/fphys.2020.595815 - DOI - PMC - PubMed
    1. Andršová I., Hnatkova K., Šišáková M., Toman O., Smetana P., Huster K. M., et al. (2022). Sex and rate change differences in QT/RR hysteresis in healthy subjects. Front. Physiol. 12, 814542. 10.3389/fphys.2021.814542 - DOI - PMC - PubMed

LinkOut - more resources