

Consistent downregulation of the cleft lip/palate-associated genes IRF6 and GRHL3 in carcinomas
- PMID: 36457487
- PMCID: PMC9706198
- DOI: 10.3389/fonc.2022.1023072
Consistent downregulation of the cleft lip/palate-associated genes IRF6 and GRHL3 in carcinomas
Abstract
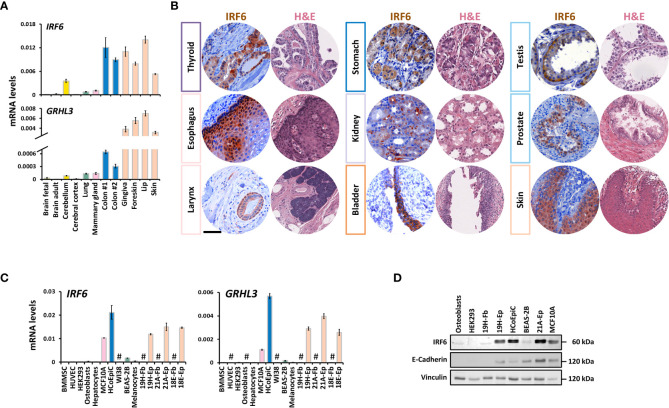
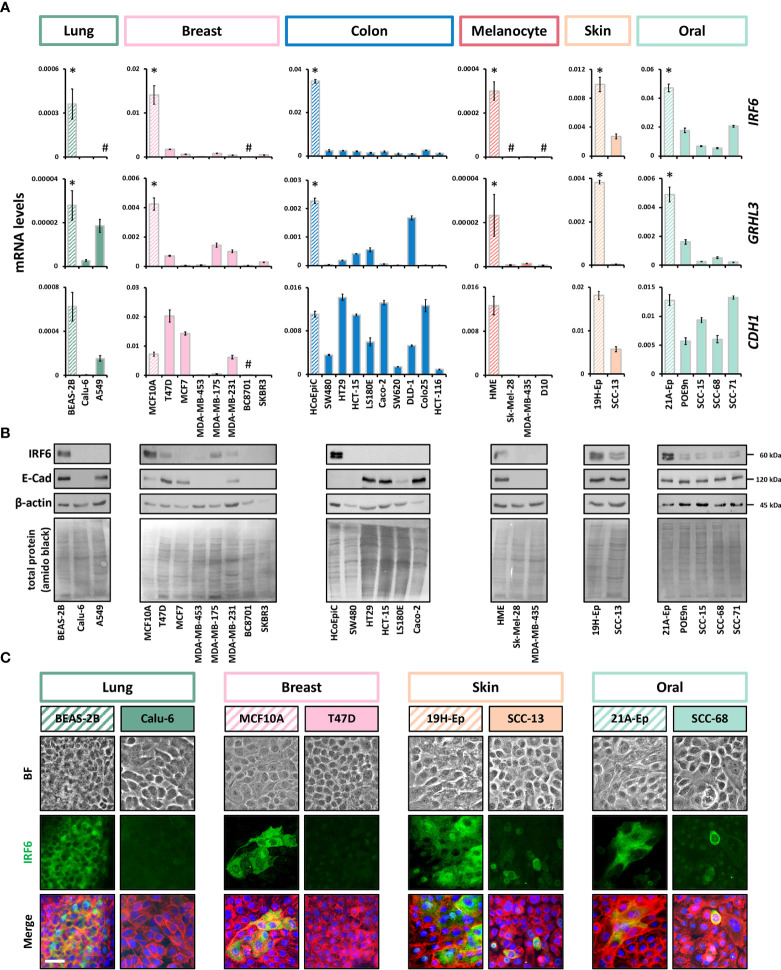
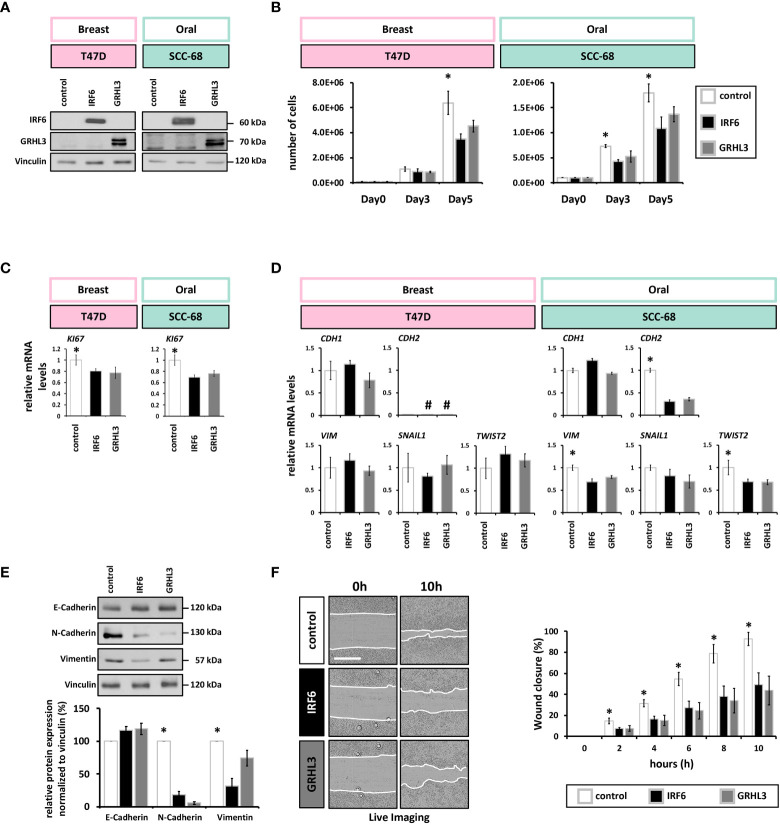
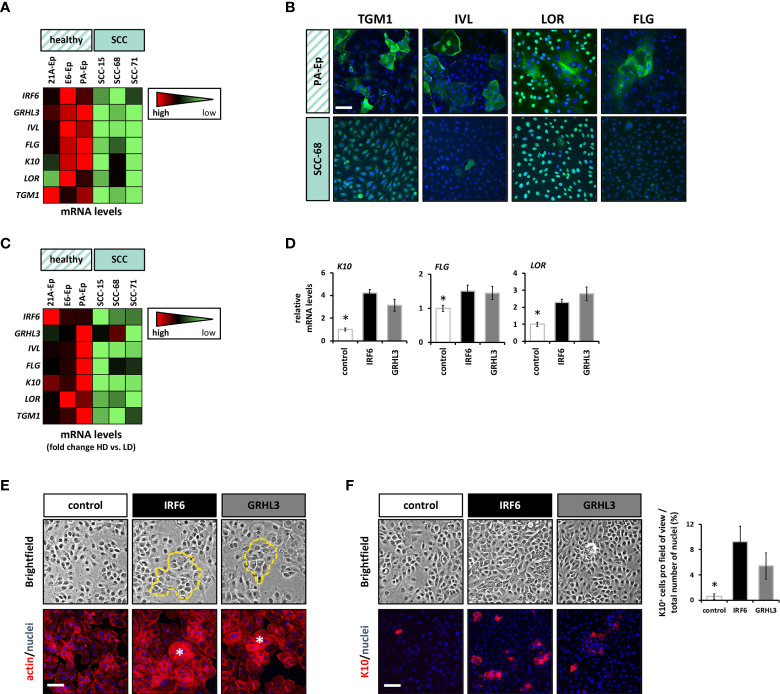
Interferon Regulatory Factor 6 (IRF6) and Grainyhead Like Transcription Factor 3 (GRHL3) are transcription factors that orchestrate gene regulatory networks required for the balance between keratinocyte differentiation and proliferation. Absence of either protein results in the lack of a normal stratified epidermis with keratinocytes failing to stop proliferating and to terminally differentiate. Numerous pathological variants within IRF6 and GRHL3 have been identified in orofacial cleft-affected individuals and expression of the two transcription factors has been found to be often dysregulated in cancers. However, whether orofacial cleft-associated IRF6 and GRHL3 variants in patients might also affect their cancer risk later in life, is not clear yet. The fact that the role of IRF6 and GRHL3 in cancer remains controversial makes this question even more challenging. Some studies identified IRF6 and GRHL3 as oncogenes, while others could attribute tumor suppressive functions to them. Trying to solve this apparent conundrum, we herein aimed to characterize IRF6 and GRHL3 function in various types of carcinomas. We screened multiple cancer and normal cell lines for their expression, and subsequently proceeded with functional assays in cancer cell lines. Our data uncovered consistent downregulation of IRF6 and GRHL3 in all types of carcinomas analyzed. Reduced levels of IRF6 and GRHL3 were found to be associated with several tumorigenic properties, such as enhanced cell proliferation, epithelial mesenchymal transition, migration and reduced differentiation capacity. Based on our findings, IRF6 and GRHL3 can be considered as tumor suppressor genes in various carcinomas, which makes them potential common etiological factors for cancer and CLP in a fraction of CLP-affected patients.
Keywords: GRHL3; IRF6; cancer; differentiation; orofacial cleft; tumor suppressor.
Copyright © 2022 Parisi, Mockenhaupt, Rihs, Mansour, Katsaros and Degen.
Conflict of interest statement
The authors declare that the research was conducted in the absence of any commercial or financial relationships that could be construed as a potential conflict of interest.
Figures
Similar articles
-
Toward an orofacial gene regulatory network.Dev Dyn. 2016 Mar;245(3):220-32. doi: 10.1002/dvdy.24341. Epub 2015 Sep 17. Dev Dyn. 2016. PMID: 26332872 Free PMC article. Review.
-
Lack of IRF6 Disrupts Human Epithelial Homeostasis by Altering Colony Morphology, Migration Pattern, and Differentiation Potential of Keratinocytes.Front Cell Dev Biol. 2021 Sep 30;9:718066. doi: 10.3389/fcell.2021.718066. eCollection 2021. Front Cell Dev Biol. 2021. PMID: 34660580 Free PMC article.
-
Dominant mutations in GRHL3 cause Van der Woude Syndrome and disrupt oral periderm development.Am J Hum Genet. 2014 Jan 2;94(1):23-32. doi: 10.1016/j.ajhg.2013.11.009. Epub 2013 Dec 19. Am J Hum Genet. 2014. PMID: 24360809 Free PMC article.
-
IRF6 and SPRY4 Signaling Interact in Periderm Development.J Dent Res. 2017 Oct;96(11):1306-1313. doi: 10.1177/0022034517719870. Epub 2017 Jul 21. J Dent Res. 2017. PMID: 28732181 Free PMC article.
-
Disrupted IRF6-NME1/2 Complexes as a Cause of Cleft Lip/Palate.J Dent Res. 2017 Oct;96(11):1330-1338. doi: 10.1177/0022034517723615. Epub 2017 Aug 2. J Dent Res. 2017. PMID: 28767310 Free PMC article.
Cited by
-
Neural crest and periderm-specific requirements of Irf6 during neural tube and craniofacial development.bioRxiv [Preprint]. 2024 Jun 11:2024.06.11.598425. doi: 10.1101/2024.06.11.598425. bioRxiv. 2024. Update in: Dev Biol. 2025 Jun;522:106-115. doi: 10.1016/j.ydbio.2025.03.006. PMID: 38915513 Free PMC article. Updated. Preprint.
-
Pro-inflammatory cytokine IL-6 regulates LMO4 expression in psoriatic keratinocytes via AKT/STAT3 pathway.Immun Inflamm Dis. 2023 Dec;11(12):e1104. doi: 10.1002/iid3.1104. Immun Inflamm Dis. 2023. PMID: 38156380 Free PMC article.
-
Neural crest and periderm-specific requirements of Irf6 during neural tube and craniofacial development.Dev Biol. 2025 Jun;522:106-115. doi: 10.1016/j.ydbio.2025.03.006. Epub 2025 Mar 18. Dev Biol. 2025. PMID: 40113028 Review.
-
IRF6 controls Epstein-Barr virus (EBV) lytic reactivation and differentiation in EBV-infected epithelial cells.PLoS Pathog. 2025 Jun 26;21(6):e1013236. doi: 10.1371/journal.ppat.1013236. eCollection 2025 Jun. PLoS Pathog. 2025. PMID: 40569988 Free PMC article.
-
Development and validation of a combined hypoxia- and metabolism-related prognostic signature to predict clinical prognosis and immunotherapy responses in clear cell renal cell carcinoma.Front Oncol. 2023 Nov 10;13:1162846. doi: 10.3389/fonc.2023.1162846. eCollection 2023. Front Oncol. 2023. PMID: 38023248 Free PMC article.
References
LinkOut - more resources
Full Text Sources
Miscellaneous