

Characterization of Epithelial-Mesenchymal Transition Identifies a Gene Signature for Predicting Clinical Outcomes and Therapeutic Responses in Bladder Cancer
- PMID: 36457546
- PMCID: PMC9708359
- DOI: 10.1155/2022/9593039
Characterization of Epithelial-Mesenchymal Transition Identifies a Gene Signature for Predicting Clinical Outcomes and Therapeutic Responses in Bladder Cancer
Abstract
Purpose: The complex etiological variables and high heterogeneity of bladder cancer (BC) make prognostic prediction challenging. We aimed to develop a robust and promising gene signature using advanced machine learning methods for predicting the prognosis and therapy responses of BC patients.
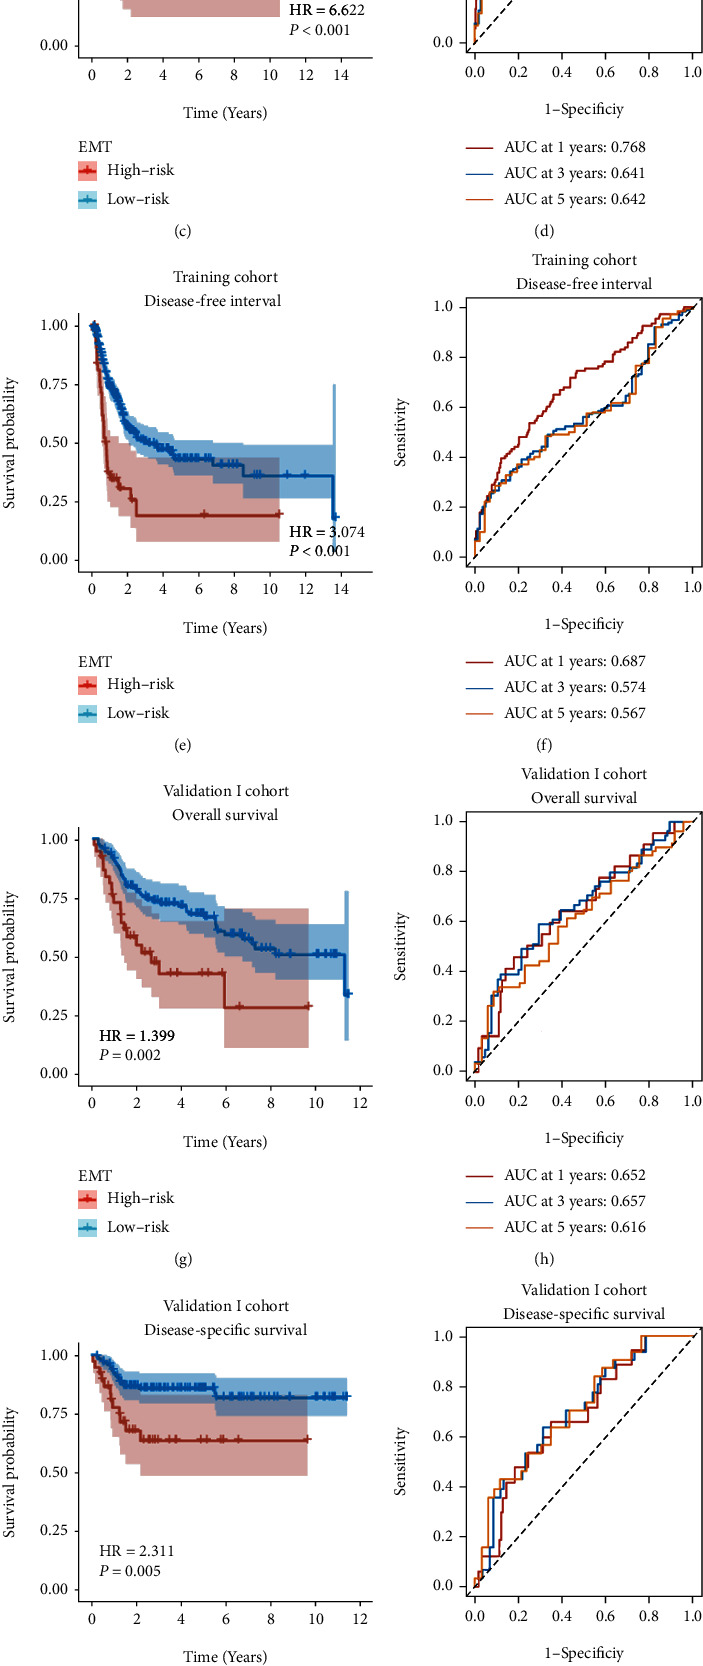
Methods: The single-sample gene set enrichment analysis (ssGSEA) algorithm and univariable Cox regression were used to identify the primary risk hallmark among the various cancer hallmarks. Machine learning methods were then combined with survival and differential gene expression analyses to construct a novel prognostic signature, which would be validated in two additional independent cohorts. Moreover, relationships between this signature and therapy responses were also identified. Functional enrichment analysis and immune cell estimation were also conducted to provide insights into the potential mechanisms of BC.
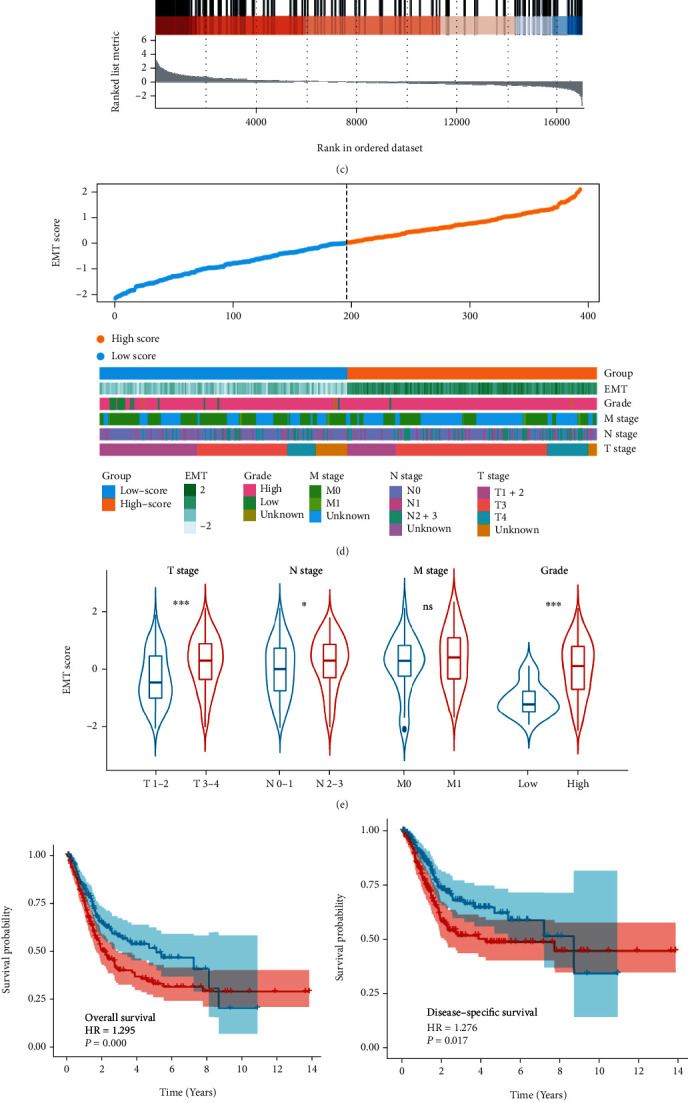
Results: Epithelial-mesenchymal transition (EMT) was identified as the primary risk factor for the survival of BC patients (HR=1.43, 95% CI: 1.26-1.63). A novel EMT-related gene signature was constructed and validated in three independent cohorts, showing stable and accurate performance in predicting clinical outcomes. Furthermore, high-risk patients had poor prognoses and multivariable Cox regression analysis revealed this to be an independent risk factor for patient survival. CD8+ T cells, Tregs, and M2 macrophages were found abundantly in the tumor microenvironment of high-risk patients. Moreover, it was anticipated that high-risk patients would be more sensitive to chemotherapeutic drugs, while low-risk patients would benefit more from immunotherapy.
Conclusions: We successfully identified and validated a novel EMT-related gene signature for predicting clinical outcomes and therapy responses in BC patients, which may be useful in clinical practice for risk stratification and individualized treatment.
Copyright © 2022 Yicun Wang et al.
Conflict of interest statement
The authors declare that there is no conflict of interest regarding the publication of this paper.
Figures


Similar articles
-
Comprehensive FGFR3 alteration-related transcriptomic characterization is involved in immune infiltration and correlated with prognosis and immunotherapy response of bladder cancer.Front Immunol. 2022 Jul 26;13:931906. doi: 10.3389/fimmu.2022.931906. eCollection 2022. Front Immunol. 2022. PMID: 35958598 Free PMC article.
-
Identification and validation of an immune signature associated with EMT and metabolic reprogramming for predicting prognosis and drug response in bladder cancer.Front Immunol. 2022 Jul 25;13:954616. doi: 10.3389/fimmu.2022.954616. eCollection 2022. Front Immunol. 2022. PMID: 35958586 Free PMC article.
-
Integrative transcriptional characterization of cell cycle checkpoint genes promotes clinical management and precision medicine in bladder carcinoma.Front Oncol. 2022 Aug 11;12:915662. doi: 10.3389/fonc.2022.915662. eCollection 2022. Front Oncol. 2022. PMID: 36033441 Free PMC article.
-
An epithelial-mesenchymal transition-related long noncoding RNA signature correlates with the prognosis and progression in patients with bladder cancer.Biosci Rep. 2021 Jan 29;41(1):BSR20203944. doi: 10.1042/BSR20203944. Biosci Rep. 2021. PMID: 33289830 Free PMC article.
-
A novel immune-related gene pair prognostic signature for predicting overall survival in bladder cancer.BMC Cancer. 2021 Jul 15;21(1):810. doi: 10.1186/s12885-021-08486-0. BMC Cancer. 2021. PMID: 34266411 Free PMC article.
Cited by
-
Comprehensive characterization of endoplasmic reticulum stress in bladder cancer revealing the association with tumor immune microenvironment and prognosis.Front Genet. 2023 Apr 7;14:1097179. doi: 10.3389/fgene.2023.1097179. eCollection 2023. Front Genet. 2023. PMID: 37091788 Free PMC article.
References
-
- Divrik R. T., Yildirim U., Zorlu F., Ozen H. The effect of repeat transurethral resection on recurrence and progression rates in patients with T1 tumors of the bladder who received intravesical mitomycin: a prospective, randomized clinical trial. The Journal of Urology . 2006;175(5):1641–1644. doi: 10.1016/S0022-5347(05)01002-5. - DOI - PubMed
MeSH terms
LinkOut - more resources
Full Text Sources
Medical
Research Materials
