. 2022 Nov 15:13:1040999.
doi: 10.3389/fphar.2022.1040999. eCollection 2022.

Ponatinib modulates the metabolic profile of obese mice by inhibiting adipose tissue macrophage inflammation

Affiliations

Ponatinib modulates the metabolic profile of obese mice by inhibiting adipose tissue macrophage inflammation

Zhuomiao Lin et al. Front Pharmacol. .

Abstract

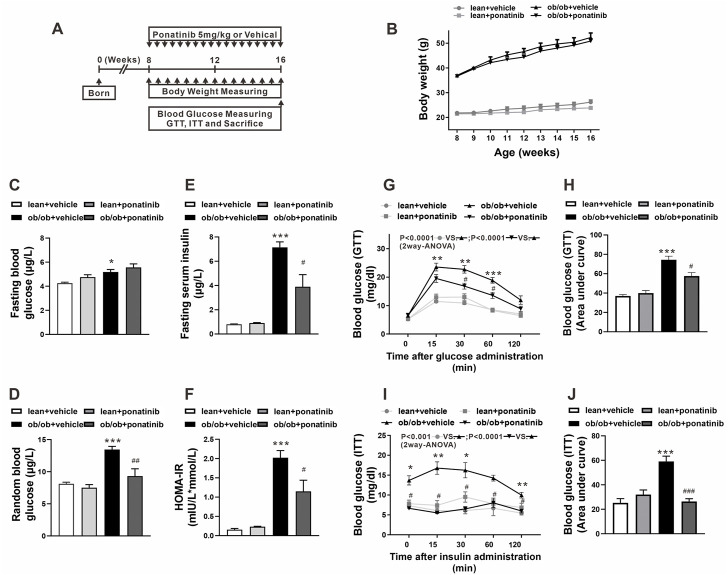
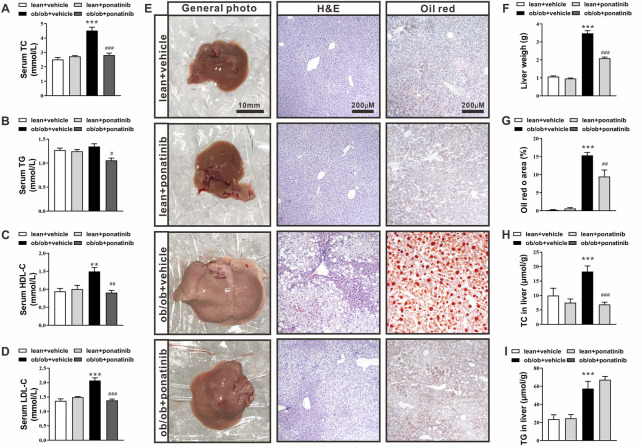
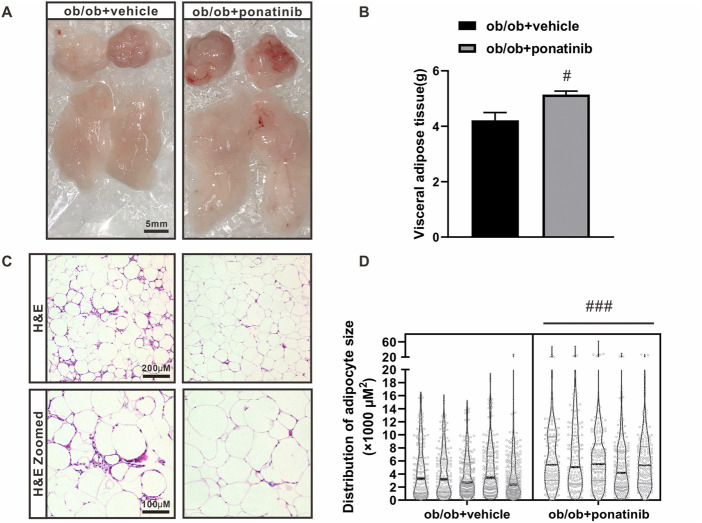
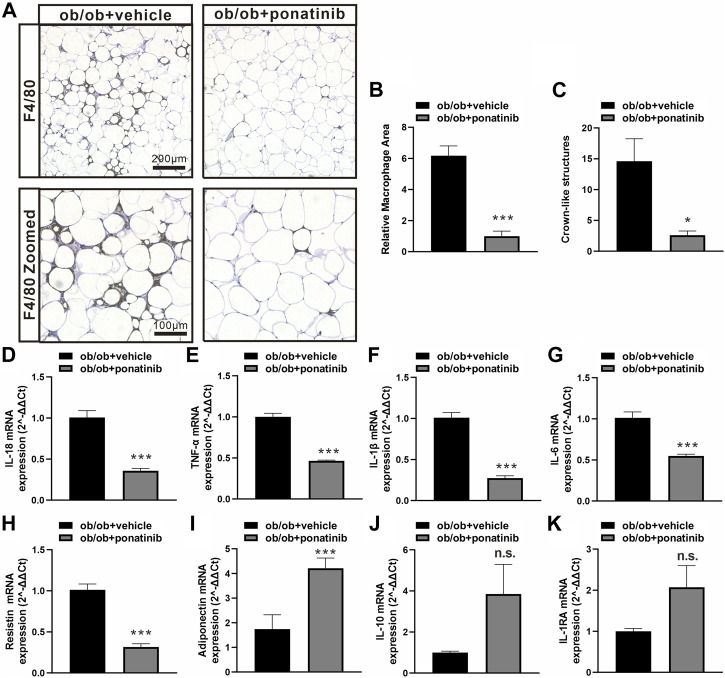
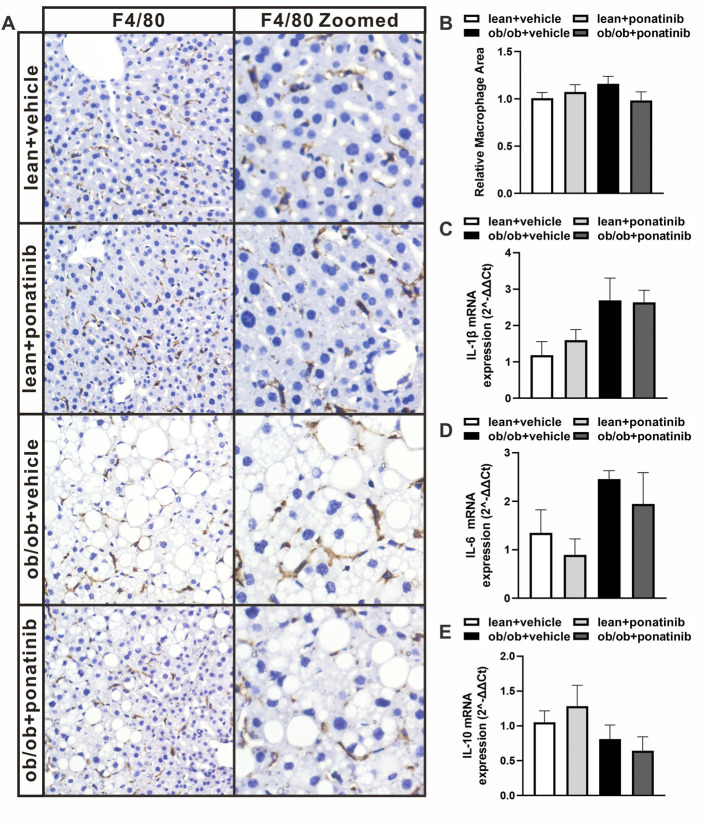
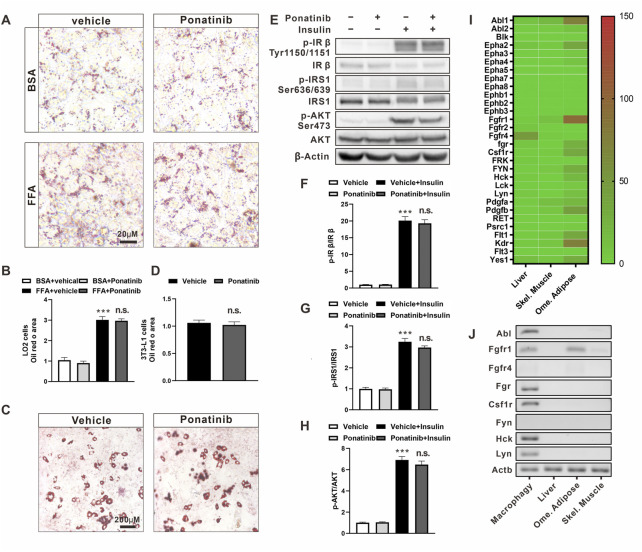
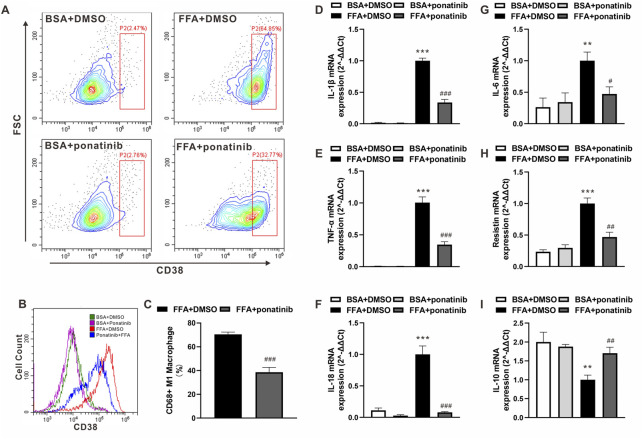
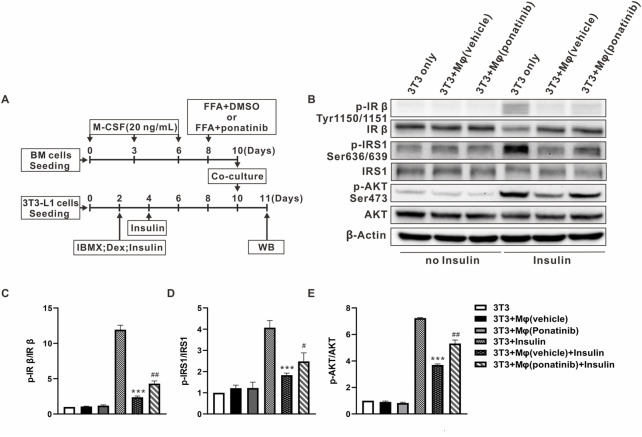
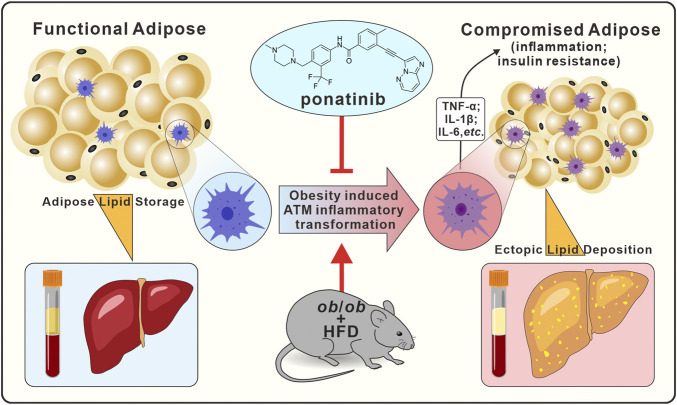
Obesity-induced metabolic syndrome is a rapidly growing conundrum, reaching epidemic proportions globally. Chronic inflammation in obese adipose tissue plays a key role in metabolic syndrome with a series of local and systemic effects such as inflammatory cell infiltration and inflammatory cytokine secretion. Adipose tissue macrophages (ATM), as one of the main regulators in this process, are particularly crucial for pharmacological studies on obesity-related metabolic syndrome. Ponatinib, a multi-targeted tyrosine kinase inhibitor originally used to treat leukemia, has recently been found to improve dyslipidemia and atherosclerosis, suggesting that it may have profound effect on metabolic syndrome, although the mechanisms underlying have not yet been revealed. Here we discovered that ponatinib significantly improved insulin sensitivity in leptin deficient obese mice. In addition to that, ponatinib treatment remarkably ameliorated high fat diet-induced hyperlipidemia and inhibited ectopic lipid deposition in the liver. Interestingly, although ponatinib did not reduce but increase the weight of white adipose tissue (WAT), it remarkably suppressed the inflammatory response in WAT and preserved its function. Mechanistically, we showed that ponatinib had no direct effect on hepatocyte or adipocyte but attenuated free fatty acid (FFA) induced macrophage transformation from pro-inflammatory to anti-inflammatory phenotype. Moreover, adipocytes co-cultured with FFA-treated macrophages exhibited insulin resistance, while pre-treat these macrophages with ponatinib can ameliorate this process. These results suggested that the beneficial effects of ponatinib on metabolic disorders are achieved by inhibiting the inflammatory phenotypic transformation of ATMs, thereby maintaining the physiological function of adipose tissue under excessive obesity. The data here not only revealed the novel therapeutic function of ponatinib, but also provided a theoretical basis for the application of multi-target tyrosine kinase inhibitors in metabolic diseases.

Keywords: adipose tissue macrophages; metabolic dysfunction; obesity; ponatinib; tyrosine kinase inhibitors.


Conflict of interest statement

The authors declare that the research was conducted in the absence of any commercial or financial relationships that could be construed as a potential conflict of interest.

Figures

FIGURE 1
FIGURE 1
Ponatinib improved insulin resistance in ob/ob mice (A) Schematic diagram of experimental protocol for studying the effect of ponatinib in ob/ob mice and lean mice. (B) Body weight of ob/ob mice and the lean mice after administration with or without ponatinib. n = 5. (C–F) Fasting blood glucose (C), random blood glucose (D), fasting serum insulin (E) and HOMA-IR index (F) of ob/ob and lean mice with or without ponatinib. n = 5. (G–J) GTT (G) and ITT (I) performed on ob/ob mice and lean mice after 8-week administration with or without ponatinib. Blood glucose area under the curve (H–J) measured from G and I. n = 5. Statistical comparisons were performed with RM two-way ANOVA with Bonferroni’s multiple comparisons test. (G–I) and one-way ANOVA (B–J) followed by Bonferroni’s multiple comparisons post hoc test. Data represent mean ± SEM. *p < 0.05, **p < 0.01, ***p < 0.001 vs. lean + vehicle. #p < 0.05, ##p < 0.01, ###p < 0.001 vs. ob/ob + vehicle.
FIGURE 2
FIGURE 2
Ponatinib improved lipid ectopic deposition in ob/ob mice (A–D) Serum TC (A), TG (B), HDL (C), LDL (D) of ob/ob mice and lean mice treated with or without ponatinib. n = 5. (E) Representative images of liver, HE and Oil Red O staining of livers tissues from ob/ob mice and lean mice with or without ponatinib. n = 5. Scale bar,10 mm, 200 μm. (F) Liver weight in ob/ob mice and control mice treated with ponatinib or vehicle. n = 5. (G) Quantification of oil red area from (E) (H–I) Liver TC (H), TG (I) levels in ob/ob mice or lean mice administrated with ponatinib or vehicle. n = 5. Statistical comparisons were performed with one-way ANOVA (A–D) (F–I) followed by Bonferroni’s multiple comparisons post hoc test. Data represent mean ± SEM. **p < 0.01, ***p < 0.001 vs. lean + vehicle. #p < 0.05, ##p < 0.01, ###p < 0.001 vs. ob/ob + vehicle.
FIGURE 3
FIGURE 3
The lipid storage function of adipose tissue in ob/ob mice was retained by ponatinib (A) The visceral white adipose tissue of ob/ob mice in ponatinib group or vehicle group. n = 5. Scale bar, 5 mm. (B) Weight of visceral white adipose tissue of ob/ob mice treated with or without ponatinib. n = 5. (C) Representative images of HE staining of visceral white adipose tissue of ob/ob mice in ponatinib group or vehicle group. n = 5. Scale bar, 100 μm and 200 μm. (D) Analyzation of adipocyte size in (C) n = 5. Statistical comparisons were performed with unpaired two-tailed Student’s t-test (B–D). Data represent mean ± SEM. # p < 0.05, ### p < 0.001vs. ob/ob + vehicle.
FIGURE 4
FIGURE 4
Ponatinib inhibited macrophage infiltration and cytokine expression in adipose tissue (A) Representative image of F4/80 immunostaining of visceral adipose sections of ob/ob mice in ponatinib group and control group. n = 5. Scale bar, 100 μm and 200 μm (B) Quantification of relative macrophage from (A) n = 5 (C) Quantitative analysis of crown-like structures from (A) n = 5. (D–K) mRNA levels of gene associated with inflammatory response in visceral adipose tissue of ob/ob mice treated with ponatinib or vehicle. n = 4. Statistical comparisons were performed with unpaired two-tailed Student’s t-test (B–K). Data represent mean ± SEM. n.s. p > 0.05, * p < 0.05, *** p < 0.001 vs. ob/ob + vehicle.
FIGURE 5
FIGURE 5
Ob/ob mice and lean mice had similar macrophage infiltration and inflammatory factor levels in liver with or without ponatinib. (A) Representative image of F4/80 immunostaining of liver sections of ob/ob mice and lean mice administrated with ponatinib or vehicle. n = 5. (B) Relative macrophage area of each group from (A) n = 5. (C–E) IL-1β, IL-6, and IL-10 mRNA transcription from liver of ob/ob mice and lean mice treated with or without ponatinib measured by qPCR. n = 5. Statistical comparisons were performed with one-way ANOVA (B–D) followed by Bonferroni’s multiple comparisons post hoc test. Data represent mean ± SEM.
FIGURE 6
FIGURE 6
The metabolic profile of hepatocytes and adipocytes was not directly affected by ponatinib. (A) Representative Oil Red O staining of LO2 cells administrated with ponatinib or vehicle after FFA or BSA stimulation for 24 h n = 6. Scale bar, 20 μm (B) Quantitative analysis of oil red area of LO2 cells in (A). Statistical comparisons were performed with one-way ANOVA followed by Bonferroni’s multiple comparisons post hoc test. Data represent mean ± SEM, ***p < 0.001 vs. BSA + vehical; n. s. p > 0.05 vs. FFA + Vehicle. (C) Representative Oil Red O staining of 3T3-L1 adipocytes treated with ponatinib or vehicle. n = 6. Scale bar, 200 μm (D) Quantitative analysis of oil red area of 3T3-L1 adipocytes in (C). n = 6. Statistical comparisons were performed with unpaired two-tailed Student’s t-test, Data represent mean ± SEM, n. s. p > 0.05 vs. Vehicle. (E) Representative western blot showing levels of total and phosphorylation of IR-β (Tyr1150/1151), IRS1(Ser636/639), AKT (Ser473) of 3T3-L1 adipocytes in response to insulin stimulation for 30 min with or without ponatinib treatment. n = 4. (F–H) Quantification of phosphorylation of IR-β (Tyr1150/1151), IRS1 (Ser636/639), AKT (Ser473) expression level in (E). n = 4. Statistical comparisons were performed with one-way ANOVA followed by Bonferroni’s multiple comparisons post hoc test. Data represent mean ± SEM, ***p < 0.001 vs. Vehical; n. s. p > 0.05 vs. Vehicle + Insulin. (I) The expression profile of ponatinib’s high-affinity targets in liver, skeletal muscle and omentum adipose from Genotype-Tissue Expression (GTEx) Project. Color scale indicates mean TPM (transcripts per million) value. (J) Representative electropherogram of one of six mice qPCR products to verify FGR, HCK, Lyn, CSFR, Fyn, FGFR, and ABL mRNA expression levels in BMDM, visceral fat, liver, and skeletal muscle.
FIGURE 7
FIGURE 7
Ponatinib attenuated FFA induced Inflammatory phenotypic transformation of macrophages. (A) Flow cytometry analysis of the distribution of CD38 in BMDM cultured with FFA or BSA after treated with ponatinib or vehicle. (B) Representative overlayed histogram in (A) (C) Analysis of CD38 positive M1 macrophage ratio after FFA treatment in (A) n = 6. (D–I) mRNA levels of gene associated with inflammatory response in FFA treated BMDMs with or without ponatinib. n = 4. Statistical comparisons were performed with unpaired two-tailed Student’s t-test (C) or one-way ANOVA (D–I) followed by Bonferroni’s multiple comparisons post hoc test. Data represent mean ± SEM, **p < 0.01, ***p < 0.001 vs. BSA + DMSO. # p < 0.05, ## p < 0.01, ### p < 0.001 vs.FFA + DMSO.
FIGURE 8
FIGURE 8
Insulin sensitivity of adipocytes co-cultured with macrophages was protected by ponatinib. (A) Schematic diagram of experimental design for studying the effect of ponatinib in insulin sensitivity of adipocytes co-cultured with macrophages. (B) Representative western blot showing levels of total and phosphorylation of IR-β (Tyr1150/1151), IRS1(Ser636/639), AKT (Ser473) of adipocytes co-cultured with macrophages in response to insulin for 30 min with or without ponatinib treatment. n = 4. (C–E) Quantification of phosphorylation of IR-β (Tyr1150/1151), IRS1(Ser636/639), AKT (Ser473) expression level in (B) n = 4. Statistical comparisons were carried out with one-way ANOVA (C–E) followed by Bonferroni’s multiple comparisons post hoc test. Data represent mean ± SEM, ***p < 0.001 vs. 3T3+Insulin. # p < 0.05, ## p < 0.01 vs. 3T3+Mφ(vehicle)+Insulin.
FIGURE 9
FIGURE 9
Graphical abstract. In ob/ob mice model, ponatinib inhibits obesity-induced adipose tissue macrophage inflammatory transformation, thereby inhibiting obesity adipose tissue inflammation and insulin resistance, accompanied by amelioration of ectopic lipid deposition in peripheral blood and liver.

References

    1. Acín-Pérez R., Iborra S., Martí-Mateos Y., Cook E. C. L., Conde-Garrosa R., Petcherski A., et al. (2020). Fgr kinase is required for proinflammatory macrophage activation during diet-induced obesity. Nat. Metab. 2 (9), 974–988. 10.1038/s42255-020-00273-8 - DOI - PMC - PubMed
    1. Appleton S. L., Seaborn C. J., Visvanathan R., Hill C. L., Gill T. K., Taylor A. W., et al. (2013). Diabetes and cardiovascular disease outcomes in the metabolically healthy obese phenotype: A cohort study. Diabetes Care 36 (8), 2388–2394. 10.2337/dc12-1971 - DOI - PMC - PubMed
    1. Burhans M. S., Hagman D. K., Kuzma J. N., Schmidt K. A., Kratz M. (2018). Contribution of adipose tissue inflammation to the development of type 2 diabetes mellitus. Compr. Physiol. 9 (1), 1–58. 10.1002/cphy.c170040 - DOI - PMC - PubMed
    1. Choi J. P., Wang R., Yang X., Wang X., Wang L., Ting K. K., et al. (2018). Ponatinib (AP24534) inhibits MEKK3-KLF signaling and prevents formation and progression of cerebral cavernous malformations. Sci. Adv. 4 (11), eaau0731. 10.1126/sciadv.aau0731 - DOI - PMC - PubMed
    1. Cinti S., Mitchell G., Barbatelli G., Murano I., Ceresi E., Faloia E., et al. (2005). Adipocyte death defines macrophage localization and function in adipose tissue of obese mice and humans. J. Lipid Res. 46 (11), 2347–2355. 10.1194/jlr.M500294-JLR200 - DOI - PubMed