

HRQoL and nutritional well-being dissimilarities between two different online collection methods: Value for digital health implementation
- PMID: 36457811
- PMCID: PMC9706066
- DOI: 10.1177/20552076221138316
HRQoL and nutritional well-being dissimilarities between two different online collection methods: Value for digital health implementation
Abstract
Background: Online health data collection has gained a reputation over the last years to record and process information about health issues for implementing digital health.
Objective: The research aim was to appraise two online methods (open and rewarded) to collect information about HRQoL and nutritional well-being and to compare the results between both surveyed populations.
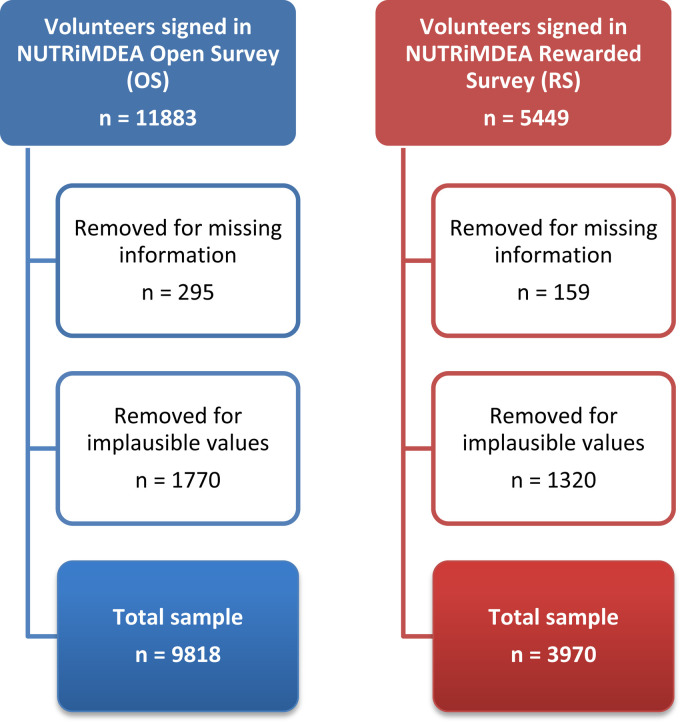
Methods: This cross-sectional study is framed on the NUTRiMDEA project. Online data through two different web-based methods (open survey and rewarded survey) were retrieved to assemble data related to sociodemographic, lifestyle (diet, physical activity and sleep patterns) and general health aspects, as well as HRQoL by an evidence-based form such as the SF-12 questionnaire, the IPAQ survey, and MEDAS-14, participants were adults (>18 years old).
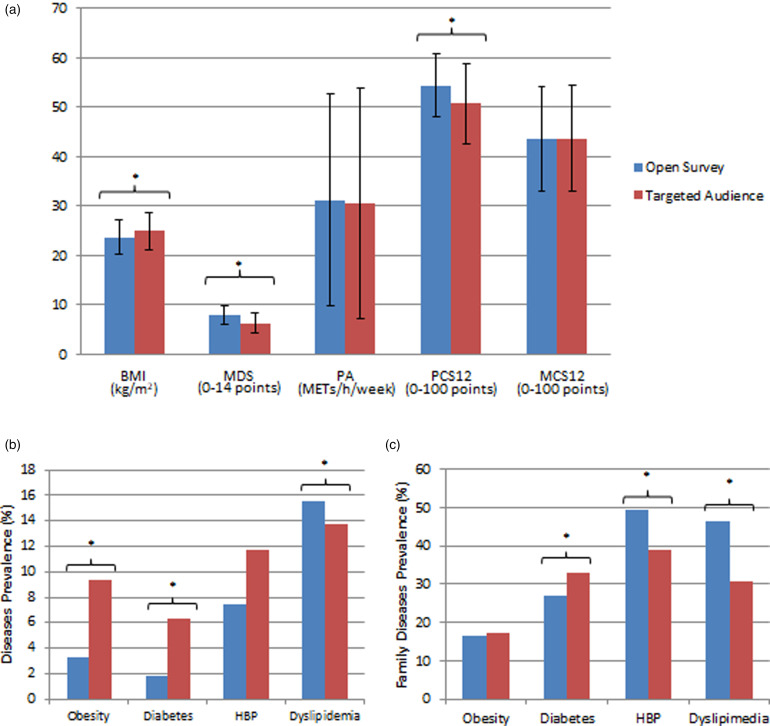
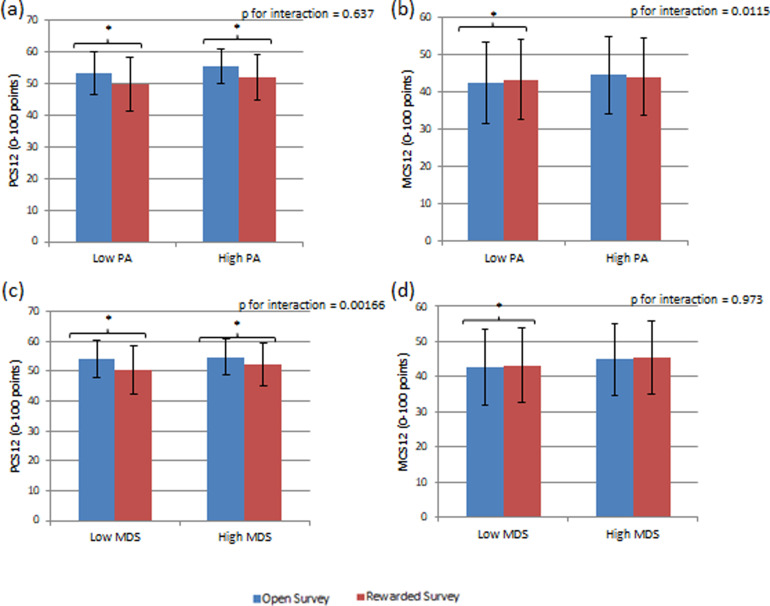
Results: Overall, 17,332 participants responded to the open survey (OS, n = 11,883) or the rewarded survey (RS, n = 5449). About 65.1% of the participants were female, while the mean age was in the range of 40-70 years. There were significant differences (p < 0.05) between surveyed populations in sociodemographic, lifestyle (diet and physical activity), health and HRQoL data.
Conclusions: This investigation implemented an evidence-based online questionnaire that collected demographic, lifestyle factors, phenotypic and health-related aspects as well as compared differential outcomes in HRQoL and nutritional/lifestyle well-being depending on the online mode data collection. Findings demonstrated dissimilarities in most aspects of health, HRQoL, dietary intake and physical activity records between both populations. Overall, OS sample was characterized as a healthier population with superior lifestyle habits than RS participants.
Keywords: Online data collection; digital health; eHealth; health-related quality of life; nutritional well-being; web-based health.
© The Author(s) 2022.
Conflict of interest statement
The author(s) declared no potential conflicts of interest with respect to the research, authorship, and/or publication of this article.
Figures
Similar articles
-
Lifestyle and Health-Related Quality of Life Relationships Concerning Metabolic Disease Phenotypes on the Nutrimdea Online Cohort.Int J Environ Res Public Health. 2022 Dec 31;20(1):767. doi: 10.3390/ijerph20010767. Int J Environ Res Public Health. 2022. PMID: 36613089 Free PMC article.
-
Cardiometabolic Health Status, Ethnicity and Health-Related Quality of Life (HRQoL) Disparities in an Adult Population: NutrIMDEA Observational Web-Based Study.Int J Environ Res Public Health. 2022 Mar 3;19(5):2948. doi: 10.3390/ijerph19052948. Int J Environ Res Public Health. 2022. PMID: 35270641 Free PMC article.
-
Comparison of Seven Healthy Lifestyle Scores Cardiometabolic Health: Age, Sex, and Lifestyle Interactions in the NutrIMDEA Web-Based Study.J Epidemiol Glob Health. 2023 Dec;13(4):653-663. doi: 10.1007/s44197-023-00140-1. Epub 2023 Aug 27. J Epidemiol Glob Health. 2023. PMID: 37634195 Free PMC article.
-
Relationship between multiple lifestyle behaviors and health-related quality of life among elderly individuals with prediabetes in rural communities in China: A STROBE-compliant article.Medicine (Baltimore). 2020 Apr;99(15):e19560. doi: 10.1097/MD.0000000000019560. Medicine (Baltimore). 2020. PMID: 32282705 Free PMC article.
-
Lifestyle and Sociodemographic Parameters Associated with Mental and Physical Health during COVID-19 Confinement in Three Ibero-American Countries. A Cross-Sectional Pilot Study.Int J Environ Res Public Health. 2021 May 19;18(10):5450. doi: 10.3390/ijerph18105450. Int J Environ Res Public Health. 2021. PMID: 34069747 Free PMC article.
Cited by
-
Nutritional and Lifestyle Features in a Mediterranean Cohort: An Epidemiological Instrument for Categorizing Metabotypes Based on a Computational Algorithm.Medicina (Kaunas). 2024 Apr 8;60(4):610. doi: 10.3390/medicina60040610. Medicina (Kaunas). 2024. PMID: 38674256 Free PMC article.
-
Computational algorithm based on health and lifestyle traits to categorize lifemetabotypes in the NUTRiMDEA cohort.Sci Rep. 2024 Oct 22;14(1):24835. doi: 10.1038/s41598-024-75110-z. Sci Rep. 2024. PMID: 39438551 Free PMC article.
-
Lifestyle and Health-Related Quality of Life Relationships Concerning Metabolic Disease Phenotypes on the Nutrimdea Online Cohort.Int J Environ Res Public Health. 2022 Dec 31;20(1):767. doi: 10.3390/ijerph20010767. Int J Environ Res Public Health. 2022. PMID: 36613089 Free PMC article.
-
Reciprocal and Differential Influences of Mediterranean Diet and Physical Activity on Adiposity in a Cohort of Young and Older than 40 Years Adults.Nutrients. 2024 Jun 5;16(11):1777. doi: 10.3390/nu16111777. Nutrients. 2024. PMID: 38892710 Free PMC article.
-
Influence of Socio-Demographic, Occupational and Lifestyle Variables on Sleep Time.Nat Sci Sleep. 2025 Jan 30;17:195-210. doi: 10.2147/NSS.S495455. eCollection 2025. Nat Sci Sleep. 2025. PMID: 39963101 Free PMC article.
References
-
- Graham H, White PC. Social determinants and lifestyles: integrating environmental and public health perspectives. Public Health 2016; 141: 270–278. - PubMed
-
- Karimi M, Brazier J. Health, health-related quality of life, and quality of life: what is the difference? Pharmacoeconomics 2016; 34: 645–649. - PubMed
-
- The world health organization quality of life assessment (WHOQOL): position paper from the world health organization. Soc Sci Med 1995; 41: 1403–1409. - PubMed
LinkOut - more resources
Full Text Sources
