Effects of Standardized Brazilian Green Propolis Extract (EPP-AF®) on Inflammation in Haemodialysis Patients: A Clinical Trial
- PMID: 36457860
- PMCID: PMC9708369
- DOI: 10.1155/2022/1035475
Effects of Standardized Brazilian Green Propolis Extract (EPP-AF®) on Inflammation in Haemodialysis Patients: A Clinical Trial
Abstract
Background: Patients on haemodialysis (HD) present a significant inflammatory status, which has a pronounced negative impact on their outcomes. Propolis is a natural resin with anti-inflammatory and immunomodulatory properties. We assessed the safety and impact of a standardized Brazilian green propolis extract (EPP-AF®) on the inflammatory status in patients under conventional HD.
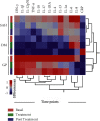
Methods: Patients were assigned to receive 200 mg/day of EPP-AF® for 4 weeks followed by 4 weeks without the drug, and changes in plasma levels of interleukins (ILs), interferon gamma (IFN-γ), tumour necrosis factor-alpha (TNF-α), and high-sensitivityc-reactive protein (HsCRP) were measured. A heatmap was used to illustrate trends in data variation.
Results: In total, 37 patients were included in the final analysis. Patients presented an exacerbated inflammatory state at baseline. During EPP-AF® use, there was a significant reduction in IFN-γ (p=0.005), IL-13 (p=0.04 2), IL-17 (p=0.039), IL-1ra (p=0.008), IL-8 (p=0.009), and TNF-α (p < 0.001) levels compared to baseline, and significant changes were found in Hs-CRP levels. The heatmap demonstrated a pattern of pronounced proinflammatory status at baseline, especially in patients with primary glomerulopathies, and a clear reduction in this pattern during the use of EPP-AF®. There was a tendency to maintain this reduction after suspension of EPP-AF®. No significant side effects were observed.
Conclusion: Patients under haemodialysis presented a pronounced inflammatory status, and EPP-AF® was demonstrated to be safe and associated with a significant and maintained reduction in proinflammatory cytokines in this population. This trial is registered with Clinicaltrials.gov NCT04072341.
Copyright © 2022 Marcelo Augusto Duarte Silveira et al.
Conflict of interest statement
Dr. Berretta is an employee of Apis Flora. Dr. Silveira and all the other authors, except for Dr. Teles, Dr. Berretta, Dr. Borges, Dr. Santos, and Dr. Silva, are employed by São Rafael Hospital, which is a part of the D'Or Institute for Research and Education.
Figures


References
-
- Levin A., Tonelli M., Bonventre J. Global kidney health 2017 and beyond: a roadmap for closing gaps in care, research, and policy. Lancet . 2017;390:1888–1917. - PubMed
Associated data
LinkOut - more resources
Full Text Sources
Medical
Research Materials
Miscellaneous

