

Analysis of T cell repertoires of CD45RO CD4 T cells in cohorts of patients with bullous pemphigoid: A pilot study
- PMID: 36458004
- PMCID: PMC9706093
- DOI: 10.3389/fimmu.2022.1006941
Analysis of T cell repertoires of CD45RO CD4 T cells in cohorts of patients with bullous pemphigoid: A pilot study
Abstract
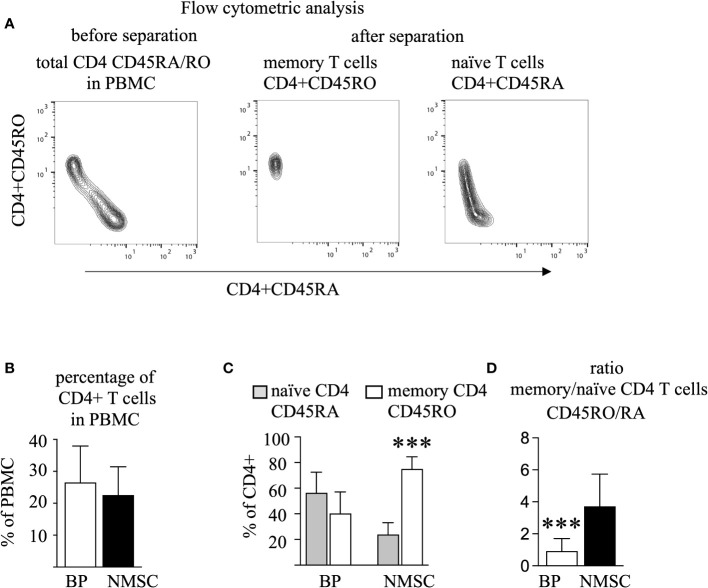
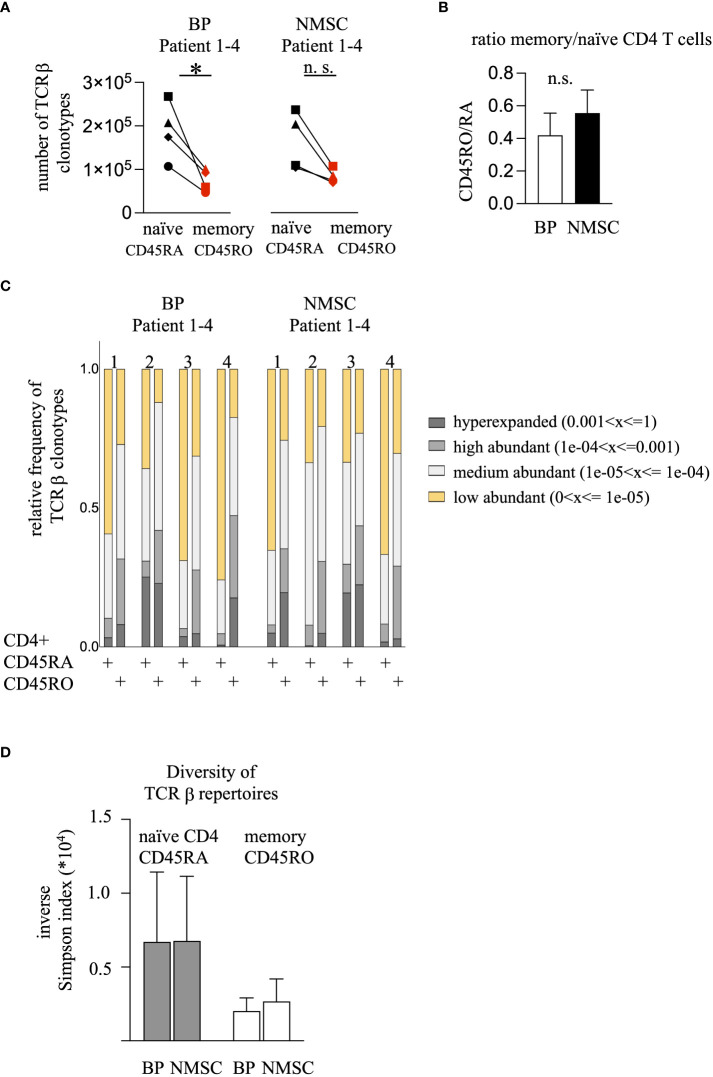
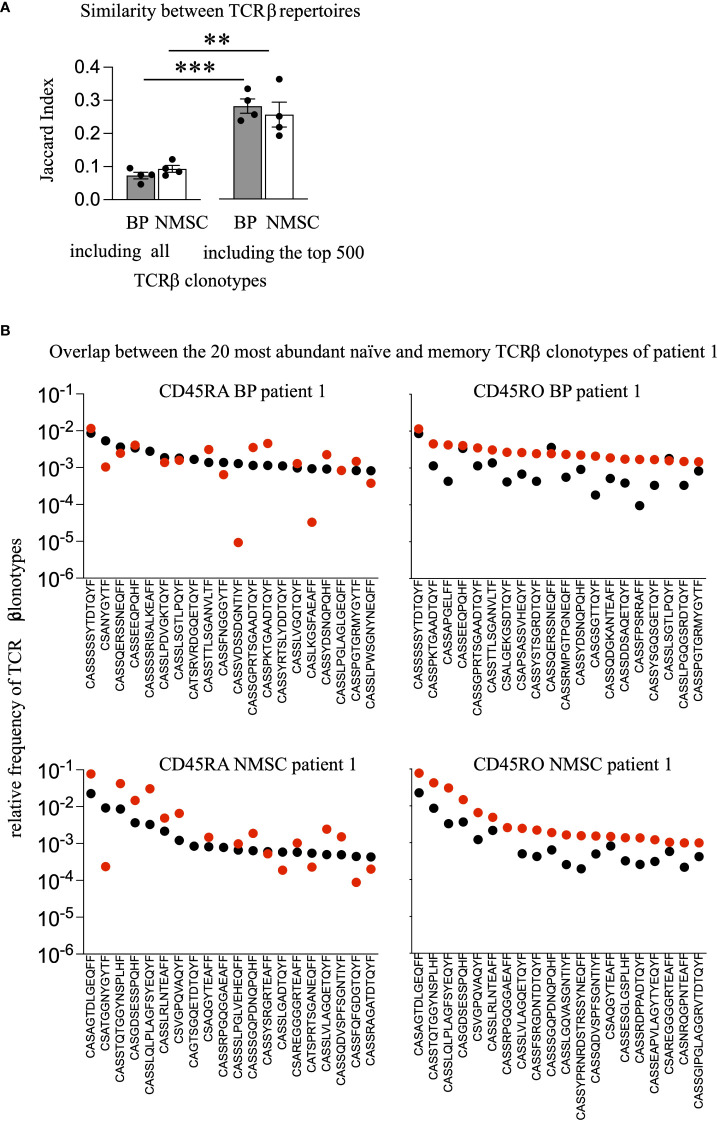
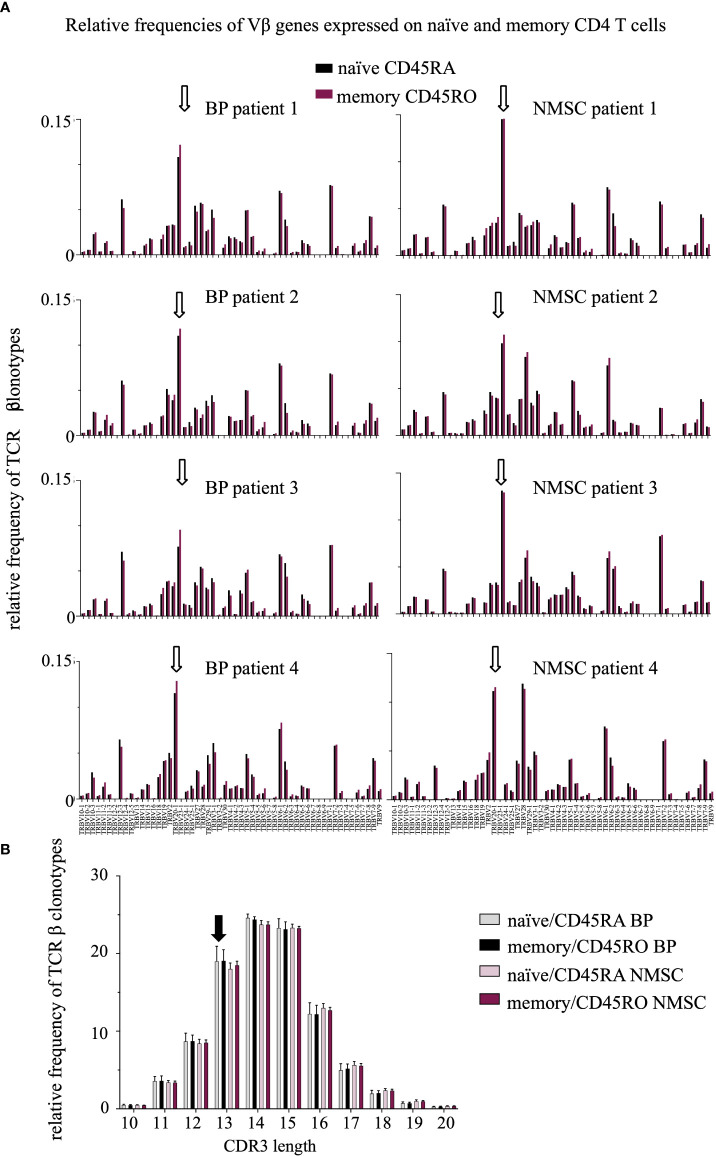
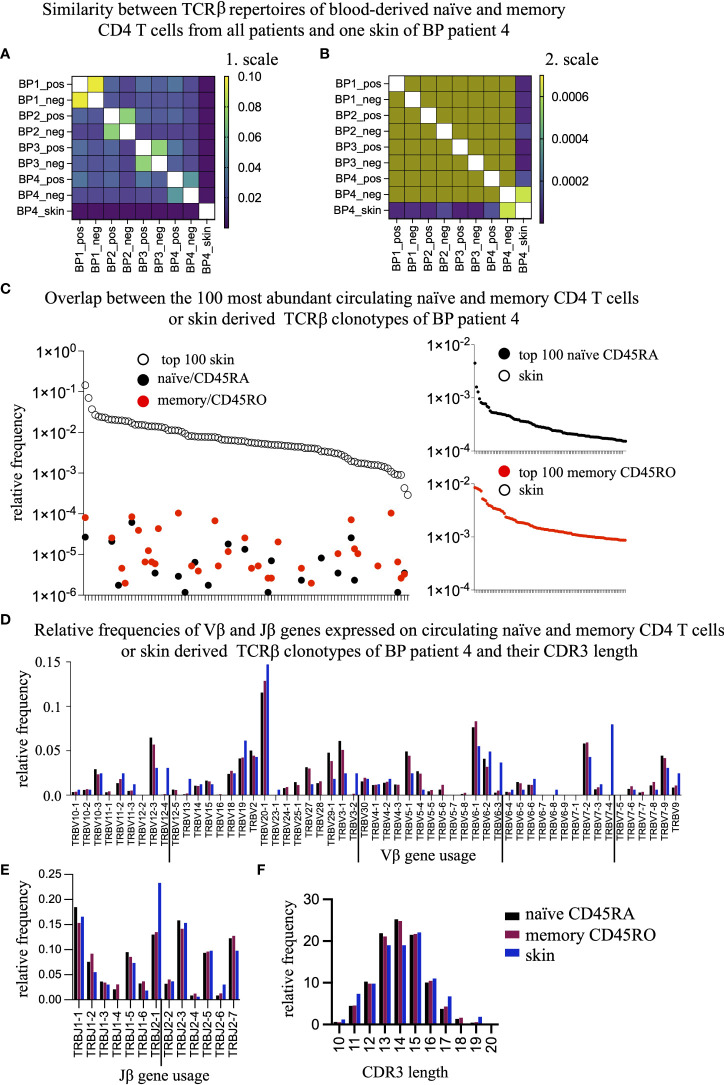
Autoimmune diseases develop over years - starting from a subclinical phenotype to clinically manifest autoimmune disease. The factors that drive this transition are ill-defined. To predict the turning point towards clinical disease and to intervene in the progress of autoimmune-mediated dysfunction, the establishment of new biomarkers is needed. Especially CD4 T cells are crucially involved in autoimmunity: first, during the initiation phase, because they lose their tolerance towards self-peptides, and second, by the subsequent ongoing presentation of self-peptides during the active autoimmune disease. Accordingly, changes in the degree of diversity of T cell receptor (TCR) repertoires in autoimmunity have been reported. These findings led to the hypothesis that transition from pre-disease to autoimmune disease is associated with an increase of abnormally expanded T cell clones that occupy large portions of the TCR repertoire. In this pilot study, we asked whether the ratio and the diversity of the TCR repertoires of circulating memory (CD45RO) and naïve (CD45RA) CD4 T cells could serve as a predictive factor for the development of autoimmunity. To find out, we analyzed the TCRβ repertoires of memory and naïve CD4 T cells in a small cohort of four gender- and age-matched elderly patients having the autoimmune blistering disease bullous pemphigoid or non-melanoma skin cancers. We found that the extent of clonal expansions in the TCRβ repertoires from the circulating memory and naïve CD4 populations did not differ between the patient groups. This result shows that the diversity of TCR repertoires from peripheral CD4 T cells does not reflect the manifestation of the skin-associated autoimmune disease BP and does not qualify as a prognostic factor. We propose that longitudinal TCR repertoire analysis of younger patients might be more informative.
Keywords: T cell receptor; autoimmunity; naive and memory CD4 T cells; next generation sequencing; repertoire diversity; skin diseases.
Copyright © 2022 Niebuhr, Bahreini, Fähnrich, Bomholt, Bieber, Schmidt, Ibrahim, Hammers and Kalies.
Conflict of interest statement
The authors declare that the research was conducted in the absence of any commercial or financial relationships that could be construed as a potential conflict of interest.
Figures
Similar articles
-
Longitudinal analysis of T-cell receptor repertoires reveals persistence of antigen-driven CD4+ and CD8+ T-cell clusters in systemic sclerosis.J Autoimmun. 2021 Feb;117:102574. doi: 10.1016/j.jaut.2020.102574. Epub 2020 Dec 8. J Autoimmun. 2021. PMID: 33307312
-
The TCR Repertoire Reconstitution in Multiple Sclerosis: Comparing One-Shot and Continuous Immunosuppressive Therapies.Front Immunol. 2020 Apr 9;11:559. doi: 10.3389/fimmu.2020.00559. eCollection 2020. Front Immunol. 2020. PMID: 32328061 Free PMC article.
-
T-cell receptor diversity is selectively skewed in T-cell populations of patients with Wiskott-Aldrich syndrome.J Allergy Clin Immunol. 2015 Jan;135(1):209-16. doi: 10.1016/j.jaci.2014.06.025. Epub 2014 Aug 1. J Allergy Clin Immunol. 2015. PMID: 25091438
-
Thymic commitment of regulatory T cells is a pathway of TCR-dependent selection that isolates repertoires undergoing positive or negative selection.Curr Top Microbiol Immunol. 2005;293:43-71. doi: 10.1007/3-540-27702-1_3. Curr Top Microbiol Immunol. 2005. PMID: 15981475 Review.
-
Understanding CD4+ T cells in autoimmune bullous diseases.Front Immunol. 2023 Apr 17;14:1161927. doi: 10.3389/fimmu.2023.1161927. eCollection 2023. Front Immunol. 2023. PMID: 37138879 Free PMC article. Review.
Cited by
-
Deep immunophenotyping of circulating immune cells in major depressive disorder patients reveals immune correlates of clinical course and treatment response.Brain Behav Immun Health. 2024 Dec 30;43:100942. doi: 10.1016/j.bbih.2024.100942. eCollection 2025 Feb. Brain Behav Immun Health. 2024. PMID: 39877852 Free PMC article.
-
In vitro encapsulation and expansion of T and CAR-T cells using 3D synthetic thermo-responsive matrices.RSC Adv. 2024 Apr 26;14(20):13734-13747. doi: 10.1039/d4ra01968g. eCollection 2024 Apr 25. RSC Adv. 2024. PMID: 38681842 Free PMC article.
-
Genetic and immunologic features associated with thrombocytopenia progression and poor prognosis in patients with myelofibrosis.Front Med (Lausanne). 2024 Nov 7;11:1461421. doi: 10.3389/fmed.2024.1461421. eCollection 2024. Front Med (Lausanne). 2024. PMID: 39574914 Free PMC article.
References
Publication types
MeSH terms
Substances
LinkOut - more resources
Full Text Sources
Medical
Research Materials