. 2022 Nov 15:13:935800.
doi: 10.3389/fimmu.2022.935800. eCollection 2022.

SRSF1 acts as an IFN-I-regulated cellular dependency factor decisively affecting HIV-1 post-integration steps

Affiliations

SRSF1 acts as an IFN-I-regulated cellular dependency factor decisively affecting HIV-1 post-integration steps

Helene Sertznig et al. Front Immunol. .

Abstract

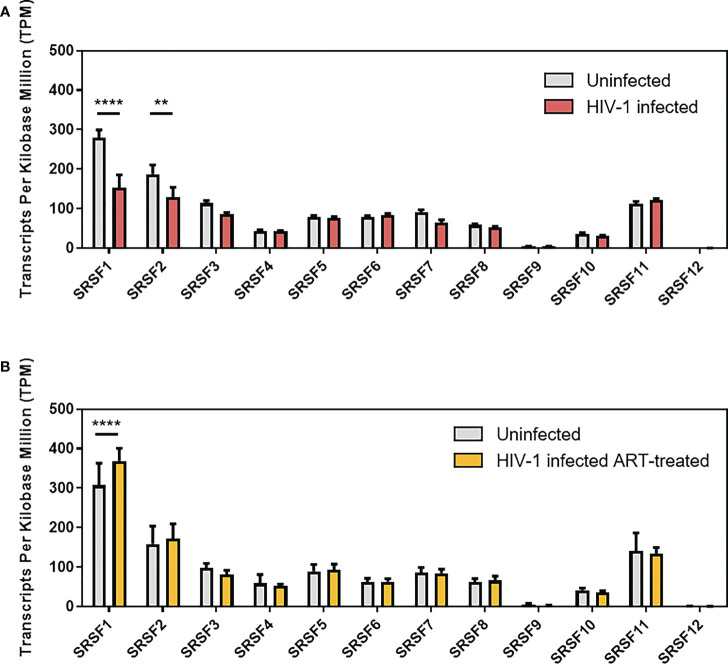
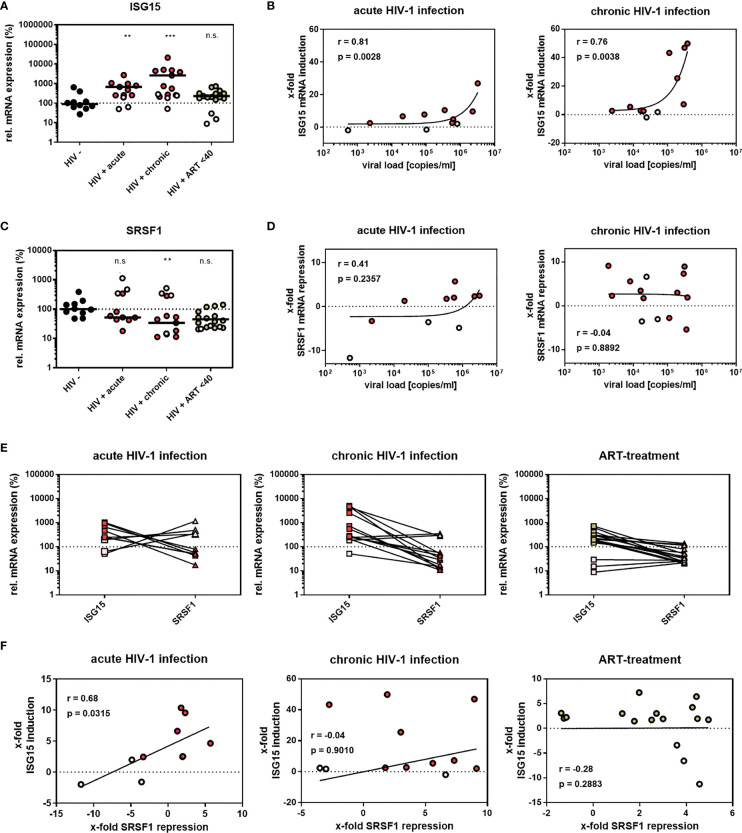
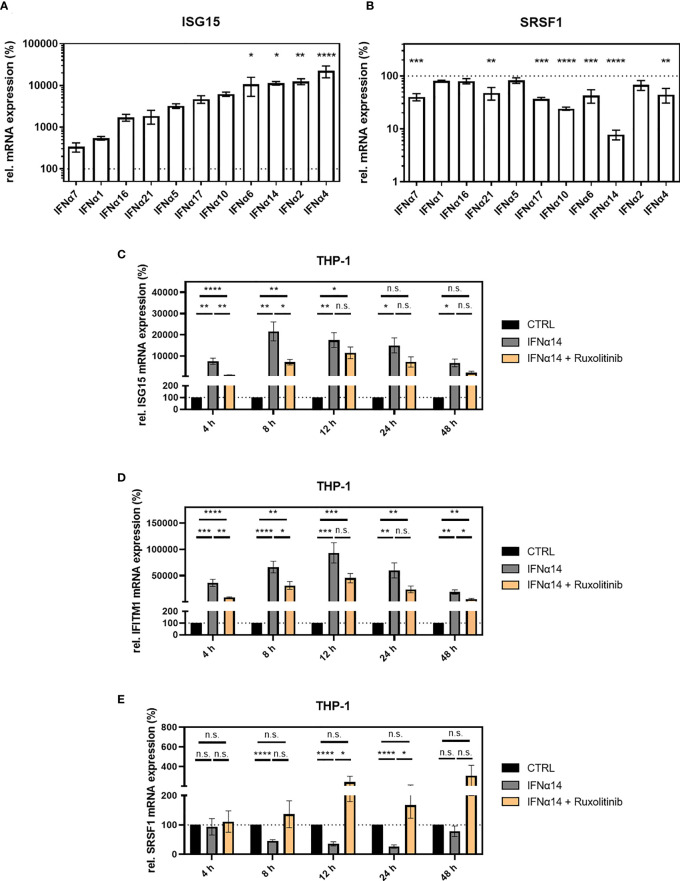
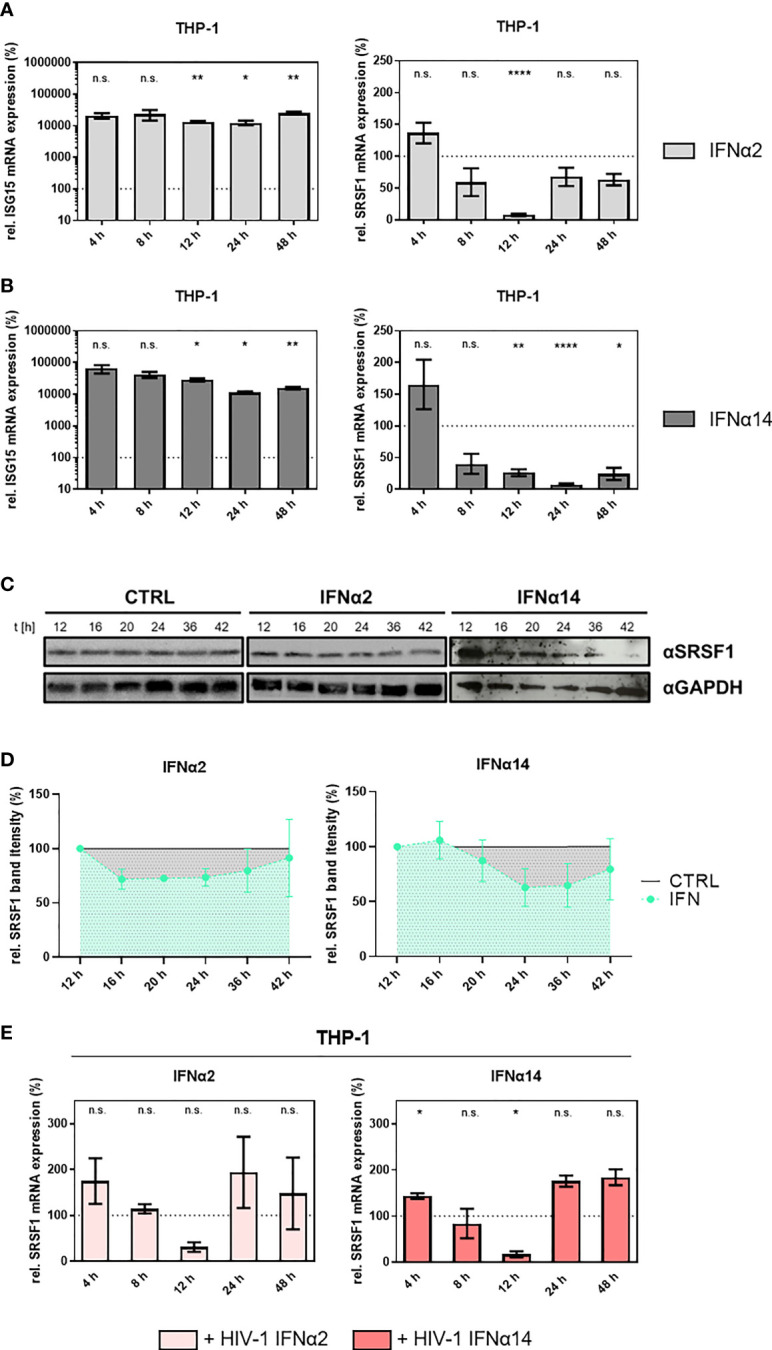
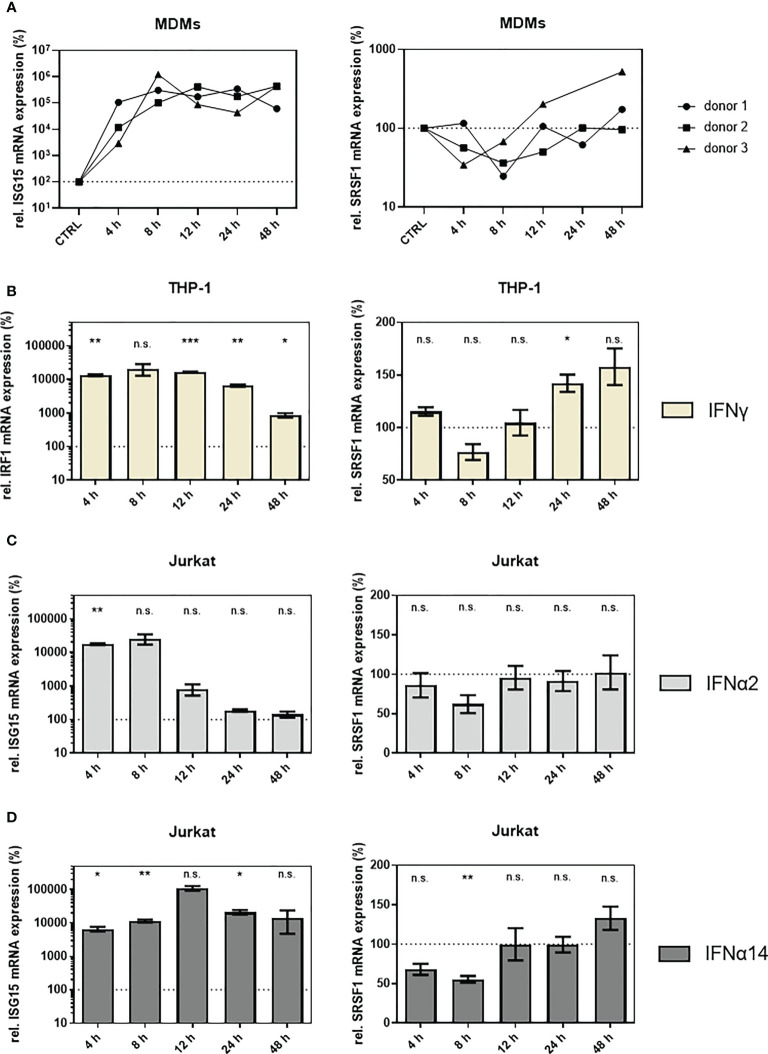
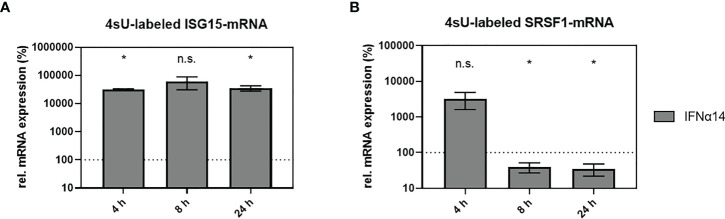
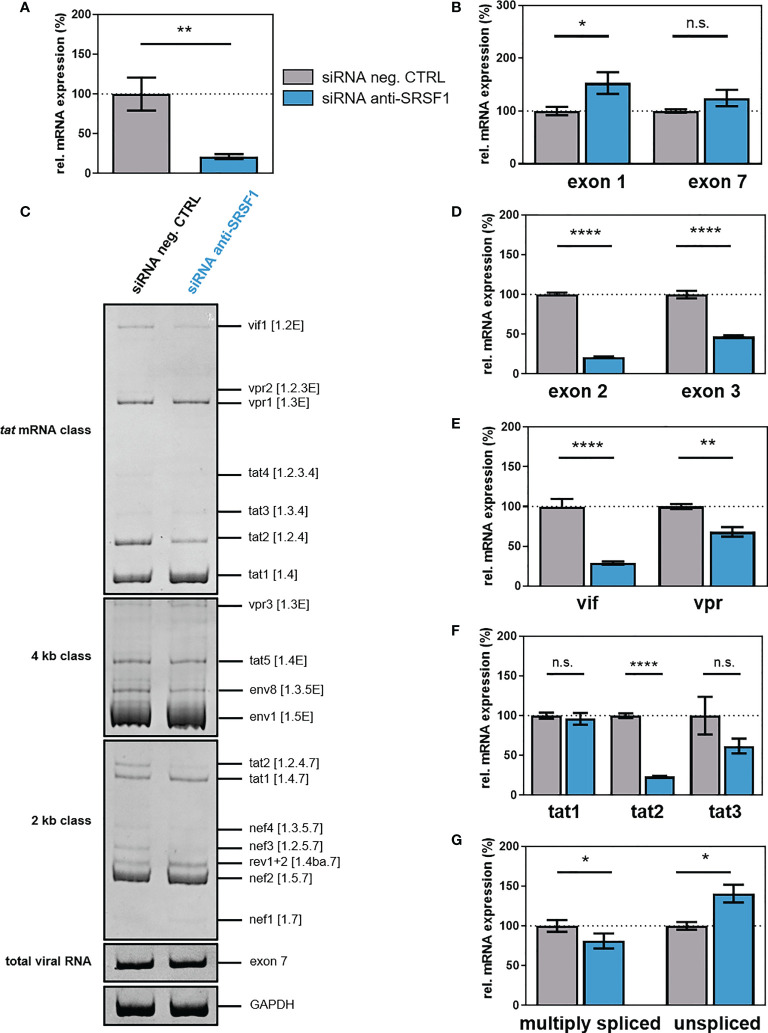
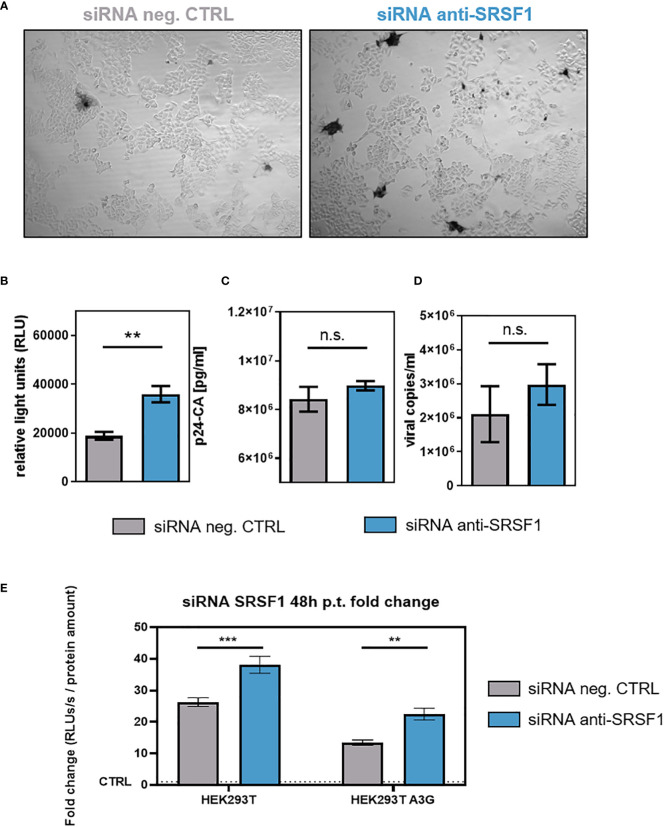
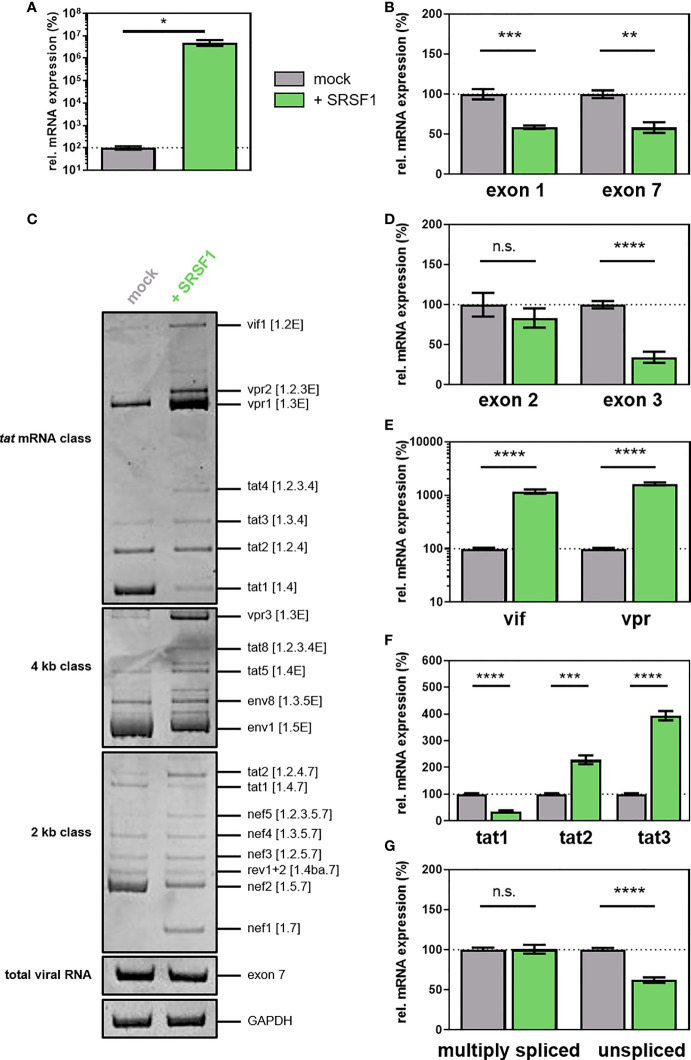
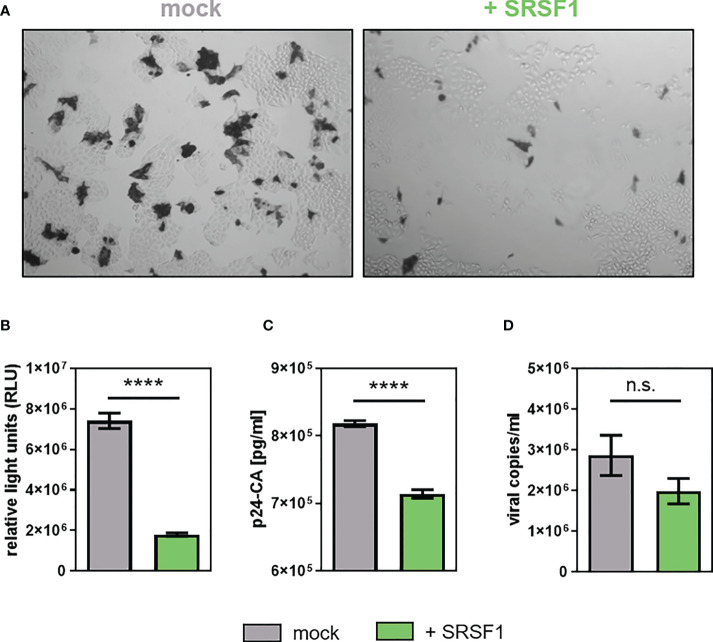
Efficient HIV-1 replication depends on balanced levels of host cell components including cellular splicing factors as the family of serine/arginine-rich splicing factors (SRSF, 1-10). Type I interferons (IFN-I) play a crucial role in the innate immunity against HIV-1 by inducing the expression of IFN-stimulated genes (ISGs) including potent host restriction factors. The less well known IFN-repressed genes (IRepGs) might additionally affect viral replication by downregulating host dependency factors that are essential for the viral life cycle; however, so far, the knowledge about IRepGs involved in HIV-1 infection is very limited. In this work, we could demonstrate that HIV-1 infection and the associated ISG induction correlated with low SRSF1 levels in intestinal lamina propria mononuclear cells (LPMCs) and peripheral blood mononuclear cells (PBMCs) during acute and chronic HIV-1 infection. In HIV-1-susceptible cell lines as well as primary monocyte-derived macrophages (MDMs), expression levels of SRSF1 were transiently repressed upon treatment with specific IFNα subtypes in vitro. Mechanically, 4sU labeling of newly transcribed mRNAs revealed that IFN-mediated SRSF1 repression is regulated on early RNA level. SRSF1 knockdown led to an increase in total viral RNA levels, but the relative proportion of the HIV-1 viral infectivity factor (Vif) coding transcripts, which is essential to counteract APOBEC3G-mediated host restriction, was significantly reduced. In the presence of high APOBEC3G levels, however, increased LTR activity upon SRSF1 knockdown facilitated the overall replication, despite decreased vif mRNA levels. In contrast, SRSF1 overexpression significantly impaired HIV-1 post-integration steps including LTR transcription, alternative splice site usage, and virus particle production. Since balanced SRSF1 levels are crucial for efficient viral replication, our data highlight the so far undescribed role of SRSF1 acting as an IFN-modulated cellular dependency factor decisively regulating HIV-1 post-integration steps.

Keywords: HIV-1; ISG (interferon stimulated genes); SF2/ASF; SRSF1; alternative splicing; interferon; repressed genes; transcription.


Conflict of interest statement

The authors declare that the research was conducted in the absence of any commercial or financial relationships that could be construed as a potential conflict of interest.

Figures

Figure 1
Figure 1
Gene expression levels of SRSFs in treatment-naïve or ART-treated HIV-1-infected individuals. Transcript levels of SRSF genes were measured in lamina propria mononuclear cells (LPMCs) from the gut using RNA-sequencing analysis ( Supplementary Table 1 ). Comparison of transcript levels from (A) treatment-naïve HIV-1-infected and healthy individuals and (B) ART-treated HIV-1-infected and healthy individuals. TPM are depicted as mean (+ SD) for (A) 19 HIV-1-infected and 13 uninfected individuals and (B) 14 ART-treated and 11 uninfected individuals. Groups were compared with two-way ANOVA with Bonferroni post-hoc test (**p < 0.01, and ****p < 0.0001).
Figure 2
Figure 2
SRSF1 and ISG15 expression levels inversely correlate upon HIV-1 infection. (A, C) RT-qPCR determined the relative mRNA expression levels of (A) ISG15 and (C) SRSF1 in PBMCs from acutely and chronically HIV-1-infected patients, either naïve or under ART treatment as well as healthy donors. ACTB was used for normalization. Kruskal–Wallis test with the Dunn’s post-hoc multiple comparisons test was used to determine whether the difference between the group of samples reached the level of statistical significance (**p < 0.01, ***p < 0.001 and ns, not significant). (B, D) Correlation between plasma viral load of HIV-1-infected individuals and ISG15 and SRSF1 mRNA expression. RT-qPCR analysis was performed to determine ISG15 and SRSF1 mRNA expression. Pearson correlation was calculated between plasma viral load and (B) ISG15 or (D) SRSF1 expression for acutely and chronically HIV-1-infected patients. Pearson correlation coefficient (r) and p-value (p) are indicated. (E) Comparison of relative ISG15 and SRSF1 mRNA levels for individual patients. (F) Calculated correlation between x-fold repression of SRSF1 mRNA levels and x-fold induction of ISG15 mRNA levels for all patient groups. Pearson correlation coefficient (r) and p-value (p) are indicated. Data points from healthy donors were depicted in black, while data points from treatment-naïve HIV-1-infected individuals were shown in red. ART-treated patients are colored in green. Patients with no or low ISG15 mRNA induction upon HIV-1 infection were considered as low responders without IFN signature and were thus excluded from statistical analysis (light gray). This patient cohort included 10 uninfected donors, 8 acutely HIV-1-infected patients, 11 chronically HIV-1-infected patients, and 13 HIV-1-infected patients under ART treatment.
Figure 3
Figure 3
SRSF1 expression upon stimulation with IFNα subtypes. Differentiated THP-1 cells were treated with the indicated IFN subtype (10 ng/ml). Twenty-four hours post-treatment, cells were harvested, and RNA was isolated and subjected to RT-qPCR for measurement of relative (A) ISG15 and (B) SRSF1 mRNA expression levels. Statistical significance was analyzed performing one-way ANOVA with Dunnett post-hoc test (*p < 0.05, **p < 0.01, ***p < 0.001, and ****p < 0.0001). Mean ( ± SEM) of n = 3 biological replicates is depicted. (C–E) Differentiated THP-1 cells were treated with 1 µM Ruxolitinib or DMSO as mock control1 h before infection using NL4-3 AD8 (1 MOI). Sixteen hours post-infection, cells were washed with PBS and treated with media containing PBS or IFNα14, and either Ruxolitinib or DMSO. At the indicated time points, wells were rinsed with PBS, and cells were subjected to RNA isolation and RT-qPCR analysis to monitor mRNA expression levels of (C) ISG15, (D) IFITM1, and (E) SRSF1. Groups were compared with two-way repeated-measures ANOVA with Tukey’s post-hoc test. ns is not significant.
Figure 4
Figure 4
SRSF1 mRNA and protein levels are differentially regulated upon stimulation of macrophages with IFNα2 or IFNα14. Differentiated THP-1 macrophages were treated with IFNα2 (light gray) or IFNα14 (dark gray) (10 ng/ml) over a period of 48 h before cells were harvested and RNA was isolated. Relative mRNA expression levels were measured via RT-qPCR analysis. (A, B) Relative mRNA expression levels of ISG15 and SRSF1 upon stimulation with (A) IFNα2 or (B) IFNα14 in THP-1 cells. Mixed-effects analyses followed by Dunnett’s post-hoc test were used to compare differences between groups at different time points (*p < 0.05, **p < 0.01, ****p < 0.0001 and ns, not significant). (C) Differentiated THP-1 macrophages were treated with IFNα2 or IFNα14 (10 ng/ml) for the indicated amount of time before cells were harvested and proteins were isolated. Proteins were separated by SDS-PAGE, blotted, and analyzed with an antibody specific to SRSF1. A representative Western blot is shown using GAPDH as a loading control. (D) Quantification of multiple Western blots (n = 4 for IFNa14, n = 3 for IFNa2). Total protein amount was stained using Trichloroethanol and used as loading control. Band intensity was measured using ImageJ software. Mixed-effects analyses followed by Dunnett’s post-hoc test. (E) Differentiated THP-1 macrophages were infected with the R5-tropic NL4-3 (AD8) (95) at an MOI of 1. Sixteen hours post-infection, cells were treated with the indicated IFN subtype (10 ng/ml) over a period of 48 h. Cells were harvested at the indicated time points, and RNA was isolated and subjected to RT-qPCR. Relative mRNA expression levels of SRSF1 in THP-1 cells after treatment with IFNα2 or IFNα14 as indicated. GAPDH was used as a house-keeping gene for normalization. Mixed-effects analyses followed by Dunnett’s post-hoc test were used to determine whether the difference between the group of samples reached the level of statistical significance (*p < 0.05, **p < 0.01, ***p < 0.001 and ****p < 0.0001). Mean ( ± SEM) of n = 4 biological replicates is shown.
Figure 5
Figure 5
SRSF1 mRNA levels are differentially regulated upon treatment of HIV-1 target cells with IFNs. (A) Monocyte-derived macrophages (MDMs) were treated for 48 h with 10 ng/ml of IFNα14. After harvesting the cells, RNA was extracted and subjected to RT-qPCR. Relative mRNA expression levels of ISG15 and SRSF1 are shown. Expression levels were normalized to GAPDH. Time point of 24 h only includes two biological replicates. (B) Differentiated THP-1 cells were stimulated with IFNγ (10 ng/ml) for 48 h before cells were harvested and RNA was isolated. Relative mRNA expression levels of IRF1 and SRSF1 were measured via RT-qPCR. GAPDH was used as a house-keeping gene for normalization. Mixed-effects analysis followed by Dunnett’s post-hoc test was conducted to determine whether the difference between the group of samples reached the level of statistical significance (*p < 0.05, **p < 0.01, ***p < 0.001, and ns, not significant). Mean ( ± SEM) of n = 4 biological replicates is shown. (C, D) Relative mRNA expression levels of ISG15 and SRSF1 upon stimulation with (C) IFNα2 or (D) IFNα14 in Jurkat cells. ACTB was used as a house-keeping gene for normalization. Mixed-effects analysis with Dunnett’s post-hoc test was performed to determine whether the difference between the group of samples reached the level of statistical significance (*p < 0.05, **p < 0.01, ***p < 0.001, and ns, not significant). Mean ( ± SEM) of n = 4 biological replicates is shown.
Figure 6
Figure 6
IFNα14-mediated changes in newly transcribed SRSF1 mRNA. (A, B) THP-1 macrophages were stimulated with IFNα14 (10 ng/ml). 4-Thiouridine (4sU) was added 30 min before harvesting the cells at the indicated time points in order to label newly synthesized RNA. After separation and isolation of the freshly synthesized RNA, RT-qPCR was performed to measure relative mRNA expression levels of (A) ISG15 and (B) SRSF1. GAPDH was used as a house-keeping gene for normalization. Statistical significance compared to untreated control was determined using unpaired two-sided Welch’s t-test. Asterisks indicated p-values as *p < 0.05 and ns, not significant. Mean ( ± SEM) of n = 3 biological replicates is shown (except for 4 h, where n = 2).
Figure 7
Figure 7
siRNA-mediated knockdown of SRSF1 affects HIV-1 LTR transcription and splice site usage. HEK293T cells were transfected with the proviral clone pNL4-3 PI952 and anti-SRSF1 siRNA or an siRNA negative control. Seventy-two hours post-transfection, cells were harvested and RNA and viral supernatant was isolated. Isolated RNA was subjected to RT-qPCR. (A, B) Relative mRNA expression levels of (A) SRSF1 and (B) exon 1- and exon 7-containing mRNAs (total viral mRNA) normalized to GAPDH expression. (C) Analysis of viral splicing pattern upon SRSF1 knockdown. Isolated RNA was subjected to RT-PCR analysis using the indicated primer pairs for the 2-kb, 4-kb, and tat mRNA class ( Supplementary Table 1 , Supplementary Table 2 , and Supplementary Figure 4 ). HIV-1 transcript isoforms are depicted on the right according to Purcell and Martin (36). To compare total RNA amounts, separate RT-PCRs amplifying HIV-1 exon 7-containing transcripts as well as cellular GAPDH were performed. PCR amplicons were separated on a 12% non-denaturing polyacrylamide gel. (D–G) Relative expression levels of (D) exon 2- and exon 3-containing, (E) vif and vpr, (F) tat1, tat2, and tat3, and (G) multiply spliced and unspliced mRNAs. HIV-1 mRNAs were analyzed using the indicated primers ( Supplementary Table 1 , Supplementary Table 2 , and Supplementary Figure 4 ). The mRNA expression of NL4-3 PI952 was set to 100%, and the relative splice site usage was normalized to total viral mRNA levels (exon 7-containing mRNAs). Unpaired two-tailed t-tests were calculated to determine whether the difference between the group of samples reached the level of statistical significance (*p < 0.05, **p < 0.01, ****p < 0.0001 and ns, not significant). Mean ( ± SEM) of n = 4 biological replicates is depicted for (A), (B), and (D–G). For (C), a representative gel is shown.
Figure 8
Figure 8
Impact of siRNA-based knockdown of SRSF1 on HIV-1 infectivity and virus production. RPE-ISRE luc cells were transfected with a plasmid coding for the proviral clone NL4-3 (AD8) (pNL4-3 AD8) and the indicated siRNA. Seventy-two hours post-transfection, cellular supernatant was harvested. (A, B) Viral infectivity was determined via TZM-bl assay. (A) Infected TZM-bl cells were stained with X-Gal. (B) Luciferase activity was determined measuring relative light units (RLUs). (C) p24-CA ELISA was performed to determine p24-CA levels in the cellular supernatant. (D) Cellular supernatant was used to determine viral copy number per milliliter. RT-qPCR was performed analyzing absolute expression levels of exon 7-containing transcripts (total viral mRNA). Statistical significance was determined using unpaired two-tailed t-tests (**p < 0.01). Mean ( ± SEM) of n = 4 biological replicates is shown for (B), (C), and (D). (E) HEK293T- and HEK293T APOBEC3G-expressing cells were seeded in poly-L-lysine (Sigma-Aldrich) pre-coated wells. Cells were transiently transfected with the proviral clone pNL4-3 and 12.8 nM of the indicated siRNA. Supernatants were harvested 48 h post-transfection and applied to TZM-bl cells. Forty-eight hours post-infection, cells were lysed for luciferase assay. The RLUs/s were normalized to whole protein amounts as determined using Bradford assay. The fold change is normalized to the signal of uninfected TZM-bl cells. Mean ( ± SEM) of n = 4 biological replicates and n = 2 technical replicates is shown. The significance was analyzed using two-way ANOVA (**p < 0.01, ***p < 0.001, and ns, not significant).
Figure 9
Figure 9
(A–G) Overexpression of SRSF1 affects HIV-1 LTR transcription and alternative splice site usage. HEK293T cells were transiently transfected with a plasmid coding for the proviral clone NL4-3 PI952 (pNL4-3 PI952) and a plasmid expressing FLAG-tagged SRSF1 (pcDNA-FLAG-SF2) or an empty vector [pcDNA3.1(+)] as mock control. Cellular RNA and cell culture supernatant were harvested 72 h post-transfection and subjected to further analysis. (A, B) RT-qPCR was performed to determine relative mRNA expression levels of (A) SRSF1 and (B) exon 1- and exon 7-containing mRNAs (total viral mRNA). GAPDH was used for normalization. (C) RT-PCR was performed using the indicated primer pairs covering the viral mRNA isoforms of the 2-kb, 4-kb, and tat mRNA class ( Supplementary Tables 1 , 2 and Supplementary Figure 4 ). HIV-1 transcript isoforms are indicated according to Purcell and Martin (36). HIV-1 exon 7-containing transcripts as well as cellular GAPDH were included as loading controls. PCR amplicons were separated on a 12% non-denaturing polyacrylamide gel. (D, G) Total RNA was subjected to RT-qPCR to measure relative mRNA expression levels of (D) exon 2- and exon 3-containing, (E) vif and vpr, (F) tat1, tat2, and tat3, and (G) multiply spliced and unspliced mRNAs using the indicated primers. Relative viral splice site usage was normalized to exon 7-containing mRNAs (total viral RNA). Unpaired two-tailed t-tests were used to calculate statistical significance (*p < 0.05, **p < 0.01, ***p < 0.001, and ****p < 0.0001). Mean ( ± SEM) of n = 4 biological replicates is depicted for (A, B) and (D–G). For (C), a representative gel is shown. ns is not significant.
Figure 10
Figure 10
Overexpression of SRSF1 affects HIV-1 infectivity and viral particle production. HEK293T cells were co-transfected with a plasmid coding for the proviral clone NL4-3 PI952 (pNL4-3 PI952) (371) and a plasmid coding for FLAG-tagged SRSF1 (pcDNA-FLAG-SF2) or an empty vector [pcDNA3.1(+)] as mock control. (A, B) Seventy-two hours post-transfection, the cell culture supernatant was used to determine viral infectious titers using TZM-bl reporter cells. (A) X-Gal staining of TZM-bl cells incubated with the cellular supernatant. (B) Measurement of luciferase activity. (C) Viral RNA extracted from the supernatant was subjected to RT-qPCR to quantify absolute expression levels of exon 7-containing transcripts (total viral mRNA). (D) p24-CA ELISA was performed to determine viral particle production. Statistical significance was calculated using unpaired two-tailed t-tests (****p < 0.0001 and ns, not significant). Mean ( ± SEM) of n = 4 biological replicates is depicted for (B–D).

References

    1. Katze MG, He Y, Gale M, Jr. Viruses and interferon: a fight for supremacy. Nat Rev Immunol (2002) 2(9):675–87. doi: 10.1038/nri888 - DOI - PubMed
    1. Lee AJ, Ashkar AA. The dual nature of type I and type II interferons. Front Immunol (2018) 9:2061. doi: 10.3389/fimmu.2018.02061 - DOI - PMC - PubMed
    1. Iwasaki A. A virological view of innate immune recognition. Annu Rev Microbiol (2012) 66:177–96. doi: 10.1146/annurev-micro-092611-150203 - DOI - PMC - PubMed
    1. Mogensen TH. Pathogen recognition and inflammatory signaling in innate immune defenses. Clin Microbiol Rev (2009) 22(2):240–73. doi: 10.1128/CMR.00046-08 - DOI - PMC - PubMed
    1. Gao D, Wu J, Wu YT, Du F, Aroh C, Yan N, et al. . Cyclic GMP-AMP synthase is an innate immune sensor of HIV and other retroviruses. Science (2013) 341(6148):903–6. doi: 10.1126/science.1240933 - DOI - PMC - PubMed

Publication types