. 2022 Nov 15:13:1005226.
doi: 10.3389/fimmu.2022.1005226. eCollection 2022.

Mucosal-associated invariant T cells repress group 2 innate lymphoid cells in Alternaria alternata-induced model of allergic airway inflammation

Affiliations

Mucosal-associated invariant T cells repress group 2 innate lymphoid cells in Alternaria alternata-induced model of allergic airway inflammation

Yasuo Shimizu et al. Front Immunol. .

Abstract

Mucosal-associated invariant T (MAIT) cells, a blossoming member of the innate-like T cells, play a pivotal role in host defense through engaging the mucosal immunity. Although it has been suggested that MAIT cells are somehow implicated in the allergic airway inflammation mediated by group 2 innate lymphoid cells (ILC2s) such as asthma, the precise role(s) of MAIT cells in such inflammation has remained elusive. To explore the possible roles of MAIT cells in the inflammation, we examined whether MAIT cells suppressed the production of T helper (Th) 2 and inflammatory cytokines from ILC2s, and constrained the proliferation of ILC2s, both of which are prerequisite for airway inflammation. Given that laboratory mice are poor at MAIT cells, a novel mouse line rich in MAIT cells was used. We found that mice rich in MAIT cells showed alleviated airway inflammation as evidenced by reduced infiltration of the immune cells and hyperplasia in goblet cells in the lung concomitant with compromised production of Th2 and inflammatory cytokines, while wild type mice exhibited severe inflammation upon challenge with the fungal extracts. In vitro coculture experiments using purified ILC2s and MAIT cells unrevealed that cytokine-stimulated MAIT cells suppressed ILC2s to produce the cytokines as well as to proliferate most likely via production of IFN-γ. Furthermore, reconstitution of the allergic airway inflammation in the highly immunocompromised mice showed that ILC2-mediated inflammation was alleviated in mice that received MAIT cells along with ILC2s. We concluded that MAIT cells played a crucial role in suppressing the cytokine-producing capacity of ILC2s and ILC2 proliferation, that ultimately led to decrease in the allergic airway inflammation. The results open up a novel therapeutic horizon in ILC2-mediated inflammatory diseases by modulating MAIT cell activity.

Keywords: Alternaria alternata; Interferon γ (IFN-γ); MAIT1; allergic airway inflammation; group 2 innate lymphoid cells (ILC2s); immunocompromised mice; mice rich in MAIT cells; mucosal-associated invariant T (MAIT) cells.


Conflict of interest statement

The authors declare that the research was conducted in the absence of any commercial or financial relationships that could be construed as a potential conflict of interest.

Figures

Figure 1
Figure 1
Mitigated lung inflammation in Vα19 mice upon the A alternata challenge (A) Schematic representation of the experiment. The challenge as well as the sampling schedule are indicated (AA: A alternata challenge, PBS: phosphate-buffered saline challenge) (upper panel), BAL: bronchoalveolar lavage, and the lungs (lower panel). A alternata extract (10 μg in 50 μl PBS) or PBS (50 μl) was intranasally challenged on day 0, 3 and 6. (B) Quantification of cell subsets in BAL fluid. The number of the indicated cell subsets in BAL fluid (BALF) sampled on day 8 are shown. WT PBS: wild-type mice challenged with PBS, Vα19 PBS: Vα19 mice challenged with PBS, WT AA: wild-type mice challenged with A alternata, Vα19 AA: Vα19 mice challenged with A alternata. Data are shown as mean ± SD (n=4 per group), *P<0.05, **P<0.01, ***P<0.001, ****P<0.0001. Data from two independent experiments are shown. (C) IL-33 production upon the A alternata challenge. IL-33 concentrations in BALF from the indicated mouse groups 1 h after the challenge are shown. Data are shown as mean ± SD (n=4 per group). The mouse grouping is the same as that in (B) Data from two independent experiments are shown. (D) Time course of cytokine production. Cytokine concentrations in BALF at the indicated day after the challenge in A alternata-challenged wild-type (WT AA) and Vα19 (Vα19 AA) mice. Data are shown as mean ± SD (n= 4 per group), *P<0.05, **P<0.01. Data from at least two independent experiments are shown. (E, F). Histological analyses of WT and Vα19 mouse lungs. (E) Lung tissue sections stained with hematoxylin and eosin on day 8 after the A alternata. challenge. WT: wild-type mice, Vα19: Vα19 mice (left panels). The scale bar indicates 100 μm. (F) Same as described in E, except that the tissue sections were stained with PAS. Scale bars indicate 100 μm and 20 μm, respectively (left panel). Imaging of PAS stain was obtained with analysis software (inform, ver.2.6) equipped in Mantra2. The percentage of the PAS-positive area relative to the total surface of epithelial cells is shown as mean ± SD (n=4 per group) (right panel), ****P<0.0001. Data from at least five different views were used for measurement.
Figure 2
Figure 2
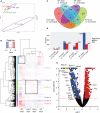
Transcriptome analysis of MAIT cells (A) Principal component analysis (PCA) Transcriptional data on MAIT cells from naïve wild-type mouse and Vα19 mouse lungs before the challenge (WT day 0 and Vα19 day 0), and those after the A alternata. challenge for 8 days (WT AA day 8 and Vα19 AA day 8) are plotted (n=2 per group). (B) Heatmap analysis Heatmap analyses of transcripts from A alternata-challenged wild-type and Vα19 mouse lung-derived MAIT cells (WT day 8 and Vα19 day 8, respectively), and naïve Vα19 and wild-type mouse lung-derived MAIT cells (Vα19 day 0 and WT day 0, respectively) are shown (n=2 per group). Relative expression levels are depicted in different colors. (C) Venn’s diagrams showing differentially expressed genes (DEG) common to the indicated groups. The number indicates the number of genes categorized in the indicated zone. (D) The number of DEG. The numbers of up- (red) and down-regulated genes (blue) between the designated populations are shown. (E) Volcano plot Volcano plot depicting DEG between MAIT cells in WT day 8 and those in Vα19 day 8. Genes that increased in the latter are indicated in red, while those that decreased are in blue. The genes potentially related to the inflammation suppressive functions and those relevant to MAIT1 gene signature are shown with yellow circles. X-axis: Log2 [fold change (FC)], Y-axis: -Log10(adjusted P value).
Figure 3
Figure 3
Compromised cytokine production by and proliferation of ILC2s by MAIT cells (A) Schematic representation of the experiment. ILC2s prepared from wild-type mice (5 × 10³ cells) and MAIT cells (5 × 10³ cells) from Vα19 mice that were sham-treated, treated with IL-12 (10 ng/ml), IL-15 (10 ng/ml), and IL-18 (10 ng/ml) (cytokines), or with 5-OP-RU (10 nM) for 18 h were subjected to cocultures in the 96 well Transwell culture system. The purity of isolated ILC2s and MAIT cells was more than 89% and 79%, respectively as judged by flowcytometry. On day 2, the culture supernatant was subjected to a cytokine assay, while other assays including the cytokine quantification were performed on day 5. (B) Suppression of ILC2 proliferation by cyt-MAIT cells. ILC2 cell numbers upon the coculture with the designated MAIT cells are indicated. MAIT: naïve MAIT cells, cyt-MAIT: IL-12, IL-15, and IL-18-stimulated MAIT cells, 5OR-MAIT: 5-OP-RU-stimulated MAIT cells. The direct culture allowed the contact between ILC2s and MAIT cells, while the indirect culture physically separated these cells in a transwell. Data are shown as mean ± SD (n=3), *P<0.05, **P<0.01, ***P<0.001, ****P<0.0001. Data from at least two independent experiments are shown. (C) Regulation of PD-L1 and KLRG1 in ILC2s. PD-L1 and KLRG1 expression in ILC2s after the indirect coculture described in (B) Data are shown as mean ± SD (n=3), **P<0.01, ***P<0.001, ****P<0.0001. Data from at least two independent experiments are shown. (D) Cytokine production by ILC2s and/or MAIT cells. Concentrations of the indicated cytokines from ILC2s, naïve MAIT cells (MAIT), cyt-MAIT cells (cyt-MAIT), and the coculture of ILC2s with naive MAIT cells or with cyt-MAIT cells for 2 days (bars filled with black) and 5 days (bars filled with grey) are shown. Data are mean ± SD (n=3). Data from two independent experiments are shown. (E) Release of the inhibition of ILC2 proliferation. ILC2 numbers in the indirect coculture with cyt-MAIT cells for 5 days in the presence of isotype control IgG (isotype) or the indicated amounts of IFN-γ-neutralizing antibody are shown. Data are mean ± SD (n=3), ***P<0.001. Culture conditions are the same as described in (B) Data from at least two independent experiments are shown. (F) Expression of PD-L1 and KLRG1 upon the neutralization of IFN-γ. This is the same as that described in E, except that the expression levels of PD-L1 and KLRG1 in ILC2s are depicted. Data are mean ± SD (n=3), ***P<0.001, ****P<0.0001. Data from two independent experiments are shown. (G) Release of PD-L1-mediated inhibition of ILC2 proliferation. This was the same as that described in E, except that the PD-L1-neutralizing antibody was used at the indicated concentrations. Data are mean ± SD (n=3), *P<0.05, **P<0.01. Data from at least two independent experiments are shown. (H) MAIT cell proliferation. Sort-purified MAIT cells (5 × 10³ cells) left untreated (naive MAIT), treated with IL-12/IL-15/IL-18 (cyt-MAIT), or 5-OP-RU (5OR-MAIT) were cocultured with or without ILC2s (5 × 10³ cell) in Transwell as described in (A) Resulting MAIT cell numbers in the absence or presence of IL-33 (10 ng/ml) for 5 days are shown. Data are mean ± SD (n=3), *P<0.05, **P<0.01. Data from at least two independent experiments are shown. (I) IFN-γ and PD-L1-independent proliferation of MAIT cells. The experiments are the same as E and G, except that cyt-MAIT cell numbers are measured. Data show the number of the cells after 5 days culture and are mean ± SD (n=3). Data from two independent experiments are shown.
Figure 4
Figure 4
Reconstituted suppression of ILC2-mediated allergic airway inflammation by MAIT cells. (A) Schematic representation of the experiment. ILC2s (1.0 x 10⁶ cells/mouse, the purity >89% defined as CD90.2+ST2+ cells among CD45+lineage- cells) alone from wild-type (WT) mice or in combination with sort-purified MAIT cells (1.0 x 10⁶ cells/mouse, the purity >79% defined as B220-CD19-F4/80-TCRβ+MR1 tetramer+ cells among lymphocytes) from Vα19 mice (Vα19) were adoptively transferred into NOG mice followed by an intranasal challenge with IL-33 (0.5μg in 20 μl PBS per mouse) as indicated. Sampling was performed on day 6. (B) Cytokines in BALF. The concentrations of the indicated cytokines in BALF from NOG mice received only ILC2s (ILC2) or both ILC2s and MAIT cells (ILC2+MAIT) are shown. Data are shown as mean ± SD (n=4), *P<0.05, **P<0.01. (C) Suppression of ILC2 accumulation in the lungs. The numbers of MAIT cells and ILC2s in the lungs of NOG mice received ILC2s only, and those received both ILC2s and MAIT cells are shown. MAIT (MAIT cells), ILC2 (ILC2s) Data show mean ± SD (n=4), **P<0.01. (D) MAIT cell-mediated mitigation of lung inflammation. HE and PAS staining of lung tissue sections from NOG mice received only ILC2s (ILC2, upper panels) and those received both ILC2s and MAIT cells (ILC2+MAIT, lower panels) are shown. Bars indicate 50 μm and 20 μm, respectively. In PAS staining, the rectangles indicate the enlarged regions shown on the right. Right panel shows the percentage of PAS+ area within the epithelial cells. **P<0.01. Representative data from at least 5 different areas are shown (n=3). (E) Localization of ILC2s and MAIT cells in the lungs. ILC2s and MAIT cells in the NOG mouse lungs upon adoptive transfer are identified with surrogate markers. ILC2s are shown as GATA3+ cells (red or magenta) and MAIT cells as CD3+ cells (green) within tissue sections representing the perivascular, submucosal, and peribronchial regions. a: artery, b: bronchus. Nuclei are stained with DAPI. Bars indicate 50 μm. Representative data from 4 mice are shown. (F) Juxtaposition of ILC2s and MAIT cells in the lungs. Representative superimposed images of GATA3-expressing cells (magenta) and those expressing CD3 (green), representing ILC2s and MAIT cells, respectively, in the NOG mouse lungs. Nuclei are stained with DAPI (blue). Bars indicate 10 μm. Representative data from 4 mice are shown.

References

    1. Collaborators, GBD 2019 Diseases and Injuries. Ärnlöv J. Global burden of 369 diseases and injuries in 204 countries and territories, 1990–2019: a systematic analysis for the global burden of disease study 2019. Lancet (2020) 396:1204–22. doi: 10.1016/S0140-6736(20)30925-9 - DOI - PMC - PubMed
    1. Wenzel SE. Severe adult asthmas: Integrating clinical features, biology, and therapeutics to improve outcomes. Am J Respir Crit Care Med (2021) 203:809–21. doi: 10.1164/rccm.202009-3631CI - DOI - PMC - PubMed
    1. Moro K, Yamada T, Tanabe M, Takeuchi T, Ikawa T, Kawamoto H, et al. Innate production of T(H)2 cytokines by adipose tissue-associated c-Kit(+)Sca-1(+) lymphoid cells. Nat (London) (2010) 463:540–4. doi: 10.1038/nature08636 - DOI - PubMed
    1. Licona-Limon P, Kim LK, Palm NW, Flavell RA. TH2, allergy and group 2 innate lymphoid cells. Nat Immunol (2013) 14:536–42. doi: 10.1038/ni.2617 - DOI - PubMed
    1. Starkey MR, McKenzie AN, Belz GT, Hansbro PM. Pulmonary group 2 innate lymphoid cells: surprises and challenges. Mucosal Immunol (2019) 12:299–311. doi: 10.1038/s41385-018-0130-4 - DOI - PMC - PubMed

Publication types

Supplementary concepts

LinkOut - more resources