. 2022 Oct 13;4(6):fcac248.
doi: 10.1093/braincomms/fcac248. eCollection 2022.

Mutant huntingtin messenger RNA forms neuronal nuclear clusters in rodent and human brains

Affiliations

Mutant huntingtin messenger RNA forms neuronal nuclear clusters in rodent and human brains

Socheata Ly et al. Brain Commun. .

Abstract

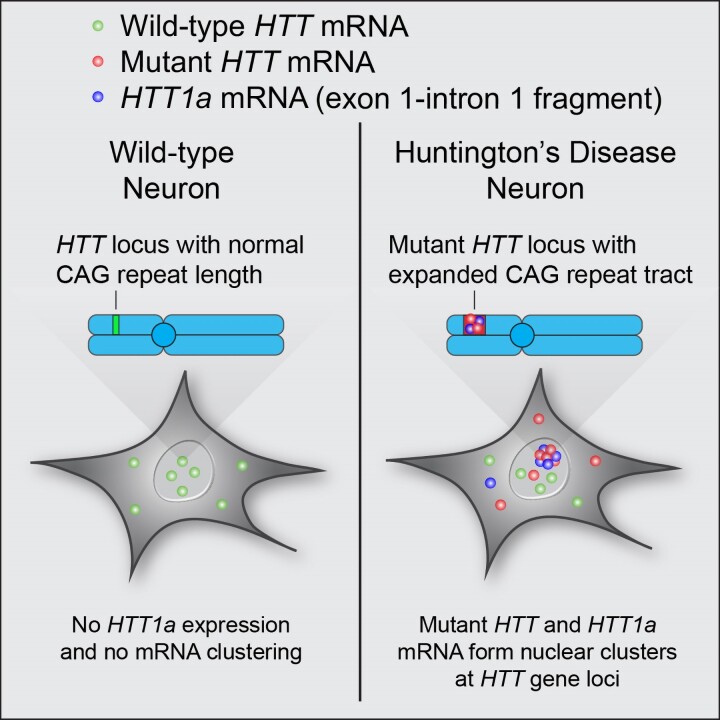
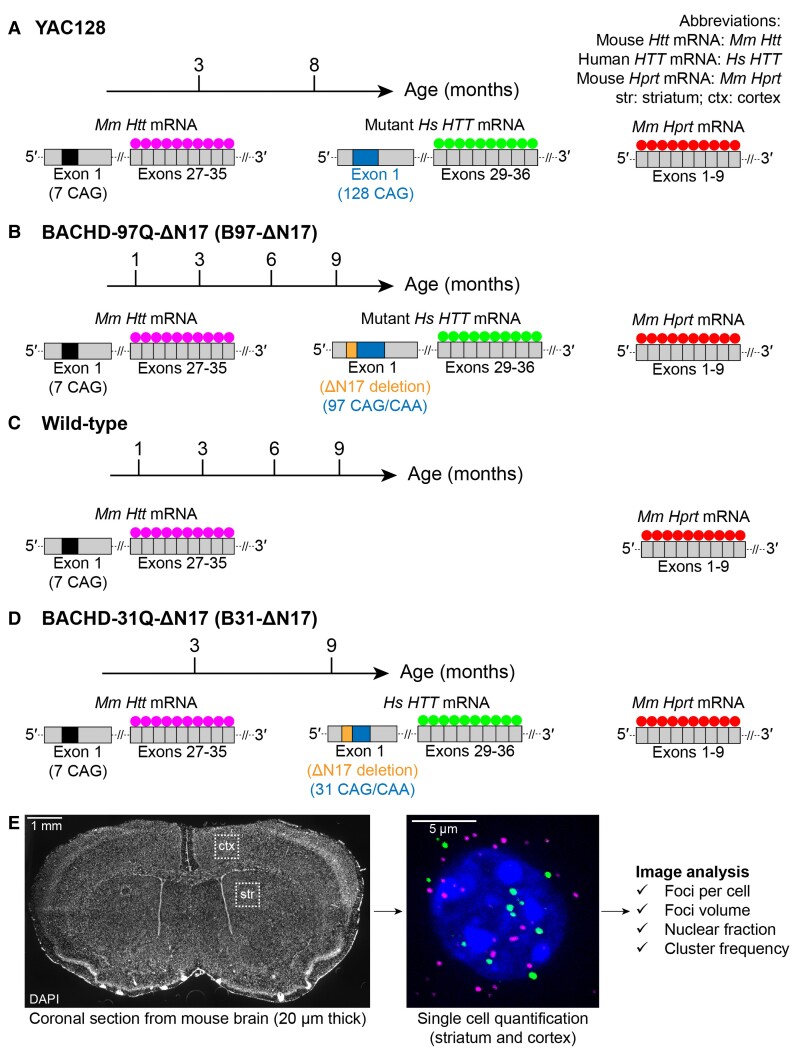
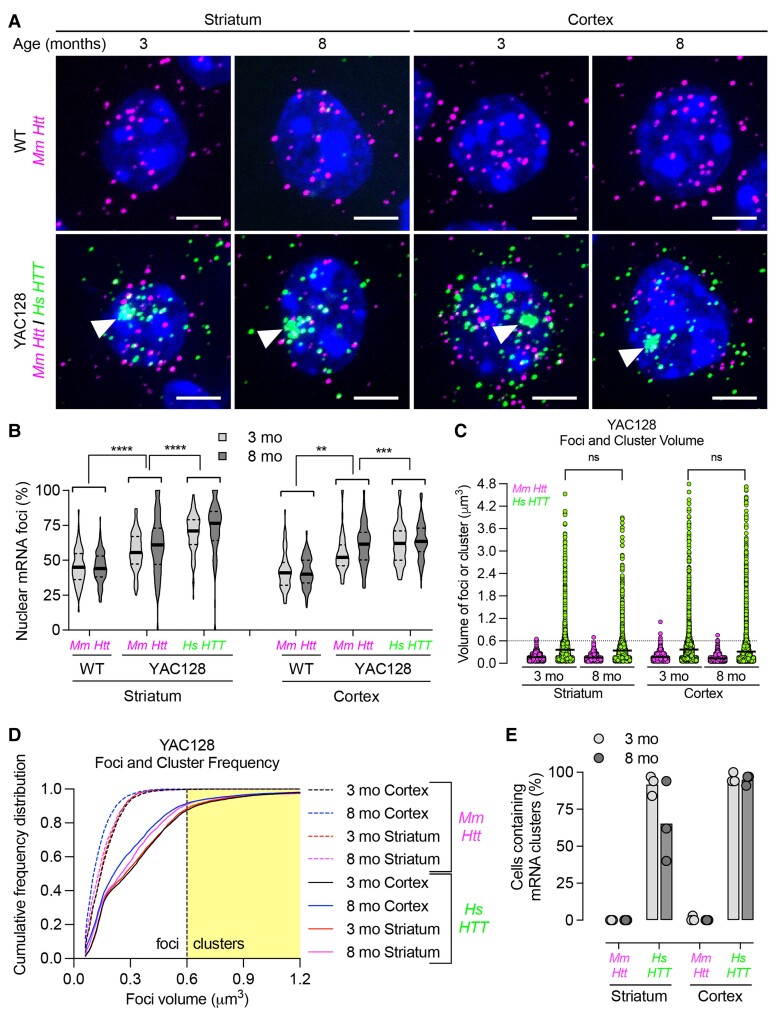
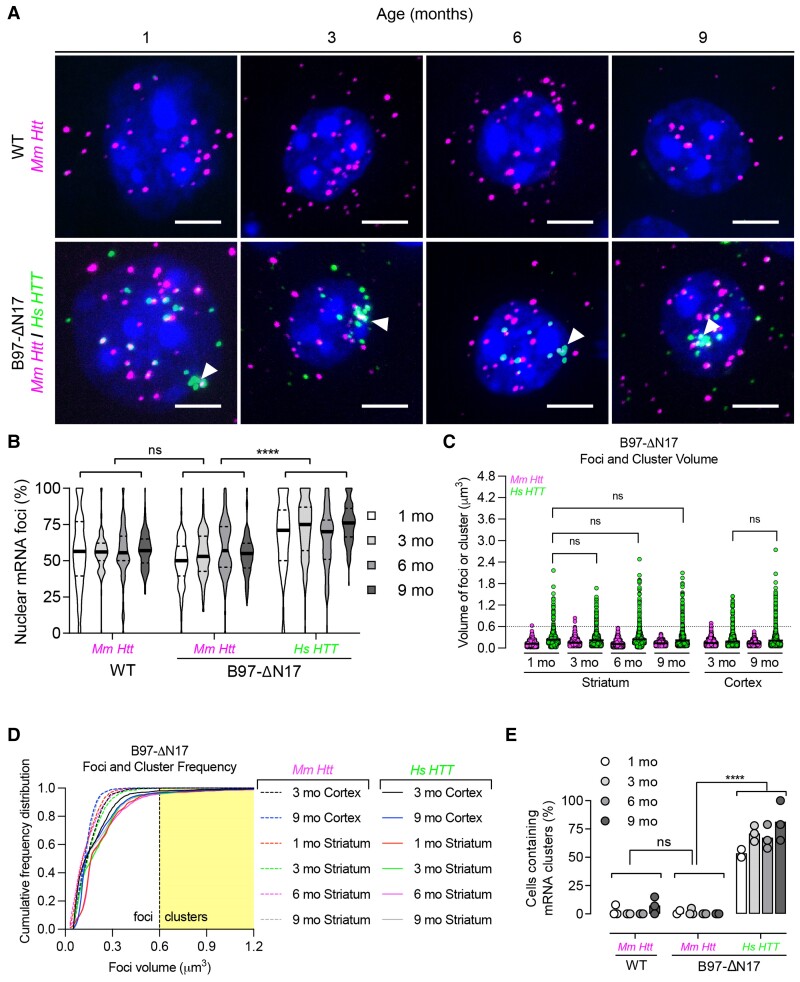
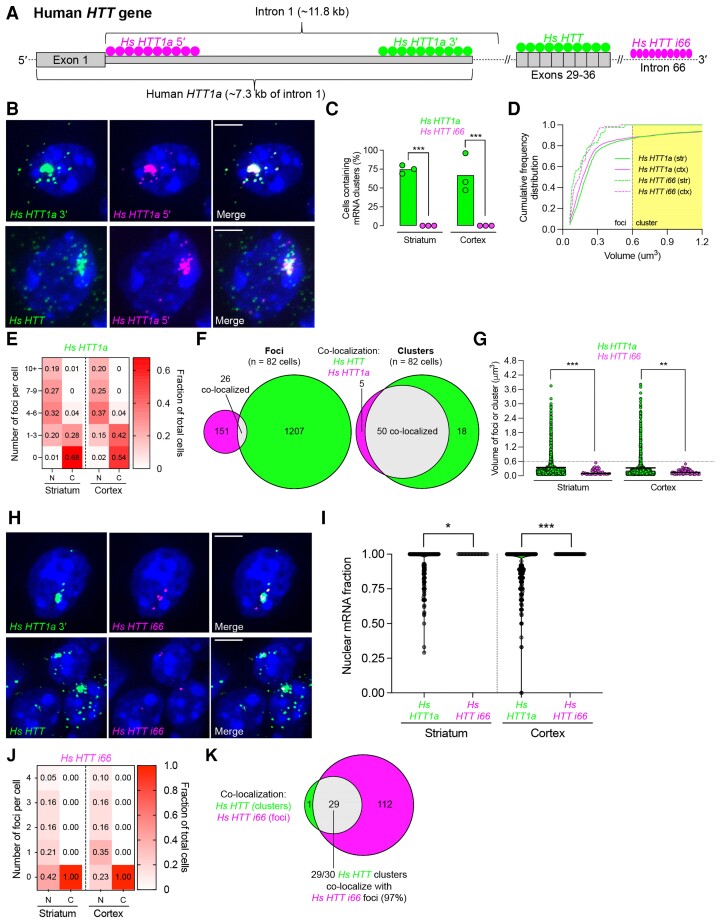
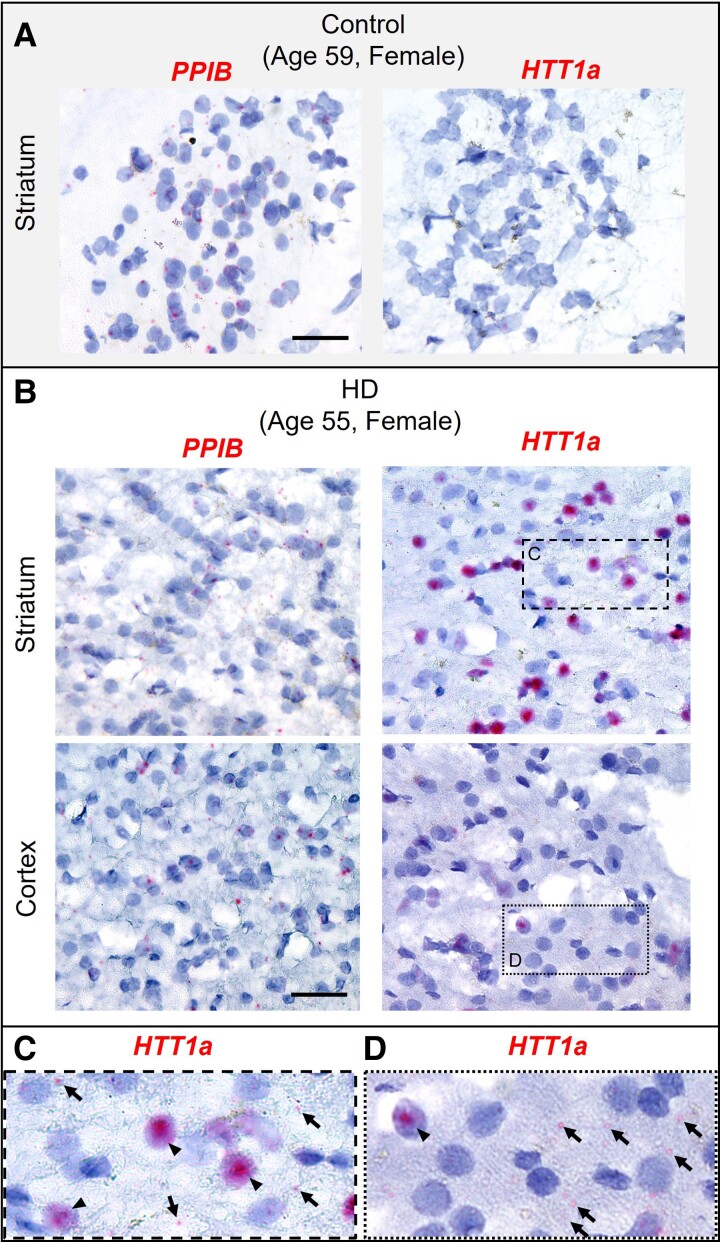
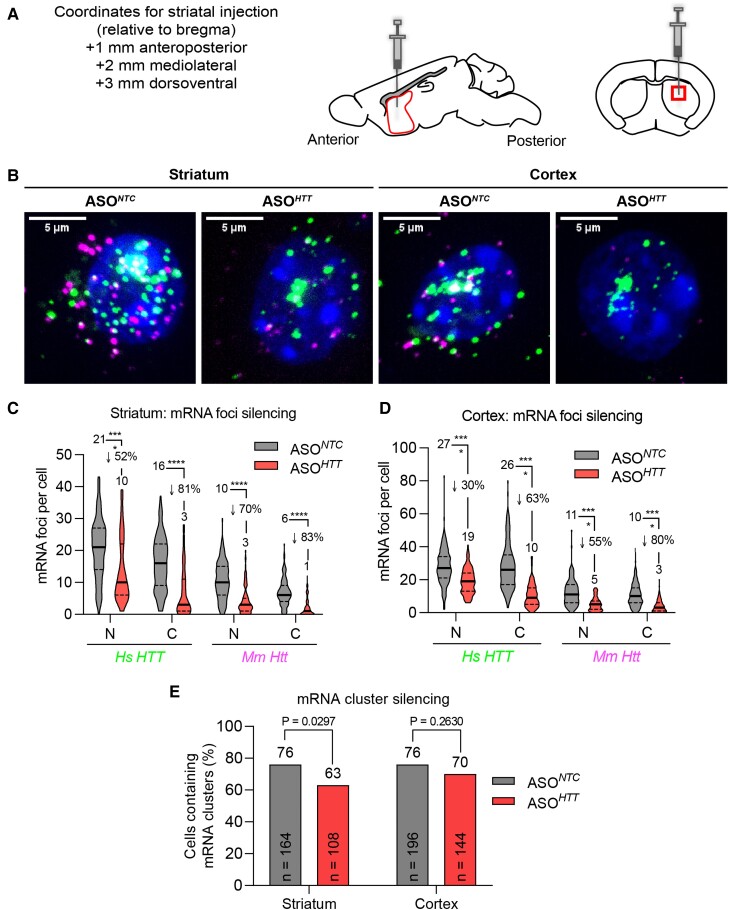
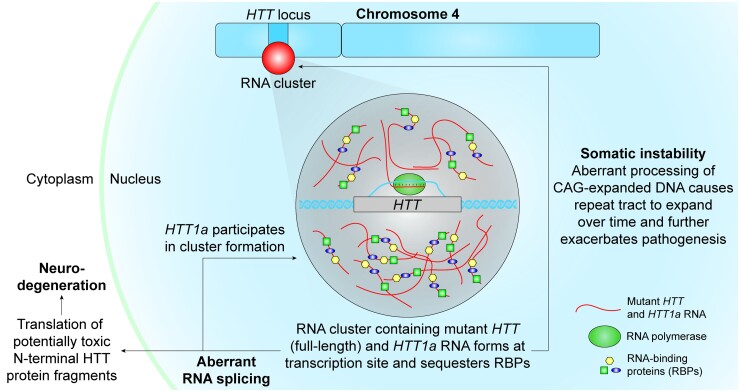
Mutant messenger RNA (mRNA) and protein contribute to the clinical manifestation of many repeat-associated neurological disorders, with the presence of nuclear RNA clusters being a common pathological feature. Yet, investigations into Huntington's disease-caused by a CAG repeat expansion in exon 1 of the huntingtin (HTT) gene-have primarily focused on toxic protein gain-of-function as the primary disease-causing feature. To date, mutant HTT mRNA has not been identified as an in vivo hallmark of Huntington's disease. Here, we report that, in two Huntington's disease mouse models (YAC128 and BACHD-97Q-ΔN17), mutant HTT mRNA is retained in the nucleus. Widespread formation of large mRNA clusters (∼0.6-5 µm3) occurred in 50-75% of striatal and cortical neurons. Cluster formation was independent of age and driven by expanded repeats. Clusters associate with chromosomal transcriptional sites and quantitatively co-localize with the aberrantly processed N-terminal exon 1-intron 1 mRNA isoform, HTT1a. HTT1a mRNA clusters are observed in a subset of neurons from human Huntington's disease post-mortem brain and are likely caused by somatic expansion of repeats. In YAC128 mice, clusters, but not individual HTT mRNA, are resistant to antisense oligonucleotide treatment. Our findings identify mutant HTT/HTT1a mRNA clustering as an early, robust molecular signature of Huntington's disease, providing in vivo evidence that Huntington's disease is a repeat expansion disease with mRNA involvement.

Keywords: Huntington’s disease; RNA fluorescence in situ hybridization; antisense oligonucleotides; mutant HTT mRNA; nuclear RNA clusters.


Figures

Graphical abstract
Graphical abstract
Figure 1
Figure 1
Experimental system for multiplex evaluation of wild-type Htt and Hs HTT mRNA subcellular localization in brain slices. (A–D) Dual-colour FISH probe sets targeting: mouse (Mm) Htt mRNA in exons 27–35, human (Hs) HTT mRNA in exons 29–36 and Mm Hprt mRNA in exons 1–9 in (A) YAC128, (B) B97-ΔN17, (C) wild-type and (D) B31-ΔN17 mice. (E) Regions of the mouse brain used for RNAscope image analysis.
Figure 2
Figure 2
Repeat expansion increases nuclear retention of mutant Hs HTT mRNA and forms clusters in YAC128 mouse striatum and cortex. (A) Mm Htt and Hs HTT mRNAs were detected in YAC128 mouse striatum and cortex by FISH. Nuclei labelled with Hoechst. Scale bar, 5 µm. (B) Percentage of nuclear Mm Htt and Hs HTT mRNAs in wild-type (WT) and YAC128 mice at 3 and 8 months old (n = ∼100 cells per region pooled from three mice). (C) Scatter plot showing the volume of individual mRNA foci or clusters (see Methods for volume calculation). Each point represents the volume of individual mRNA foci. (D) Cumulative frequency distribution plot of RNA foci volume. The yellow shaded area represents the cut-off for a cluster, which is defined as ≥0.6 µm3. The thick line represents the mean. (E) Percentage of cells containing Mm Htt or Hs HTT mRNA clusters in YAC128 mouse striatum and cortex (n = ∼100 cells per brain region pooled from three mice, each point represents a mouse). For all panels, ns = not significant, **P < 0.01, ***P < 0.001, ****P < 0.0001, one-way ANOVA, Bonferroni’s multiple comparisons test.
Figure 3
Figure 3
Repeat expansion increases nuclear retention of mutant Hs HTT mRNA and forms clusters in B97-ΔN17 mouse striatum. (A) Mm Htt and Hs HTT mRNAs were detected in B97-ΔN17 mouse striatum by FISH. Nuclei labelled with Hoechst. Scale bar, 5 µm. (B) Percentage of nuclear Mm Htt and Hs HTT mRNAs in wild-type (WT) and B97-ΔN17 mice at 1, 3, 6, and 9 months old (n = ∼100 cells per brain region pooled from three mice). (C) Scatter plot showing the volume of individual mRNA foci or clusters (see Methods for volume calculation). Each point represents the volume of individual mRNA foci. (D) Cumulative frequency distribution plot of RNA foci volume. The yellow shaded area represents the cut-off for a cluster, which is defined as ≥0.6 µm3. The thick line represents the mean. (E) Percentage of cells containing Mm Htt or Hs HTT mRNA clusters in B97-ΔN17 mouse striatum (n = ∼100 cells per brain region pooled from three mice, each point represents a mouse). For all panels, ns = not significant, **P < 0.01, ***P < 0.001, ****P < 0.0001, one-way ANOVA, Bonferroni’s multiple comparisons test.
Figure 4
Figure 4
Hs HTT1a, the aberrantly spliced exon 1-intron 1 fragment, is present in the cytoplasm and forms clusters that co-localize with Hs HTT clusters. (A) Gene schematic showing Hs HTT1a and Hs HTT i66. Filled circles indicate regions where FISH probes were designed. (B) Confocal microscope images of YAC128 mouse striatum (3 months old) detected by FISH. DAPI. Scale bar, 5 µm. (C) Percentage of cells containing Hs HTT1a or Hs HTT i66 mRNA clusters in YAC128 mouse striatum and cortex (n = ∼300 cells per brain region pooled from three mice, each point represents a mouse, one-way ANOVA with Tukey’s multiple comparisons test [F(3,8) = 29.20)]. (D) Cumulative frequency distribution plot of RNA foci volume. The yellow shaded area represents the cut-off for a cluster, which is defined to be at least 0.6 µm3. (E) Heatmap of the number of nuclear and cytoplasmic Hs HTT1a mRNA foci detected per individual cell by FISH. Each column adds up to 1. (F) Venn diagram depicting the co-localization of Hs HTT and Hs HTT1a mRNA analysed separately as foci versus clusters. (G) Scatter plot showing the volume of individual mRNA foci or clusters (see Methods for how volume was calculated). Each point represents the volume of individual mRNA foci and thick line represents the mean (Kruskal–Wallis one-way ANOVA with Dunn’s multiple comparisons test). (H) Same as (B) using different RNAscope probes. (I) Nuclear fraction of Hs HTT1a and Hs HTT i66 mRNA is in the striatum and cortex. Each point represents a cell (n = ∼300 cells pooled from three mice per brain region, Kruskal–Wallis one-way ANOVA with Dunn’s multiple comparisons test). (J) Same as (E), but looking at Hs HTT i66. (K) Same as (F), but looking at the co-localization of Hs HTT clusters and Hs HTT i66 foci. For all panels, ns = not significant, *P < 0.05, **P < 0.01, ***P < 0.001, ****P < 0.0001.
Figure 5
Figure 5
Hs HTT1a forms clusters in post-mortem HD brain and are detectable in the cytoplasm as foci Chromogenic RNAscope assay was performed in healthy control and HD post-mortem human brains and counterstained with hematoxylin. (A) PPIB and HTT1a mRNA in post-mortem control striatum. Scale bar, 20 µm. (B) PPIB and HTT1a mRNA in post-mortem HD striatum (top) and cortex (bottom). Scale bar, 20 µm. (C, D) Insets of boxed regions in panel (B) showing HTT1a mRNA in the striatum (C) and cortex (D). Arrowheads indicate HTT1a clusters, and arrows indicate cytoplasmic HTT1a foci.
Figure 6
Figure 6
ASOs efficiently silence wild-type Mm Htt and Hs HTT mRNA foci but not nuclear clusters. (A) ASONTC and ASOHTT (40 µg in 2 µl; n = 3 animals per group) were administered by unilateral intra-striatal bolus microinjection in 3-month-old YAC128 mice and euthanized 3 weeks later for analysis. Schematic diagram of sagittal and coronal sections through the mouse striatum at the site of injection is shown. The striatal region selected to acquire the images (box) is indicated. (B) FISH detection of Mm Htt and Hs HTT mRNAs in striatum (left) and cortex (right). Nuclei labelled with Hoechst. Representative images are maximum Z-projections through the nuclear region spaced 0.5 µm apart. Scale bar, 5 µm. (C, D) Quantification of Hs HTT and Mm Htt mRNA foci silencing in striatum (C) and cortex (D). N = nucleus, C = cytoplasm (n = 100–200 cells analysed per brain region per group pooled from three mice, *P < 0.05, **P < 0.01, ***P < 0.001, ****P < 0.0001, one-way ANOVA, Bonferroni’s multiple comparisons test). (E) Quantification of mRNA cluster silencing in striatum and cortex (P value calculated using Fisher’s exact test). ASO, antisense oligonucleotide; NTC, non-targeting control. See also Supplementary Table 2.
Figure 7
Figure 7
Proposed model of mutant HTT RNA cluster formation, pathology, and pathogenesis. RNA clusters containing mutant HTT RNA nucleate at active transcription sites. These repeat-expanded RNAs sequester RBPs, removing them from the available cellular pool, and thus, disrupting downstream RNA processing such as splicing. HTT itself is aberrantly spliced to produce HTT1a, which also participates in cluster formation. Globally disrupted splicing can result in the translation of altered protein isoforms and lead to neurotoxicity. This entire process is exacerbated by somatic instability, which acts as a positive feedback loop and expands the CAG repeat tract in the HTT gene over time and further increases the rate of HTT1a production.

Similar articles

Cited by

References

    1. Todd PK, Paulson HL. RNA-mediated neurodegeneration in repeat expansion disorders. Ann Neurol. 2010;67(3):291–300. - PMC - PubMed
    1. de Mezer M, Wojciechowska M, Napierala M, Sobczak K, Krzyzosiak WJ. Mutant CAG repeats of huntingtin transcript fold into hairpins, form nuclear foci and are targets for RNA interference. Nucleic Acids Res. 2011;39(9):3852–3863. - PMC - PubMed
    1. Krzyzosiak WJ, Sobczak K, Wojciechowska M, Fiszer A, Mykowska A, Kozlowski P. Triplet repeat RNA structure and its role as pathogenic agent and therapeutic target. Nucleic Acids Res. 2012;40(1):11–26. - PMC - PubMed
    1. The Huntington’s Disease Collaborative Research Group . A novel gene containing a trinucleotide repeat that is expanded and unstable on Huntington’s disease chromosomes. Cell. 1993;72(6):971–983. - PubMed
    1. Bhide PG, Day M, Sapp E, et al. . Expression of Normal and mutant huntingtin in the developing brain. J Neurosci. 1996;16(17):5523–5535. - PMC - PubMed

LinkOut - more resources