. 2023 Mar;48(3):297-311.
doi: 10.1080/02713683.2022.2149808. Epub 2022 Dec 2.

Association of Placental Growth Factor and Angiopoietin in Human Retinal Endothelial Cell-Pericyte co-Cultures and iPSC-Derived Vascular Organoids

Affiliations

Association of Placental Growth Factor and Angiopoietin in Human Retinal Endothelial Cell-Pericyte co-Cultures and iPSC-Derived Vascular Organoids

Hu Huang et al. Curr Eye Res. 2023 Mar.

Abstract

Purpose: Placental growth factor (PlGF) and Angiopoietin (Ang)-1 are two proteins that are involved in the regulation of endothelial cell (EC) growth and vasculature formation. In the retina and endothelial cells, pericytes are the major source of both molecules. The purpose of this study is to examine the association of PlGF and Ang-1 with human EC/pericyte co-cultures and iPSC-derived vascular organoids.

Methods: In this study, we used co-cultures of human primary retinal endothelial cells (HREC) and primary human retinal pericytes (HRP), western blotting, immunofluorescent analysis, TUNEL staining, LDH-assays, and RNA seq analysis, as well as human-induced pluripotent stem cells (iPSC), derived organoids (VO) to study the association between PlGF and Ang-1.

Results: Inhibition of PlGF by PlGF neutralizing antibody in HREC-HRP co-cultures resulted in the increased expression of Ang-1 and Tie-2 in a dose-dependent manner. This upregulation was not observed in HREC and HRP monocultures but only in co-cultures suggesting the association of pericytes and endothelial cells. Furthermore, Vascular endothelial growth factor receptor 1 (VEGFR1) inhibition abolished the Ang-1 and Tie-2 upregulation by PlGF inhibition. The pericyte viability in high-glucose conditions was also reduced by VEGFR1 neutralization. Immunofluorescent analysis showed that Ang-1 and Ang-2 were expressed mainly by perivascular cells in the VO. RNA seq analysis of the RNA isolated from VO in high glucose conditions indicated increased PlGF and Ang-2 expressions in the VO. PlGF inhibition increased the expression of Ang-1 and Tie-2 in VO, increasing the pericyte coverage of the VO microvascular network.

Conclusion: Combined, these results suggest PlGF's role in the regulation of Ang-1 and Tie-2 expression through VEGFR1. These findings provide new insights into the neovascularization process in diabetic retinopathy and new targets for potential therapeutic intervention.

Keywords: PlGF; angiopoietin; diabetic retinopathy; pericyte; vascular organoids.


Conflict of interest statement

None of the authors has a conflict of interest with or source of funding for the submission.

Conflict of interest: The authors report no conflicts of interest. The authors alone are responsible for the content and writing of the paper.

Figures

Figure 1.
Figure 1.. PlGF blockade regulates Ang-1 and Tie-2 protein expressions in HRP-HREC co-culture in an antibody dose-dependent manner.
Primary human retinal endothelial cells (HREC) and pericytes (HRP) are co-cultured at a 2:1 ratio. The confluent HRP-HREC co-cultures were treated with three PlGF antibody concentrations (25, 50, and 100 μg/ml) for two days. IgG was used as treatment control. (A, B) Western blotting results of Tie-2, N-Cadherin (N-Cad), VE-Cadherin (VE-Cad), and Angiopoietin-1 (Ang-1). GAPDH acted as a loading control. Note that the HREC-HRP co-cultures were used for all western blotting analyses. (C, D) Densitometry quantification results of the western blots. * indicates P < 0.05 compared with control. $ indicates P < 0.05 compared with 25μg/ml. It should be noted: that although the Tie-2 and Ang-1 WB results had variations among the three samples of 100 μg/ml PlGF antibody, the pixel intensities detected by Image J software were greater than any of the three controls, and thereby the ANOVA analysis leads to a statistically significant result (p = 0.0408 for Ang-1; p = 0.0113 for Ang-1).
Figure 2.
Figure 2.. Ang-1 upregulation caused by PlGF blockade requires HRP-HREC co-culture.
Primary human retinal endothelial cells (HREC) and pericytes (HRP) are cultured alone or co-cultured as described in the methods. IgG and PlGF antibodies (50 μg/ml) treated the confluent co-culture and monoculture for two days. Western blots (WB) and densitometry analysis were performed to determine the protein expression. WB results of HRP-HREC coculture (A), HRP monoculture (B), and HREC monoculture (C). Densitometry quantification results of HRP-HREC co-culture (D), HRP monoculture (E), and HREC monoculture (F). * indicates P < 0.05 compared with IgG control.
Figure 3.
Figure 3.. VEGFR1 inhibition diminishes PlGF’s effect on Ang-1 and Tie-2 expression in the HREC-HRP co-culture.
HREC and HRP were co-cultured and treated with three groups: IgG control, PlGF antibody (ab) (50 μg/ml), and PlGF ab (50 μg/ml) + VEGFR1 ab (50 μg/ml). The western blots (A) and densitometry quantification results (B). GAPDH was used as a protein loading control. (C) Resistance results were measured with the ECIS system. The results were expressed as a percentage relative to the control (mean ± SD, n = 3 for WB, n = 4 for resistance). *P < 0.05. ** P < 0.01.
Figure 4.
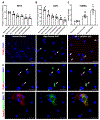
Figure 4.. VEGFR1 inhibition reduces pericyte viability in high-glucose conditions.
The pericytes were cultured with normal glucose (NG), high glucose (HG), and HG + varying VEGFR1 antibody concentrations (10, 20, 50, and 100 μg/ml). The cell lysates were used for cell viability assay with MTT (A) and the supernatant for LDH assay (B). The results expressed relative cell viability to NG (mean ±SD, n=6). (C and D) The TUNEL (+) apoptotic cells were counted for NG, HG, and HG + 50 μg/ml VEGFR1 antibody. # P < 0.05 (compared to normal glucose). * P < 0.05 (compared to high glucose). (E, F) Double immunofluorescent labeling was performed for: pVEGFR1 and TUNEL (E), activated Caspase 3 (a-Casp3), and pVEGFR1 (F). Scale bar: 50 μm. Note that pVEGFR1 staining signals were co-localized with the TUNEL(+) and a-Casp3 (+) apoptotic cells. The colocalization of TUNEL and DAPI was demonstrated with individual channels in Fig. S4.
Fig 5.
Fig 5.. Blood vessels of vascular organoids.
Vascular organoids were generated from human induced pluripotent stem cells (iPSC). (A-C) The 3-dimensional (3D) vascular organoids were whole-mounted for the immunofluorescent staining with endothelial cell marker CD31, pericyte marker PDGFRb, and basement marker Collagen IV. The corresponding secondary antibodies conjugated with Cy5 (PDGFRb), Alexa fluor 488 (CD31), and pacific blue (Col IV) were used for the visualization and imaging with confocal microscopy. (D) illustrated the three dimensions of one vascular organoid (~500 μm x 500 μm x 100 μm).
Figure 6.
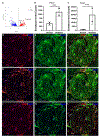
Figure 6.. PlGF is expressed in perivascular (pericyte) cells and up-regulated by diabetes-mimicking conditions in the human iPSC-derived vascular organoids.
(A-C) Bioinformatic RNA sequencing analysis revealed that diabetes-mimicking conditions up-regulated PlGF and Ang2. Volcano plot (A) showed the differentially expressed genes between normal and diabetic conditions, in which arrows indicated PlGF and Ang2. Their expression levels were shown in PlGF (B) and Ang2 (C). *** P < 0.0001.(D-L) Double labeling revealed PlGF and Ang2 had a perivascular (pericyte) localization in the human iPSC-derived vascular organoids. Scale bar: 150 μm.
Figure 7.
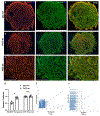
Figure 7.. PlGF blockade up-regulates Ang-1 and Tie-2 in human iPSC-derived vascular organoids.
Vascular organoids were generated from human iPSC as described in the methods. 100 μg/ml PlGF antibody was supplemented into the culture medium and incubated for 4 days. IgG was used as a control. 10-micron cryopreserved sections were made for immunofluorescent staining with anti-Ang-1 and anti-Tie-2 antibodies. The secondary antibodies with Alex Fluor 647 (infrared) and 488 (green) were used for visualization and microphotography with EVOS M7000 fluorescent microscope (A, B). Scale bar: 75 μm. (C) Quantification results of the fluorescent images measured with ImageJ software (n = 6). *** P < 0.0001. The fluorescent images from each channel were made with the same exposure time for both control and antibody treatment conditions to minimize the variations caused by the fluorescent imaging process. The expression levels were measured based on the mean pixel intensity per image (6 images total). The two additional example images used for quantification were shown in Suppl. Fig. 4. Note that Ang-1 had a peri-vascular (pericyte) expression pattern similar to PlGF and Ang2. (D) qRT-PCR results of Tie-2 and Ang-1 mRNA transcripts. The values represent the change folds relative to the control (n = 6). *** P < 0.0001.
Figure 8.
Figure 8.. PlGF blockade promotes the pericytes coverage and association with ECs in vascular organoids.
Vascular organoids (VO) were derived from human iPSC derived. The VO micrographs double-stained with CD31 (red channel) and PDGFRb (green channel) were processed for colocalization analysis with Image J software and the JACop plugin. (A and B) The micrographs were from the control group (A) and PlGF antibody treatment (B). Scale bar: 275 μm. (C) The box areas in Panel B showed the colocalization of CD31 (red) and PDGFRb (green). Scale bar: 150 μm. (D) The Manders’ overlay coefficients indicate the degree of colocation: M1 stands for the green (PDGFRb+ pericytes), and M2 for the red (CD31+ EC). The values were expressed as mean percentage ± SD (n = 6). * Indicates p <0.05. N.S: Non-Significance. (E and F) Cytofluorogram showed the Pearson correlation coefficients between the green and red channels (E: IgG control; F: PlGF ab).

Similar articles

Cited by

References

    1. Antonetti DA, Klein R, Gardner TW. Diabetic retinopathy. N Engl J Med 2012;366(13): 1227–39. - PubMed
    1. Du Y, Veenstra A, Palczewski K, Kern TS. Photoreceptor cells are major contributors to diabetes-induced oxidative stress and local inflammation in the retina. Proc Natl Acad Sci U S A 2013;110(41):16586–91. - PMC - PubMed
    1. Ghirlanda G, Di Leo MA, Caputo S, Cercone S, Greco AV. From functional to microvascular abnormalities in early diabetic retinopathy. Diabetes Metab Rev 1997;13(1):15–35. - PubMed
    1. Barber AJ, Baccouche B. Neurodegeneration in diabetic retinopathy: Potential for novel therapies. Vision Res 2017;139:82–92. - PubMed
    1. Miller WP, Yang C, Mihailescu ML, Moore JA, Dai W, Barber AJ, Dennis MD. Deletion of the Akt/mTORC1 Repressor REDD1 Prevents Visual Dysfunction in a Rodent Model of Type 1 Diabetes. Diabetes 2018;67(1):110–119. - PMC - PubMed

Publication types