. 2023 Dec;12(1):2154617.
doi: 10.1080/22221751.2022.2154617.

A comparative analysis exposes an amplification delay distinctive to SARS-CoV-2 Omicron variants of clinical and public health relevance

Affiliations

A comparative analysis exposes an amplification delay distinctive to SARS-CoV-2 Omicron variants of clinical and public health relevance

K L Brown et al. Emerg Microbes Infect. 2023 Dec.

Abstract

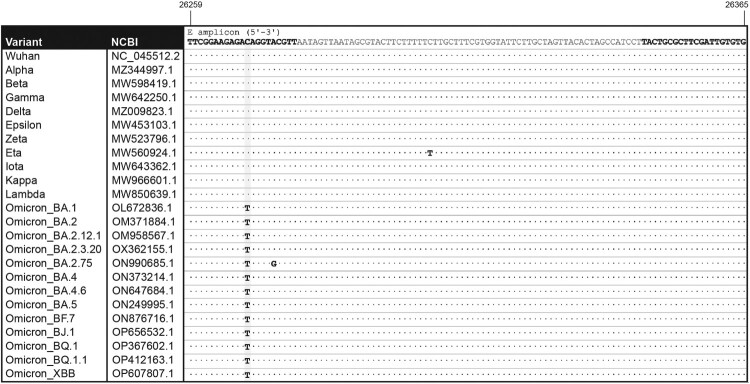
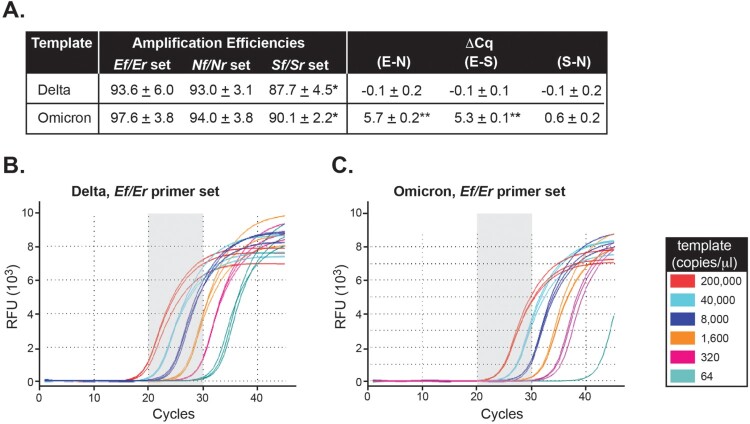
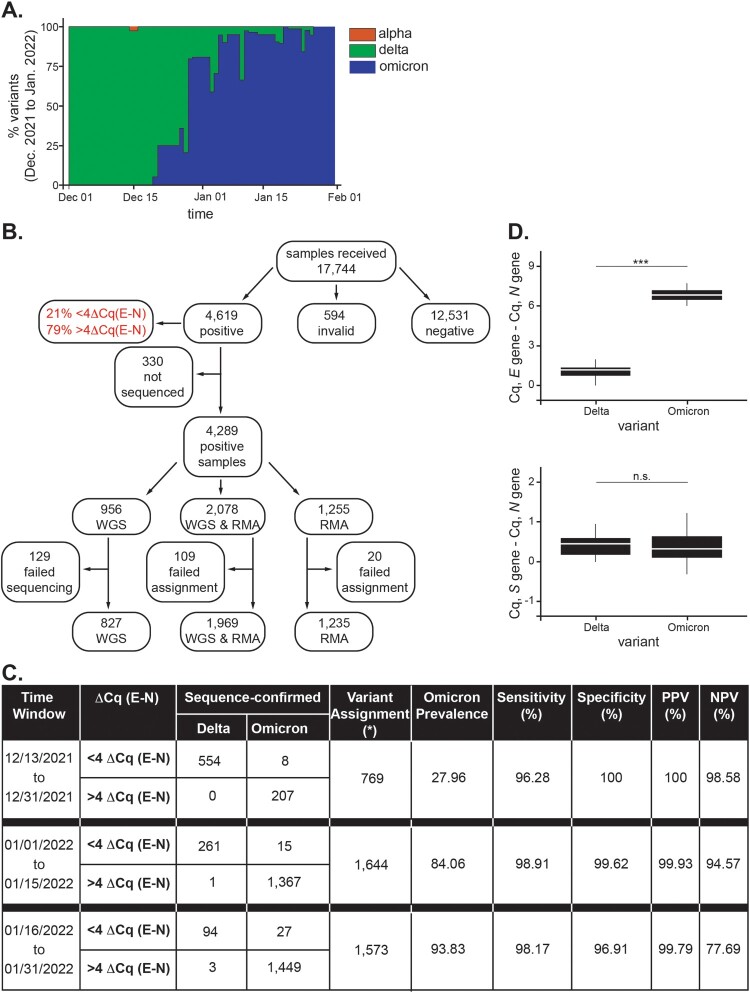
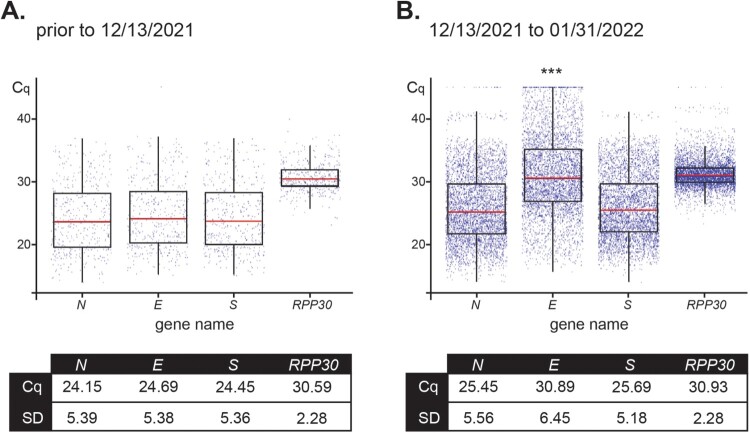
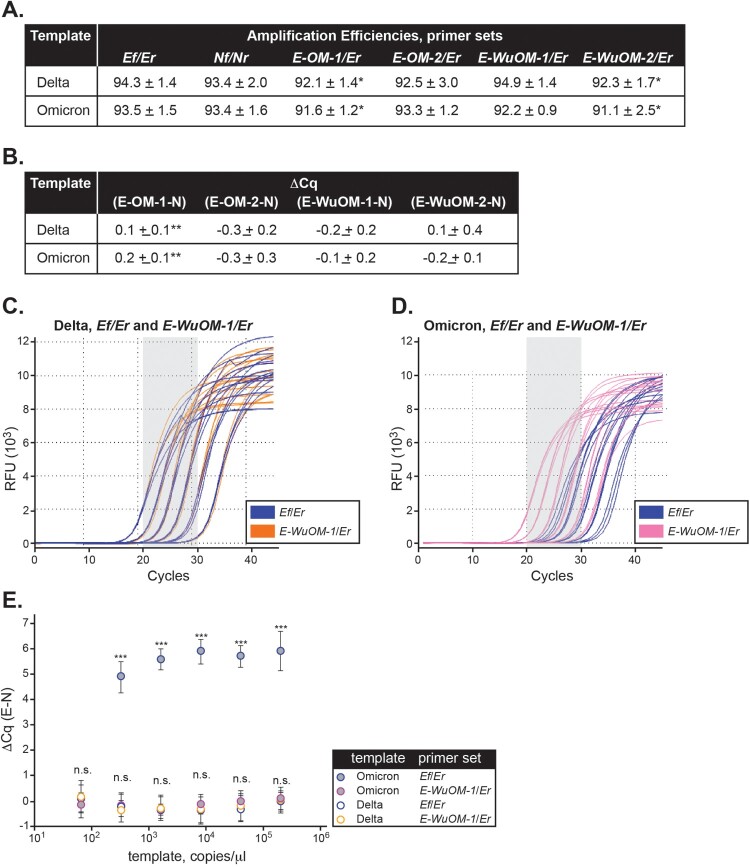
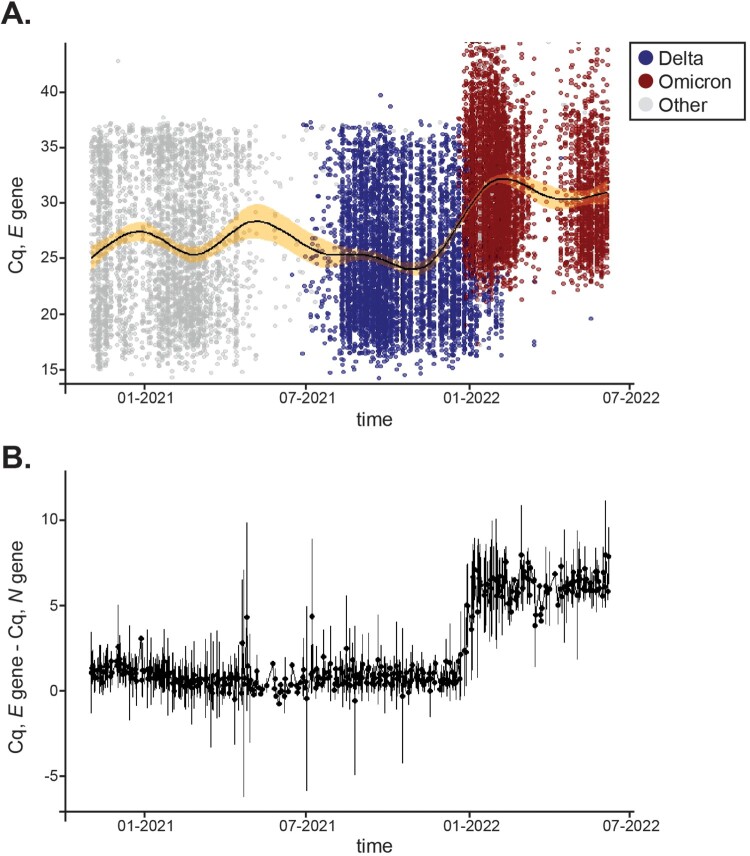
ABSTRACTMutations in the SARS-CoV-2 genome may negatively impact a diagnostic test, have no effect, or turn into an opportunity for rapid molecular screening of variants. Using an in-house Emergency Use Authorized RT-qPCR-based COVID-19 diagnostic assay, we combined sequence surveillance of viral variants and computed PCR efficiencies for mismatched templates. We found no significant mismatches for the N, E, and S set of assay primers until the Omicron variant emerged in late November 2021. We found a single mismatch between the Omicron sequence and one of our assay's primers caused a > 4 cycle delay during amplification without impacting overall assay performance.Starting in December 2021, clinical specimens received for COVID-19 diagnostic testing that generated a Cq delay greater than 4 cycles were sequenced and confirmed as Omicron. Clinical samples without a Cq delay were largely confirmed as the Delta variant. The primer-template mismatch was then used as a rapid surrogate marker for Omicron. Primers that correctly identified Omicron were designed and tested, which prepared us for the emergence of future variants with novel mismatches to our diagnostic assay's primers. Our experience demonstrates the importance of monitoring sequences, the need for predicting the impact of mismatches, their value as a surrogate marker, and the relevance of adapting one's molecular diagnostic test for evolving pathogens.

Keywords: COVID-19; Delta variant; Omicron variant; RT-qPCR; SARS-CoV-2; amplification efficiency; diagnosis; mismatch.


Conflict of interest statement

No potential conflict of interest was reported by the author(s).

Figures

Figure 1.
Figure 1.
Alignment of the E primer pair to representative target sequences. Location of forward and reverse E primers within the E gene are indicated (bold) in the sequence of SARS-CoV-2 (Wuhan strain, NC_045512.2). The amplicon sequences are shown for the following SARS-CoV-2 variants: Alpha (MZ344997.1), Beta (MW598419.1), Gamma (MW642250.1), Delta (MZ009823.1), Epsilon (MW453103.1), Zeta (MW523796.1), Eta (MW560924.1), Iota (MW643362.1), Kappa (MW966601.1), Lambda (MW850639.1), Omicron BA.1 (OL672836.1), BA.2 (OM371884.1), BA.2.12.1 (OM958567.1), BA.2.3.20 (OX362155.1), BA.2.75 (ON990685.1), BA.4 (ON373214.1), BA.4.6 (ON647684.1), BA.5 (ON249995.1), BF.7 (ON876716.1), BJ.1 (OP656532.1), BQ.1 (OP367602.1), BQ.1.1 (OP412163.1) and XBB (OP607807.1).
Figure 2.
Figure 2.
The Ef mismatch causes a quantification cycle delay but does not affect amplification efficiency in Omicron. A, Average amplification efficiencies and average ΔCq values for each target region were determined based on the slope of the individual amplification curves using Delta or Omicron as template and each of the Nf/Nr, Ef/Er, and Sf/Sr set of primers. *Statistically significant difference in amplification efficiency between the S set of primers and either E or N (p < 0.001). **Statistically significant difference for ΔCq values between Delta and Omicron (p < 0.001). (B-C) Background-adjusted fluorescence curves generated using the CFX Maestro Software (BioRad) obtained when using the Ef primer and serial dilutions of Delta (B) and Omicron (C) synthetic templates (at 200,000, 40,000, 8,000, 1,600, 320, or 64 copies/μl). All samples were run in triplicate.
Figure 3.
Figure 3.
Screening of SARS-CoV-2-positive clinical samples for Omicron by RT-qPCR and sequencing. A, Summary of weekly distribution of SARS-CoV-2 variants circulating in Southwest Virginia between December 1, 2021 and January 31, 2022 as determined by RT-qPCR, RMA, and WGS sequencing. B, From December 13, 2021 to January 31, 2022, samples (17,744) were received and analyzed for SARS-CoV-2 presence using our FDA-authorized SARS-CoV-2 developed test [7]. Of these samples, there were 4,619 positives (defined as those that generate a positive signal in at least 2 of the SARS-CoV-2 genes and the housekeeping RPP30 gene). Samples were considered invalid (594) when there was no detectable expression of the RPP30 gene. Among positives, 330 samples were deemed not suited for sequencing due to their RNA quality or high Cq value for SARS-CoV-2 genes. Of the remaining 4,289 positive samples, 956 were subjected to whole genome sequencing, 1,255 to rapid mutational analysis, and 2,078 to both sequencing methods. A few samples failed sequence analysis (indicated in B) or were not assigned a variant type by Pangolin. C, Summary shows the number of samples confirmed by sequencing and assigned to a specific variant. * Indicates samples for which RMA and WGS provided opposite variant assignments [22 unassigned samples for >4 ΔCq (E-N) and 23 unassigned samples for <4 ΔCq (E-N)]. PPV and NPV indicate positive and negative predicted values, respectively. D. Box plots represent mean differences between E, or S, and N Cq values for positive samples tested (n = 20 for each Delta and Omicron). Error bars represent SD (p < 0.001).
Figure 4.
Figure 4.
Distribution of Cq values for assay primers show a variant-dependent delay for amplification of E. Box plots represent mean Cq ± SD values for the SARS-CoV-2 genes N, E, and S, and housekeeping RPP30 for 436 positive samples received prior to December 13, 2021 (100% Delta as determined by RMA and/or WGS) (A) and 4,619 positive samples analyzed from December 13, 2021 to January 31,2022 (79% Omicron and 21% Delta as determined by RMA and/or WGS) (B).*** Indicates significant difference between the E value prior to 12/13/2021 and from 12/13/2021–01/31/2022 as determined by two-way ANOVA followed by a Tukey test (p < 0.0001).
Figure 5.
Figure 5.
Newly designed E forward primers efficiently recognize Delta and Omicron variants. Ef, E-OM-1, E-OM-2, E-WuOM-1, or E-WuOM-2 primers were paired with Er (Table 1 and Sup. Table 1) and Nf paired to Nr for RT-qPCR using Delta or Omicron synthetic templates. Decreasing one-fifth dilutions series of each template was used in each assay and amplification efficiencies (A) and ΔCq values (B) calculated as described in Materials and Methods. * Indicates statistically significant difference between the amplification efficiency of E-OM-1/Er, or E-WuOM-2/Er versus Ef/Er (p < 0.001). ** Indicates a statistically significant difference between the Cq delay generated by E-OM-1 versus E-OM-2, E-WuOM-1, or E-WuOM-2 primers (p < 0.001). A typical run using the Ef/Er and E-WuOM-1/Er primer sets for Delta and Omicron is depicted in C and D, respectively. Serial dilutions of each template show amplification curves matched for both primer sets using Delta as a template (blue and orange lines in c) and shifted back using Omicron for the new E-WuOM-1/Er set (pink, D). E. Average ΔCq calculated for each concentration of the four primer sets used to generate the plots depicted in C and D. Standard deviation of the mean is shown in each case. ***Indicates amplification using the Ef/Er primer set and Omicron as template is significantly different (p < 0.001) compared to WuOM-1 or Ef/Er and Delta template or WuOm-1/Er and Omicron as a template. No statistical difference (n.s.) was observed among WuOM-1 or Ef/Er and Delta template or WuOm-1/Er and Omicron as a template.
Figure 6.
Figure 6.
Distribution of Cq values for the E gene across variants over time. A, 16,351 positives samples were reported between January 1,2021 and July 7, 2022. Distribution of Cq values for the E gene are shown for Delta (blue) and Omicron (red) over time. Other variants’ E Cq values are represented by a gray circle. A solid black line displays average Cq for E and the shaded area shows 99% confidence intervals. B, Mean differences between E and N Cq values for positive samples tested within the same time frame. Error bars represent SD.

References

    1. Davies NG, Abbott S, Barnard RC, et al. . Estimated transmissibility and impact of SARS-CoV-2 lineage B.1.1.7 in England. Science. 2021 Apr 9;372(6538). - PMC - PubMed
    1. Volz E, Mishra S, Chand M, et al. . Assessing transmissibility of SARS-CoV-2 lineage B.1.1.7 in England. Nature. 2021;593(7858):266–269. - PubMed
    1. Wang P, Nair MS, Liu L, et al. . Antibody resistance of SARS-CoV-2 variants B.1.351 and B.1.1.7. Nature. 2021;593(7857):130–135. - PubMed
    1. Janik E, Niemcewicz M, Podogrocki M, et al. . The emerging concern and interest SARS-CoV-2 variants. Pathogens. 2021 May 21;10(6. - PMC - PubMed
    1. Robishaw JD, Alter SM, Solano JJ, et al. . Genomic surveillance to combat COVID-19: challenges and opportunities. Lancet Microbe. 2021;2(9):e481–e484. - PMC - PubMed

Supplementary concepts