. 2023 May;26(2):279-293.
doi: 10.1007/s10456-022-09863-4. Epub 2022 Dec 2.

Proinflammatory activity of VEGF-targeted treatment through reversal of tumor endothelial cell anergy

Affiliations

Proinflammatory activity of VEGF-targeted treatment through reversal of tumor endothelial cell anergy

Patrycja Nowak-Sliwinska et al. Angiogenesis. 2023 May.

Abstract

Purpose: Ongoing angiogenesis renders the tumor endothelium unresponsive to inflammatory cytokines and interferes with adhesion of leukocytes, resulting in escape from immunity. This process is referred to as tumor endothelial cell anergy. We aimed to investigate whether anti-angiogenic agents can overcome endothelial cell anergy and provide pro-inflammatory conditions.

Experimental design: Tissues of renal cell carcinoma (RCC) patients treated with VEGF pathway-targeted drugs and control tissues were subject to RNAseq and immunohistochemical profiling of the leukocyte infiltrate. Analysis of adhesion molecule regulation in cultured endothelial cells, in a preclinical model and in human tissues was performed and correlated to leukocyte infiltration.

Results: It is shown that treatment of RCC patients with the drugs sunitinib or bevacizumab overcomes tumor endothelial cell anergy. This treatment resulted in an augmented inflammatory state of the tumor, characterized by enhanced infiltration of all major leukocyte subsets, including T cells, regulatory T cells, macrophages of both M1- and M2-like phenotypes and activated dendritic cells. In vitro, exposure of angiogenic endothelial cells to anti-angiogenic drugs normalized ICAM-1 expression. In addition, a panel of tyrosine kinase inhibitors was shown to increase transendothelial migration of both non-adherent and monocytic leukocytes. In primary tumors of RCC patients, ICAM-1 expression was found to be significantly increased in both the sunitinib and bevacizumab-treated groups. Genomic analysis confirmed the correlation between increased immune cell infiltration and ICAM-1 expression upon VEGF-targeted treatment.

Conclusion: The results support the emerging concept that anti-angiogenic therapy can boost immunity and show how immunotherapy approaches can benefit from combination with anti-angiogenic compounds.

Keywords: Angiogenesis; ICAM-1; Leukocyte infiltration; Sunitinib; Tumor endothelial cell anergy.


Conflict of interest statement

The authors have no competing interests.

Figures
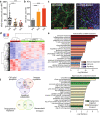
Fig. 1
Fig. 1
VEGF axis targeting inhibits vessel density, induces leukocyte infiltration, and generates an inflammatory profile in renal cell carcinoma tissues. a. Microvessel density counts in CD31/34-stained sections of RCC tumors from untreated patients (n = 53) and patients treated with 2 cycles of bevacizumab- (n = 33) or sunitinib (n = 24) monotherapy prior to cytoreductive surgery. Scatter plots show numbers of microvessels per high-power field (HPF, 0.25 mm2) for each patient. Median values are indicated, boxes extend from the 25th to 75th percentiles and the whiskers extend from the minimum to the maximum values. Statistically significant differences are indicated by asterisks (***p < 0.001), as compared to the untreated control group. b. Mean areas of necrosis, indicated by percentage of the complete tumor section, ± SEM, ***p < 0.001) as compared to the untreated control tissues. c. Representative confocal immunofluorescence microcopy images with CD31/34 (blood vessels, green), Ki-67 (proliferation marker, red) and CD45 (leukocytes, blue) staining of tissues from non-treated and sunitinib-treated RCC patients. Scalebar represents 50 µm. d. Heatmap of significantly differentially expressed genes (fold-change > 2 and adj. p-value < 0.01) between untreated and sunitinib-treated RCC. e. Top: Significantly enriched gene ontologies (GO, Biological Process) for genes upregulated in sunitinib-treated RCC. Bars are color-coded according to three prevalent functional clusters. Lengths of the bars are indicative of p-values for enrichment whereas color intensity is related to the maximum number of genes present in the denoted GO term. Bottom: Enriched gene ontologies (GO, Biological Process) for genes downregulated in sunitinib-treated RCC. f. Top: Venn diagram of overlap of sunitinib induced genes in different clusters of enriched gene ontologies. Bottom: Venn diagram of overlap of sunitinib repressed genes in different clusters of enriched gene ontologies
Fig. 2
Fig. 2
Enhanced infiltration of leukocyte subsets in RCC tumor tissues after pre-surgical treatment with VEGF-targeted therapy. Immunohistochemical detection of leukocyte subsets in RCC tissues of bevacizumab- (n = 27–33) and sunitinib (n = 27–33) treatment groups and untreated controls (n = 49–53). Stainings (brown) for total leukocytes and T lymphocytes (CD45+, CD3+, panel a), total cytotoxic T cells (CD8+) and activated granzyme B+ CD8+ T cells (panel c), regulatory T cells (FoxP3+) and mature CD83+ dendritic cells (panel e). Quantification of the intratumoral leukocyte subsets (panels b, d and f) is shown as number of cells per high-power field (HPF, 0.25 mm2). Median values are indicated, boxes extend from the 25th to 75th percentiles and the whiskers extend from the minimum to the maximum values. Statistically significant differences are indicated by asterisks (*p < 0.05, **p < 0.01, ***p < 0.001), as compared to the untreated control group. ns = not significant. The scale bar in E represents 10 µm and is valid for all photomicrographs
Fig. 3
Fig. 3
Enhanced infiltration of macrophages after VEGF-targeted therapy. a. Immunohistochemical detection of the total number of macrophages (CD68+) and the number of M2-like CD163+ macrophages in primary RCC tumor sections from patients treated with bevacizumab (n = 33) or sunitinib (n = 35) prior to cytoreductive surgery, as well as from untreated control tissues (n = 53). Scale bar represents 50 µm. Scatter plot quantifications of relative numbers of infiltrated CD68+ macrophages (b) and the subpopulation of M2-like CD163+ macrophages (c). Horizontal bars indicate the mean values for each patient group. Significance is indicated by asterisks (**p < 0.01 and ***p < 0.001)
Fig. 4
Fig. 4
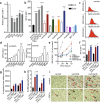
Induction of endothelial ICAM-1 expression by angiogenesis inhibitors in vitro; impact on trans-endothelial migration of leukocytes. a. Suppression of endothelial ICAM-1 expression by VEGFA (20 ng/ml) and other angiogenic growth factors (bFGF, 10 ng/ml; EGF, 40 ng/ml; aFGF, 10 ng/ml; PLGF, 50 ng/ml. Results are presented as mean ICAM-1 fluorescence intensity, ± SEM, n = 4–6). b. Induction of endothelial ICAM-1 expression by ED10 and ED50 doses of a selection of angiostatic compounds targeting a variety of signaling pathways (sunitinib 0.5 and 2.5 µM; axitinib 1 and 10 µM; erlotinib 2 and 20 µM; crenolanib 2 and 7.5 µM; imatinib 1 and 5 µM; BEZ-235 0.005 and 0.02 µM, respectively, see Suppl. Table S2), relative to a range of concentrations of the positive control TNFα (0.4–40 nM). Results are expressed as the mean fluorescence intensity, ± SEM, n = 3. c. Flow cytometric analysis of surface ICAM-1 expression on human umbilical vein endothelial cells (HUVEC) exposed for 72 h to 3 µM sunitinib or 10 µM axitinib. d. Dose-dependence of endothelial ICAM-1 induction upon treatment with sunitinib and axitinib. e. Time-dependence of ICAM-1 induction by ED50 doses of drugs. Upregulation of ICAM-1 (f) and resulting induction of spontaneous and SDF-1α-induced (200 ng/ml) transendothelial migration of non-adherent (g) and adherent (h) cells. i. Images of transmigrated adherent cells on the trans-well inserts. Significance in all panels is indicated by asterisks, *p < 0.05, **p < 0.01, ***p < 0.001, ****p < 0.0001
Fig. 5
Fig. 5
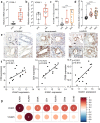
Anti-angiogenic therapy induces endothelial adhesion molecules in primary RCC tissue. a, b qPCR analysis of ICAM-1 and VCAM-1 expression in sunitinib-treated and untreated primary RCC tissues. c Quantification of the number of ICAM-1+ vessels in tumor tissues of treated (sunitinib n = 7; bevacizumab n = 16) and untreated RCC patients (n = 12). d Analysis of ICAM-1 expression density in a selection of microvessels of treated (sunitinib n = 22; bevacizumab n = 42) and untreated RCC tissues (n = 34), examples of blood vessels in e (scale bar in lower right image represents 10 µm). f, g. Correlation of gene expression based on RNAseq data of all tumors. f Correlation plots of individual samples for ICAM-1 versus CD8, CD4 and CD68 expression. g Correlation heatmap plot for all samples. Color legend indicates the Pearson correlation coefficient. Significance in all panels, unless specifically indicated, is indicated by asterisks *p < 0.05, **p < 0.01, ***p < 0.001

References

    1. Griffioen AW, Molema G. Angiogenesis: potentials for pharmacologic intervention in the treatment of cancer, cardiovascular diseases, and chronic inflammation. Pharmacol Rev. 2000;52(2):237–268. - PubMed
    1. Hanahan D, Weinberg RA. Hallmarks of cancer: the next generation. Cell. 2011;144(5):646–674. doi: 10.1016/j.cell.2011.02.013. - DOI - PubMed
    1. Huinen Z, Huijbers EJM, Van Beijnum JR, Nowak-Sliwinska P, Griffioen AW. Anti-angiogenic agents - overcoming tumor endothelial cell anergy and improving immunotherapy outcomes. Nat Rev Clin Oncol. 2021;18(8):527–540. doi: 10.1038/s41571-021-00496-y. - DOI - PubMed
    1. Ohm JE, Gabrilovich DI, Sempowski GD, Kisseleva E, Parman KS, Nadaf S, Carbone DP. VEGF inhibits T-cell development and may contribute to tumor-induced immune suppression. Blood. 2003;101(12):4878–4886. doi: 10.1182/blood-2002-07-1956. - DOI - PubMed
    1. Huang H, Langenkamp E, Georganaki M, Loskog A, Fuchs PF, Dieterich LC, Kreuger J, Dimberg A. VEGF suppresses T-lymphocyte infiltration in the tumor microenvironment through inhibition of NF-kappaB-induced endothelial activation. FASEB J. 2015;29(1):227–238. doi: 10.1096/fj.14-250985. - DOI - PubMed

Publication types

MeSH terms