Review
. 2023 May 10;123(9):6359-6411.
doi: 10.1021/acs.chemrev.2c00439. Epub 2022 Dec 2.

Methane Oxidation to Methanol

Affiliations
Review

Methane Oxidation to Methanol

Nicholas F Dummer et al. Chem Rev. .

Abstract

The direct transformation of methane to methanol remains a significant challenge for operation at a larger scale. Central to this challenge is the low reactivity of methane at conditions that can facilitate product recovery. This review discusses the issue through examination of several promising routes to methanol and an evaluation of performance targets that are required to develop the process at scale. We explore the methods currently used, the emergence of active heterogeneous catalysts and their design and reaction mechanisms and provide a critical perspective on future operation. Initial experiments are discussed where identification of gas phase radical chemistry limited further development by this approach. Subsequently, a new class of catalytic materials based on natural systems such as iron or copper containing zeolites were explored at milder conditions. The key issues of these technologies are low methane conversion and often significant overoxidation of products. Despite this, interest remains high in this reaction and the wider appeal of an effective route to key products from C-H activation, particularly with the need to transition to net carbon zero with new routes from renewable methane sources is exciting.


Conflict of interest statement

The authors declare no competing financial interest.

Figures
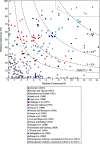
Figure 1
Figure 1
Methanol selectivity versus methane conversion for gas phase reactions. Reproduced with permission from ref (38). Copyright 2021 Elsevier.
Figure 2
Figure 2
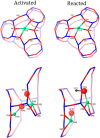
Diamond-core structure of compound Q proposed in sMMO with two Fe(IV) bridged by oxygen atoms. The numbers denote amino acids in the side chains: H, histidine; E, glutamate (Figure 6). Reproduced with permission from ref (58). Copyright 2017 American Chemical Society. Adapted with permission from ref (61). Copyright 2015 Nature.
Figure 3
Figure 3
Catalytic cycle of sMMO. Rred and Rox represent the reduced and oxidized reductase MMOR, respectively, and B is the regulatory component MMOB. Reproduced with permission from ref (62). Copyright 2015 American Chemical Society.
Figure 4
Figure 4
Experimental selectivities and conversions of single-site catalysts for methane oxidation to methanol. The image shows data whose selectivities have been extrapolated to the gas phase at 700 K, based on the relative rate constants for CH4 → CH3OH and CH3OH → CO2 derived from the difference between the free energies of activation for methane and methanol. Colors denote different catalyst morphologies, diamonds are aqueous experimental reaction conditions, and circles are gas phase. Reproduced with permission from ref (70). Copyright 2018 American Chemical Society.
Figure 5
Figure 5
Rate of methane–deuterium exchange over a range of metal oxides at 500 °C normalized for the effect of surface area. Conditions: CH4 = 0.69 mL min–1, D2 = 0.83 mL min–1, GSHV = 290 h–1. Reproduced with permission from ref (91). Copyright 2002 Elsevier.
Figure 6
Figure 6
Scanning electron micrographs of MoO3 catalysts prepared under different conditions to vary the ratio of (010) basal planes to (100) side planes. Prepared by (a) MoO3 heated under nitrogen (MoO3-C); (b) cooling of molten MoO3 (MoO3-R); (c) oxidation of thin Mo metal sheet; (d) vapor deposition of MoO3. Reproduced with permission from ref (105). Copyright 1993 Elsevier.
Figure 7
Figure 7
Changes in selectivity in methane conversion over a magnesium oxide catalyst as a function of flow rate and oxygen conversion. χ, ethane; □, ethene; ○, carbon monoxide; ◆, carbon dioxide; ●, hydrogen; Δ, formaldehyde. Values are accurate to ±1% at oxygen conversions >60%, but only to ±5% at conversions <10%. Solid lines are guides to the eye. Reproduced with permission from ref (135). Copyright 1990 Springer Nature.
Figure 8
Figure 8
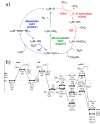
(a) General mechanism for methane oxidation to methanol by metal oxo groups. HAA, hydrogen atom abstraction; RR, radical rebound; OAT, oxygen atom transfer. (b) Calculated free energy surface (B3LYP/6-311+G(d)) for M = Ni, Cu, and Zn. The metal cations are stabilized in a metal complex with a bidentate CH5N2 ligand as shown for the [Cu]=O example inset in (b). energies are in kcal mol–1. Adapted with permission from ref (174). Copyright 2013 Elsevier.
Figure 9
Figure 9
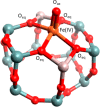
Simulated BLYP structure illustrating the Fe4+=O α-oxygen site within a six-member ring of the Fe-CHA zeolite structure. Adapted with permission from ref (188). Copyright 2018 American Chemical Society.
Figure 10
Figure 10
Reaction schematic the introduction of α-Fe into six-membered rings within zeolite (CHA 6-MR or *BEA β-6MR), the reaction of α-Fe with N2O to produce α-oxygen and then methane activation, radical rebound to produce methanol which is extracted from the zeolite by steaming. Color scheme: C, light gray; H, white; O, red; Fe, orange; Si, gray; Al, light brown. Reproduced with permission from ref (188). Copyright 2018 American Chemical Society.
Figure 11
Figure 11
Mechanistic scheme of quasicatalytic and catalytic oxidation of methane. Solid lines indicate the steps that are present in both the quasicatalytic and catalytic modes of the reaction. Dotted lines display the steps that are present only in the catalytic mode. Adapted with permission from ref (200). Copyright 2014 Elsevier.
Figure 12
Figure 12
Proposed reaction network for CH4 oxidation with N2O over Fe-ZSM-5 catalysts according to delplot analysis; B is Brønsted acid site, and * indicates adsorbed or intermediate species not detected in the reactor effluent. Reproduced with permission from ref (207). Copyright 2018 Wiley-VCH.
Figure 13
Figure 13
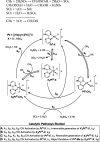
Plausible pathways for the Periana–Catalytica system that may account for the observed high stability. A postulated “self repair” mechanism is shown that returns X2PtIV-X species, which is inactive for C–H activation, to an active PtII-X form. Reproduced with permission from ref (221). Copyright 2013 American Chemical Society.
Figure 14
Figure 14
Proposed reaction mechanism for methane to acetic acid with Pd2+ catalyst in 96% H2SO4. Reproduced with permission from ref (229). Copyright 2006 Elsevier.
Figure 15
Figure 15
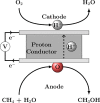
Schematic of an electrochemical cell for the overall conversion of methane to methanol. The anode reaction is CH4(g) + H2O(g) → CH3OH(g) + 2H+ + 2e, and the cathode reaction is 1/2O2(g) + 2H+ + 2e → H2O(g). Reproduced with permission from ref (238). Copyright 2016 American Chemical Society.
Figure 16
Figure 16
Selectivity as a function of time for methane oxidation using H2O2 as oxidant in the presence of a 1 wt % AuPd/TiO2 catalyst prepared by incipient wetness. Symbols: methyl hydroperoxide (▲), methanol (◆), CO2 (●) and methane conversion (crosses). Reaction conditions: P(CH4) = 30.5 bar, [H2O2] = 0.5 M, T = 50 °C, stirring rate = 1500 rpm, and catalyst mass = 10 mg. Reproduced with permission from ref (250). Copyright 2012 Wiley-VCH.
Figure 17
Figure 17
Calculated structures and energies for H2O2 decomposition (a–c) and the disproportionation of the resulting surface OH* groups (d–f). Energies relative to intermediates (a for a–c and d for d–f) in kJ mol–1 given underneath graphics, distances indicated on graphics in Å, * indicates an adsorbed species. Atom colors: Pd, blue; O, red; H, white. PBE simulations carried out with a periodic slab model four layers thick, only upper two levels are shown. Adapted with permission from ref (252). Copyright 2011 American Chemical Society.
Figure 18
Figure 18
Methane oxidation reactions carried out over unsupported Au–Pd colloids. (A) Gain factor (blue), selectivity (red), and total amount of products (green) as a function of the different amounts of H2O2 used. (B) GC-MS spectra of CH3OH formed (mass = 32 and 34 for CH316OH and CH318OH, respectively) during methane oxidation with a Au–Pd colloid via H216O2 + 16O2 (upper spectrum) or H216O2 + 18O2 (lower spectrum). For CH4 oxidation with 18O2, >70% of 18O2 molecules were incorporated in the CH3OH product. m/z, mass/charge ratio. Adapted with permission from ref (278). Copyright 2017 AAAS.
Figure 19
Figure 19
Oxidation of methane via the in situ generation of H2O2 from H2 and O2 over various AuPd@ZSM-5 catalysts. Histograms show methanol (black) and formic acid (red) productivities, blue points give methane conversion. Reaction conditions: 10 mL of water, 30 min, 70 °C, 27 mg of catalyst, feed gas at 3.0 MPa with 3.3% H2/6.6% O2/1.6% CH4/61.7% Ar/26.8% He, and 1200 rpm (rpm). Adapted with permission from ref (262). Copyright 2020 AAAS.
Figure 20
Figure 20
(a) A potential reaction scheme for the oxidation of methane proposed by Hammond et al. Methanol is formed through the conversion of the methyl hydroperoxide intermediate over the Fe sites present in the catalyst. OH radicals produced during the reaction are later responsible for the overoxidation of methanol. (b) The catalytic cycle for the oxidation of methane to CH3OOH using H2O2, catalyzed by a binuclear Fe species in ZSM-5, proposed by Hammond et al. The overall charge in each case is formally +2 as the species act as an extra-framework cation within the zeolite. Adapted with permission from ref (144). Copyright 2012 Wiley-VCH.
Figure 21
Figure 21
(a) Proposed two parallel pathways for direct methane oxidation to methanol in the aqueous media using H2O2 as the oxidant. (b) A posed molecular mechanism for the direct oxidation of methane to methanol over a mononuclear Fe5+=O active site. Red, purple, gray, and white spheres represent O, Fe, C, and H atoms, respectively. Adapted with permission from ref (308). Copyright 2021 American Chemical Society.
Figure 22
Figure 22
Proposed catalytic cycle for methane partial oxidation to methanol over Rh@ZSM-5. The steps, going clockwise, are methane activation, oxygen insertion, peroxide decomposition, methyl–hydroxyl coupling, and methanol desorption. CO is required for a ligand effect for the methanol formation step. Adapted with permission from ref (329). Copyright 2020 the Royal Society of Chemistry.
Figure 23
Figure 23
(A) Two-step stoichiometric methane-to-methanol reaction on Cu-ZSM-5 zeolite, in which O2 was first activated to form [CuO2Cu]2+ species on Cu-ZSM-5, then CH4 was introduced with CH3OH detected after extraction. (B) Amount of methanol extracted per gram of Cu-ZSM-5 sample as a function of the Cu/Al ratio of the Cu-ZSM-5 samples. (C) Amount of methanol extracted per gram of Cu sample as a function of the Cu wt % of the Cu containing zeolites. Adapted with permission from ref (335). Copyright 2005 American Chemical Society.
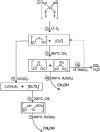
Figure 24
Figure 24
(A) Methanol yield per copper for MAZ-fast and MAZ-slow for different stepwise procedures for the conversion of methane to methanol. (B) SEM micrographs of MAZ-slow and MAZ-fast. Adapted with permission from ref (341). Copyright 2011 The Royal Society of Chemistry.
Figure 25
Figure 25
Comparison of (A) the conventional procedure and (B) the isothermal procedure of the stepwise oxidation of methane to methanol with offline water extraction. Adapted with permission from ref (346). Copyright 2020 American Chemical Society.
Figure 26
Figure 26
Catalytic cycle of methane oxidation to methanol on Cu–MOR. (A) Methanol yields after activation at 450 °C and off-line extraction at different pressures of oxygen and methane. (B) Dependence of methanol yield on methane pressure after 13 h activation at 200 °C, 1 bar of oxygen, and off-line extraction. (C) Methanol yields after consecutive cycles, consisting of activation for 8 h at 1 bar of oxygen, reaction with methane at 6 bar, and extraction with steam. The liquid was collected by condensation of the reactor effluent. Adapted with permission from ref (343). Copyright 2016 John Wiley and Sons.
Figure 27
Figure 27
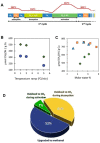
(A) Three-step cyclic reaction of methane oxidation to methanol on Cu–MOR. (B) Effect of regeneration gas composition and temperature ramp on methanol yield. Symbols: activation with pure oxygen (blue dot) and activation with synthetic air (green diamond). (C) Effect of desorption gas composition and N2 flow rate on methanol yield. Symbols: 150 mL min–1 (yellow square), 190 mL min–1 (blue triangle), and 220 mL min–1 (green diamond). (D) Percentage of the CH4 adsorbed on the catalyst that was transformed into methanol (blue: 52%), fully oxidized during desorption (yellow: 41%), and eliminated during the activation of the catalyst (green: 7%). Adapted with permission from ref (348). Copyright 2020 Elsevier.
Figure 28
Figure 28
(A) Schematic representation of the reaction conditions of the partial oxidation of methane by water, involving the regeneration of the active oxygen site on Cu–MOR by water. (B) Methanol yield and selectivity across multiple cycles, each involving a helium activation at either 400 °C (red line and blue bars) or 200 °C (yellow line and green bars), followed by methane reaction and then catalyst reactivation by water at 200 °C. (C) Mass spectral responses for unlabeled (m/z = 31) and 18O-labeled (m/z = 33) methanol after first and second cycle with labeled H218O, respectively. Adapted with permission from ref (349). Copyright 2017 AAAS.
Figure 29
Figure 29
Methane oxidation over Cu-ZSM-5 after an initial dry methane oxidation (under 2400 mL h–1 gcat–1 of methane at 210 °C for 0.5 h). Methanol partial pressure with He (0.981 bar), H2O (0.032 bar), and O2 (0.000025 bar, 25 ppm) over (blue open squares) Cu-Na-ZSM-5 (Cu/Al = 0.37, Na/Al = 0.26). Methanol partial pressure with CH4 (0.981 bar), H2O (0.032 bar), and O2 (0.000025 bar, 25 ppm) over (solid squares) Cu-Na-ZSM-5 and (red solid triangles) Cu-H-ZSM-5 (Cu/Al = 0.31). Catalyst pretreatment: 5 h at 550 °C under oxygen flow, cooled to 210 °C under oxygen flow, and then purged under He for 0.5 h. Initial dry methane oxidation: 0.5 h under 2400 mL h–1 gcat–1 of methane at 210 °C. Reaction conditions: T = 210 °C, WHSV = 2400 mL h–1 gcat–1. Adapted with permission from ref (350). Copyright 2016 American Chemical Society.
Figure 30
Figure 30
Structures of Cu-OMG zeolites, Cu/O2 (450 °C), and Cu/CH4 (200 °C). (top)\ Coordination of the Cu(1)2+ ions in a 6-ring of a gme cavity showing the difference between an occupied (front) and an unoccupied (back) 6-ring. (bottom) Coordination geometries of Cu(2) and Cu(3) before and after the introduction of CH4. Reproduced with permission from ref (356). Copyright 2021 John Wiley and Sons.
Figure 31
Figure 31
UV–vis spectra of O2-activated Cu-ZSM-5 during reaction with CH4 (5% in N2, 25 mL min–1) at 175 °C (left) and at 25 °C (right). Reproduced with permission from ref (335). Copyright 2005 American Chemical Society.
Figure 32
Figure 32
Resonance Raman (rR) spectra of O2-activated Cu-ZSM-5. (A) rR spectra of O2-activated Cu-ZSM-5 (Cu/Al = 0.54) collected at eight λexs from 351 to 568 nm with corresponding absorption spectrum inset. (B) rR spectra (λex = 457.9 nm) of O2-activated Cu-ZSM-5 with varying Cu/Al ratios from 0.10 to 0.54 with corresponding absorption spectra inset. (C) rR spectra (λex = 457.9 nm) of Cu-ZSM-5 (Cu/Al = 0.54) pretreated in O2 at 450 °C, recorded before and after heating in He at 723 K and after reaction with CH4 at 473 K. (D) rR spectra (λex = 457.9 nm) of Cu-ZSM-5 activated by 16O2 (red) and 18O2 (blue). Reproduced with permission from ref (361). Copyright 2009 PNAS.
Figure 33
Figure 33
Mono (μ-oxo) dicopper species in the MFI (A) and CHA (B) lattices and their bidentate oxygen ligation in MFI (C) and CHA (D) assigning out-of-plane (OOP) and in-plane (IP) ligation with respect to the Cu–O–Cu plane. Reproduced with permission from ref (364). Copyright 2021 American Chemical Society.
Scheme 1
Scheme 1. Formation of Mono (μ-oxo) Dicopper Reactive Intermediate on Cu-Zeolite
Reproduced with permission from ref (367). Copyright 2010 American Chemical Society.
Figure 34
Figure 34
(A) BAS consumption and total methanol yield as a function of the Cu concentration for Cu–MOR with Si/Al = 11. *The slope of 0.69 indicates an exchange stoichiometry of 2/3, meaning that two H+ are substituted by three Cu2+. The offset of 74 μmol g–1 shows slight dealumination of framework Al (∼5%) during Cu exchange. **The slope of 0.31 indicates that three Cu atoms are involved in the oxidation of one methane molecule. (B) Optimal model structure stabilized by two anionic Si-O-Al sites at the entrance of the MOR side pocket. Reproduced with permission from ref (370). Copyright 2015 Springer Nature.
Scheme 2
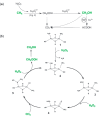
Scheme 2. Possible Catalytic Cycle for the Methane to Methanol Conversion by MO+-ZSM-5
Reproduced with permission from ref (379). Copyright 2016 American Chemical Society.
Scheme 3
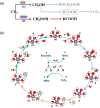
Scheme 3. Reaction Scheme for Partial Methane Oxidation to Methanol for 8MR-[CuOH]+ Site in Cu–CHA Zeolite
Reproduced with permission from ref (355). Copyright 2016 American Chemical Society.
Scheme 4
Scheme 4. Proposed Scheme of Structural Changes of the Active Cu Species in Cu-Zeolite
Reproduced with permission from ref (383). Copyright 2014 American Chemical Society.
Scheme 5
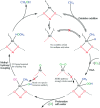
Scheme 5. Activation of Methane C–H Bond to Methanol by [Cu3O3]2+ Active Site, with Steam-Facilitated Extraction of Products and Regeneration of the Active Copper Oxo Cluster
Reproduced with permission from ref (388). Copyright 2021 John Wiley and Sons.

References

    1. Energy Outlook; BP, 2022; https://www.bp.com/en/global/corporate/energy-economics/energy-outlook.html (accessed 2022-04-09).
    1. Sheldon D. Methanol Production - A Technical History. Johnson Matthey Technology Review 2017, 61, 172–182. 10.1595/205651317X695622. - DOI
    1. LNG Market Trends and Their Implications; IEA, 2019; https://www.iea.org/reports/lng-market-trends-and-their-implications (accessed 2021-08-29).
    1. World Energy Outlook 2021; IEA; https://www.iea.org/reports/world-energy-outlook-2021 (accessed 2022-02-08).
    1. Understanding Global Warming Potentials; EPA, 2022; https://www.epa.gov/ghgemissions/understanding-global-warming-potentials (accessed 2022-04-07).