

Long-term cardiovascular health status and physical functioning of nonhospitalized patients with COVID-19 compared with non-COVID-19 controls
- PMID: 36459448
- PMCID: PMC9870581
- DOI: 10.1152/ajpheart.00335.2022
Long-term cardiovascular health status and physical functioning of nonhospitalized patients with COVID-19 compared with non-COVID-19 controls
Abstract
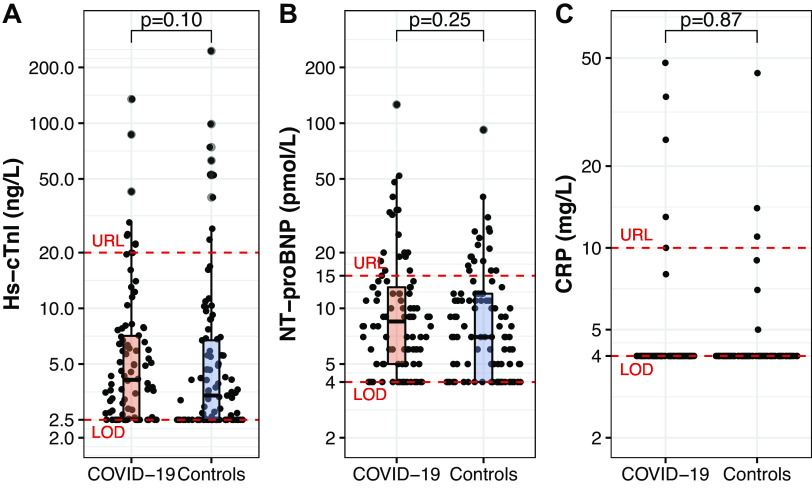
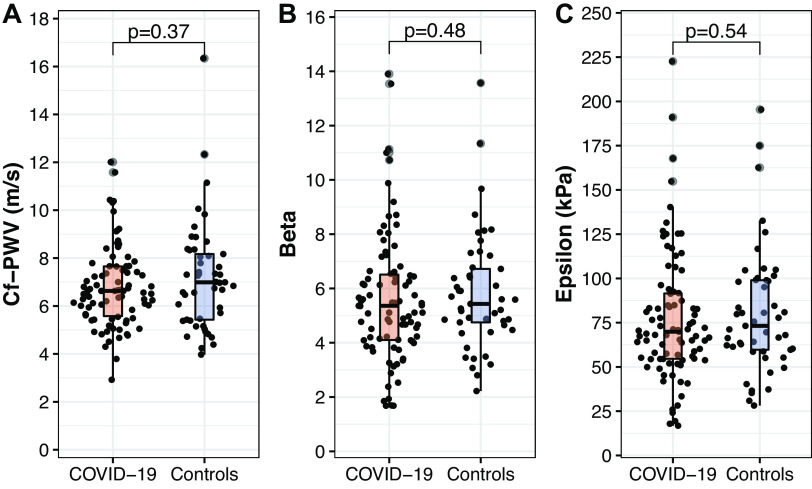
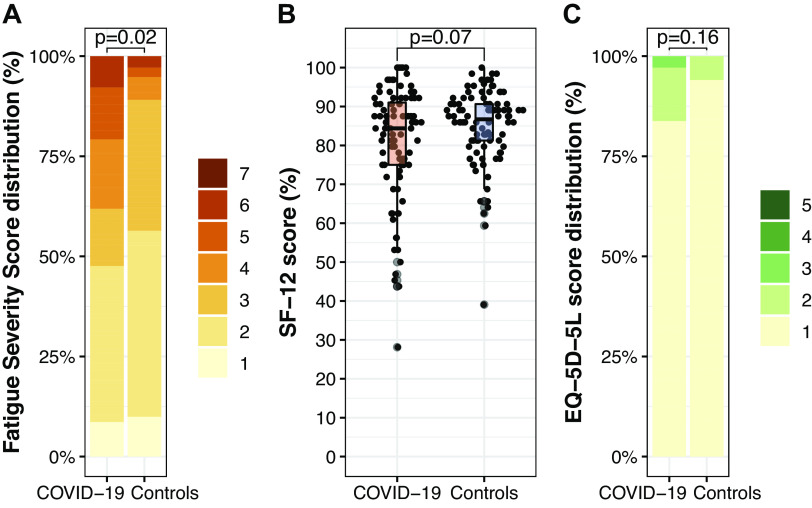
Coronavirus disease 2019 (COVID-19) is reported to have long-term effects on cardiovascular health and physical functioning, even in the nonhospitalized population. The physiological mechanisms underlying these long-term consequences are however less well described. We compared cardiovascular risk factors, arterial stiffness, and physical functioning in nonhospitalized patients with COVID-19, at a median of 6 mo postinfection, versus age- and sex-matched controls. Cardiovascular risk was assessed using blood pressure and biomarker concentrations (amino-terminal pro-B-type-natriuretic-peptide, high-sensitive cardiac troponin I, C-reactive protein), and arterial stiffness was assessed using carotid-femoral pulse wave velocity. Physical functioning was evaluated using accelerometry, handgrip strength, gait speed and questionnaires on fatigue, perceived general health status, and health-related quality of life (hrQoL). We included 101 former patients with COVID-19 (aged 59 [interquartile range, 55-65] yr, 58% male) and 101 controls. At 175 [126-235] days postinfection, 32% of the COVID-19 group reported residual symptoms, notably fatigue, and 7% required post-COVID-19 care. We found no differences in blood pressure, biomarker concentrations, or arterial stiffness between both groups. Former patients with COVID-19 showed a higher handgrip strength (43 [33-52] vs. 38 [30-48] kg, P = 0.004) and less sleeping time (8.8 [7.7-9.4] vs. 9.8 [8.9-10.3] h/day, P < 0.001) and reported fatigue more often than controls. Accelerometry-based habitual physical activity levels, gait speed, perception of general health status, and hrQoL were not different between groups. In conclusion, one in three nonhospitalized patients with COVID-19 reports residual symptoms at a median of 6 mo postinfection, but we were unable to relate these symptoms to increases in cardiovascular risk factors, arterial stiffness, or physical dysfunction.NEW & NOTEWORTHY We examined cardiovascular and physical functioning outcomes in nonhospitalized patients with COVID-19, at a median of 6 mo postinfection. When compared with matched controls, minor differences in physical functioning were found, but objective measures of cardiovascular risk and arterial stiffness did not differ between groups. However, one in three former patients with COVID-19 reported residual symptoms, notably fatigue. Follow-up studies should investigate the origins of residual symptoms and their long-term consequences in former, nonhospitalized patients with COVID-19.
Keywords: COVID-19; cardiovascular health; long-term effects; nonhospitalized; physical functioning.
Conflict of interest statement
No conflicts of interest, financial or otherwise, are declared by the authors.
Figures

Comment in
-
Closing the window on COVID-19 case-control studies.Am J Physiol Heart Circ Physiol. 2023 Mar 1;324(3):H364-H365. doi: 10.1152/ajpheart.00048.2023. Epub 2023 Feb 3. Am J Physiol Heart Circ Physiol. 2023. PMID: 36735404 Free PMC article. No abstract available.
References
-
- World Health Organization. WHO Coronavirus (COVID-19) Dashboard (Online). https://covid19.who.int/ [2022 Jan 10].
-
- Task Force for the management of COVID-19 of the European Society of Cardiology. European Society of Cardiology guidance for the diagnosis and management of cardiovascular disease during the COVID-19 pandemic: part 1—epidemiology, pathophysiology, and diagnosis. Eur Heart J 43: 1033–1058, 2021. [Erratum in Eur Heart J, 2021]. doi: 10.1093/eurheartj/ehab696. - DOI - PMC - PubMed
-
- Cascella M, Rajnik M, Aleem A, Dulebohn SC, Di Napoli R. Features, evaluation, and treatment of coronavirus (COVID-19). In: StatPearls. Treasure Island, FL: StatPearls Publishing LLC., 2021. - PubMed
-
- Nalbandian A, Sehgal K, Gupta A, Madhavan MV, McGroder C, Stevens JS, Cook JR, Nordvig AS, Shalev D, Sehrawat TS, Ahluwalia N, Bikdeli B, Dietz D, Der-Nigoghossian C, Liyanage-Don N, Rosner GF, Bernstein EJ, Mohan S, Beckley AA, Seres DS, Choueiri TK, Uriel N, Ausiello JC, Accili D, Freedberg DE, Baldwin M, Schwartz A, Brodie D, Garcia CK, Elkind MSV, Connors JM, Bilezikian JP, Landry DW, Wan EY. Post-acute COVID-19 syndrome. Nat Med 27: 601–615, 2021. doi: 10.1038/s41591-021-01283-z. - DOI - PMC - PubMed
Publication types
MeSH terms
Substances
LinkOut - more resources
Full Text Sources
Medical
Research Materials